Last week, the cryptocurrency market continued its sideways movement. Bitcoin experienced a phased rebound after its previous rapid decline, but from the perspective of overall structure and trading volume, the current market is still in a weak range-bound consolidation phase, with the medium-term trend not fundamentally changed yet.
In such a market environment, we continue to strictly execute our strategies according to the established trading system: on one hand, persistently tracking the evolution of HYPE's Wave III main advancing structure; on the other hand, conducting short-term spread trading and medium-term trend position management around BTC's range-bound pattern.
This week's report will provide a systematic review and analysis of last week's market structure, trade execution, and potential market evolution paths this week, along with corresponding trading strategy references.
Trading Report Core Summary:
• In-depth Deconstruction of HYPE's Multi-Timeframe Structure: Weekly Tracking. (See Part 1)
• HYPE Short-term Trade Performance: HYPE completed one short-term long trade (1x leverage) last week, successfully realizing a gain of approximately 18.44%. (See Table 1)
• BTC Strategy Execution (Short-term) Performance: Bitcoin followed the既定 short-term strategy last week, completing one short-term short trade (1x leverage), successfully realizing a gain of approximately 2.01%. (See Table 2)
• BTC Strategy Execution (Medium-term) Performance: Bitcoin followed the既定 medium-term strategy last week, continuing to hold the short position established at around $89,000 (1x leverage). As of last week's close (approx. $72,831), the profit is about 18.17%, with a maximum profit of about 32.58% during the period.
• Core View (Short-term) Validation: Bitcoin continued its weak range-bound consolidation last week. The current price action is in line with expectations.
• BTC Price Outlook and Medium-/Short-term Operation Strategies for This Week.
I. HYPE: Structure Analysis & Short-term Trade Review
1. Continuous Tracking of HYPE Market Dynamics and Investment Opportunities
• Feb 23 Weekly Review: First indicated HYPE might be entering an investment window, noting the price was in a Wave II correction phase, and anticipated the potential initiation of a Wave III main advance thereafter.
• Mar 3 Weekly Review: Determined the low of $25.60 on Feb 24 might be the starting point of Wave III, confirming the trend reversal level.
• Mar 9 Weekly Review: Noted the price had effectively broken through multiple moving average resistance on the daily chart, subsequently entered a retracement and consolidation phase, which is a process of momentum accumulation, expecting a rapid rise after its completion.
2. Overview of HYPE Daily Chart Structure: (Based on price action since Jan 21)
• Wave I (Impulse Wave): From the Jan 21 low of $20.46 to the Feb 3 high of $38.41, lasting 14 days, with a maximum gain of 87.73%.
• Wave II (Corrective Wave): From the Feb 3 high of $38.41 to the Feb 24 low of $25.60, lasting 20 days, with a maximum decline of 33.35%.
• Wave III (Main Advance Wave): From the Feb 24 low of $25.60 to present, and made a new high of $38.85 on Mar 14, successfully breaking the Wave I peak of $38.41, confirming the Wave III行情. As of now, the wave has lasted 20 days, with a maximum gain of 51.76%. The main advancing trend is continuing.
3. HYPE Hourly Sub-structure: (Based on price action since Mar 8)
HYPE_60min K-line Chart
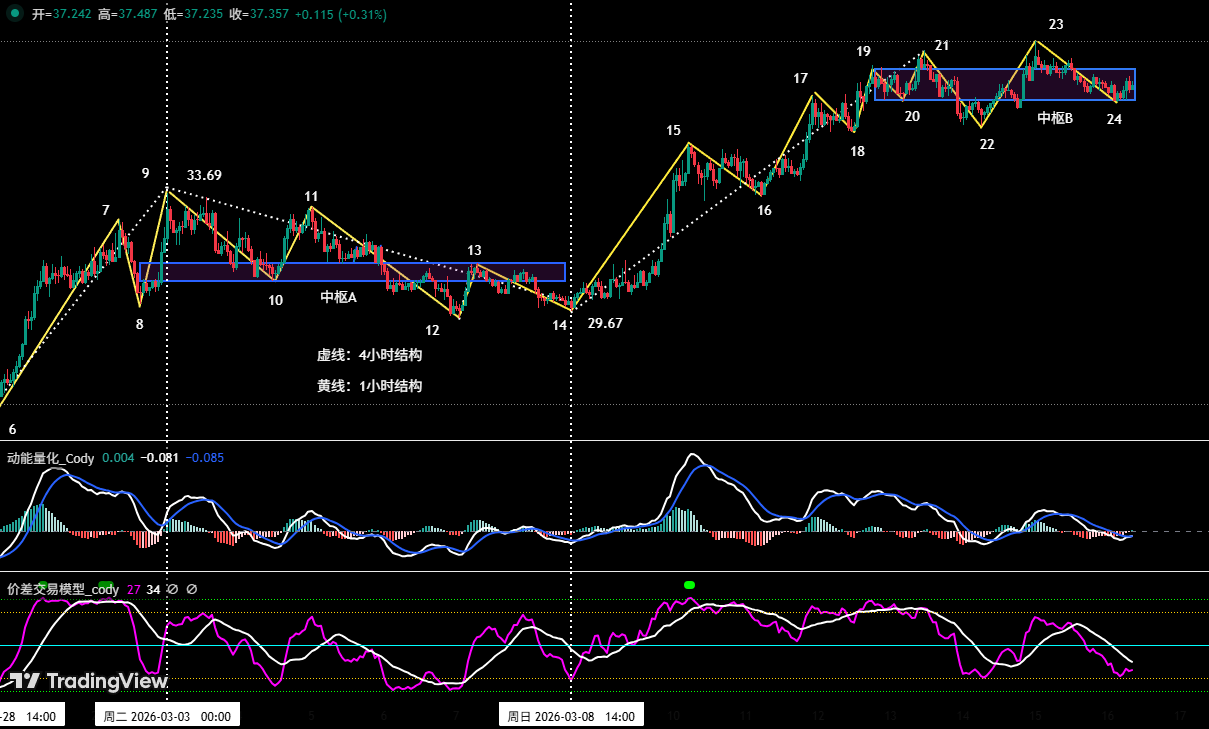
Figure 1
• HYPE Hourly Structure Review (03.02~03.08): In the Mar 9 weekly review, we considered the hourly adjustment starting Mar 2 could be divided into 5 segments: 9-10, 10-11, 11-12, 12-13, 13-14. Analysis showed a clear bottom divergence signal comparing the entry segment (9-10) and the exit segment (13-14). Therefore, we judged the high probability that the adjustment ended at endpoint 14 (approx. $29.67).
• The rise initiated from the Mar 8 low (endpoint 14) can internally be divided into a 10-segment structure from endpoint 14 to 24. These 10 segments (i.e., 14-15, 15-16, 16-17, 17-18, 18-19, 19-20, 20-21, 21-22, 22-23, 23-24) constitute an upward impulse wave. As of the time of analysis, this rising structure is still continuing.
• Central Pivot Construction: Within the latest 10-segment structure, segments 19-20, 20-21, 21-22, 22-23, 23-24 are constructing an ascending central pivot structure.
4. This Week's Core View: The current price action is within the Wave III trend. After the central pivot construction is complete, the key for subsequent movement is to observe whether the price can effectively break free from the gravitational pull of this pivot. High probability of range-bound consolidation this week.
5. HYPE Short-term Trade Review (1x Leverage): (03.09~03.15)
Last week, based on trading signals from our self-built spread trading model and momentum量化 model, combined with the anticipation of the Wave III main advance, we completed one short-term (long) operation, successfully profiting 18.44%.
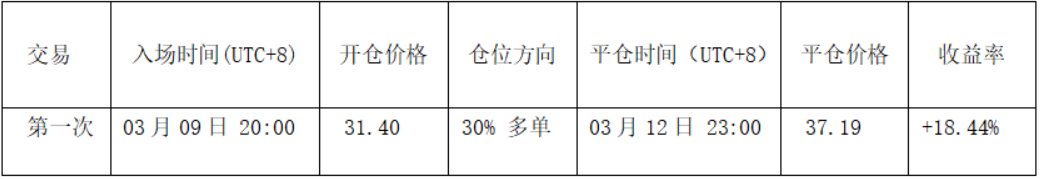
Table 1
• Entry Decision (See Fig. 2): This entry decision integrated triple validation from trend, structure, and量化 signals: First, judged the hourly adjustment structure had ended at endpoint 14 (~$29.67). Then, the price effectively broke above the suppression of the previous platform's upper rail (~$31.33). Simultaneously, based on bottom resonance signals from the spread量化 model and momentum量化 model, we opened a 30% long position at $31.40.
• Exit Decision: Based on top resonance signals from the spread量化 model and momentum量化 model, and the price approaching the Wave I peak near $38.41, we closed the position near $37.19.
• Trade Summary: This operation successfully captured the Wave III rise opportunity, profiting approximately 18.44%.
HYPE_60min K-line Chart
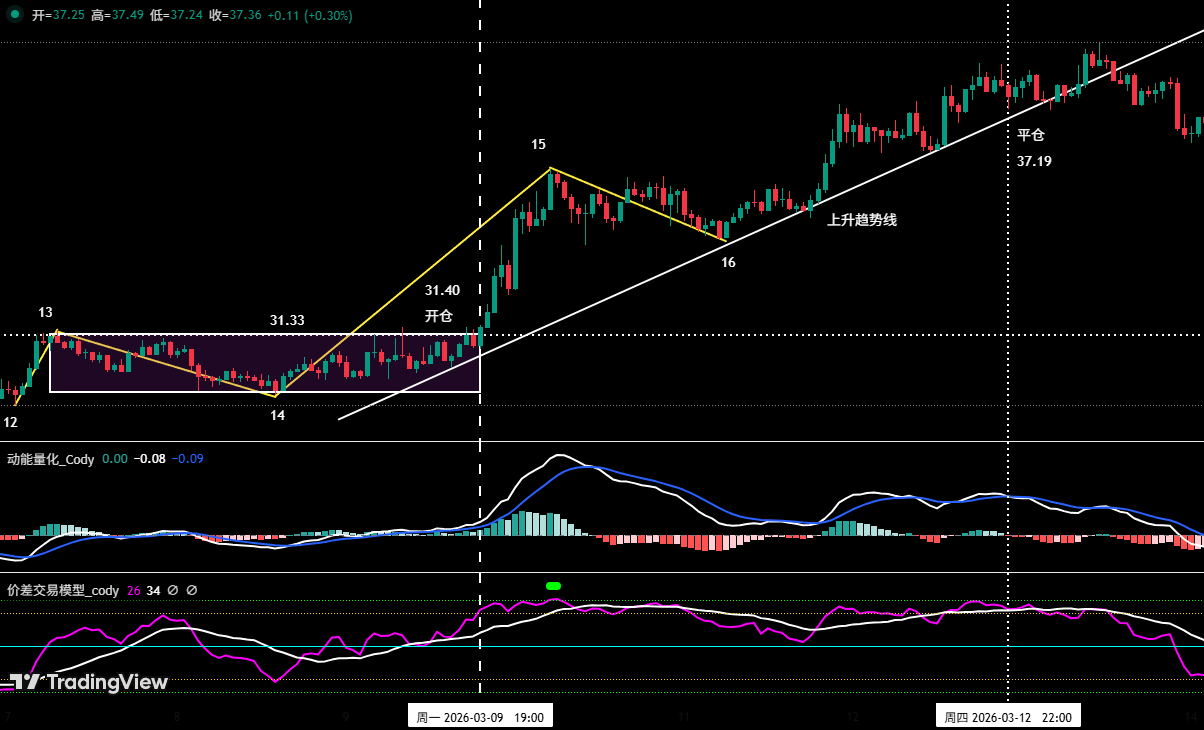
Figure 2 (Short-term Trade Illustration)
II. Bitcoin: Structure Analysis & Long/Short-term Trade Review
1. Short-term Strategy Review: (See Table 2)
Strictly following trading signals from our self-built spread trading model and momentum量化 model, combined with market outlook, we completed one short-term (short) operation last week, gaining 2.01%.
1. Bitcoin Short-term Trade Details Summary: (Leverage*1x)
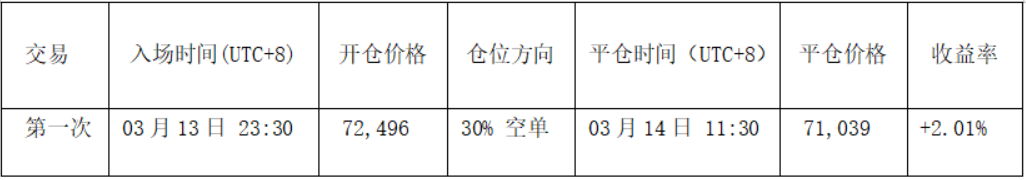
Table 2
2. Short-term Trade Review: (See Fig. 3)
• Entry: The price encountered resistance near $74,500 on the bounce. Simultaneously, the spread trading model triggered a strong top warning signal (green dot in chart), and both models showed shorting resonance signals, so we established a short-term 30% short position at $72,496.
• Exit: Fell to near $70,500, and the spread trading model triggered a bottom warning signal (red dot in chart), so we closed the entire position near $71,039.
Bitcoin 30min K-line Chart: (Momentum量化 Model + Spread Trading Model)
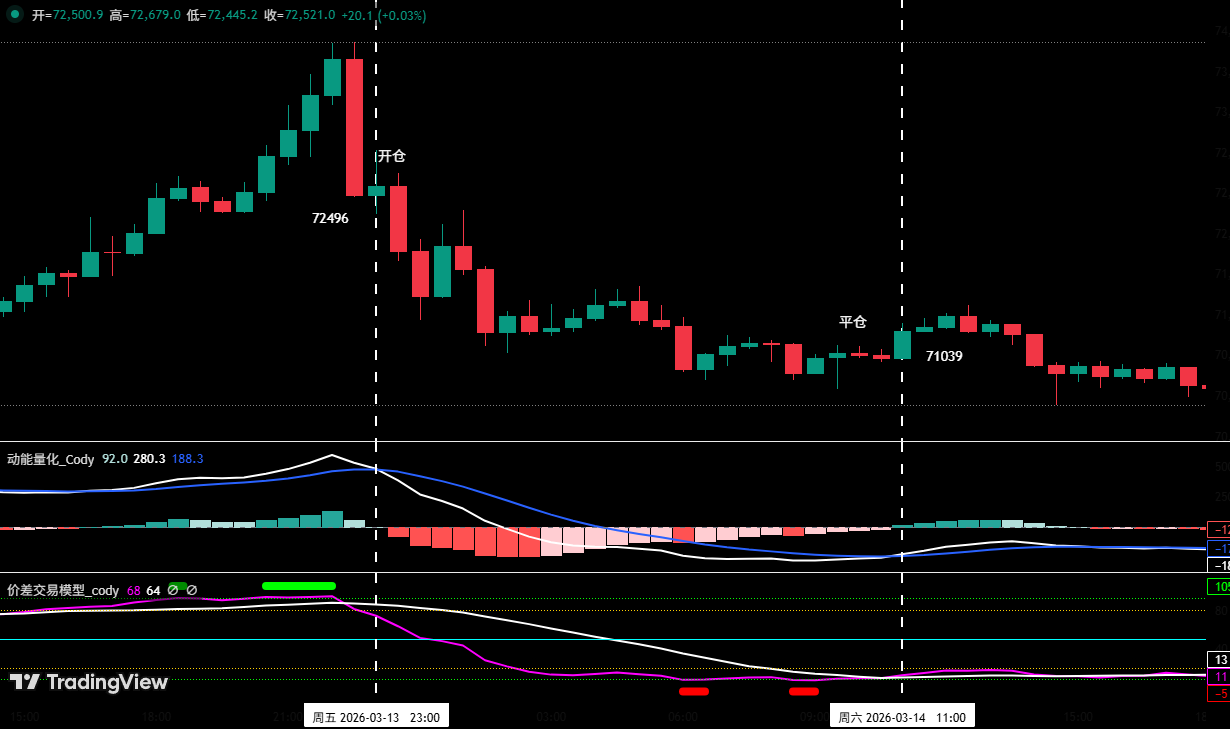
Figure 3 (Short-term Trade Illustration)
2. Medium-term Strategy Review:
Medium-term Strategy: Continue holding the 60% short position established near $89,000 (Jan 28). As of last week's post-market (closing ~$72,831), the profit is approximately 18.17%.
III. Bitcoin: Weekly, Daily Technical Indicator Analysis
Combining market movement, the author conducts a deep analysis of multiple Bitcoin technical indicators from multi-model and multi-dimensional perspectives based on a self-built trading system.
1. Analysis from the Weekly chart level, as shown in (Fig. 4):
Bitcoin Weekly K-line Chart: (Momentum量化 Model + Sentiment量化 Model)
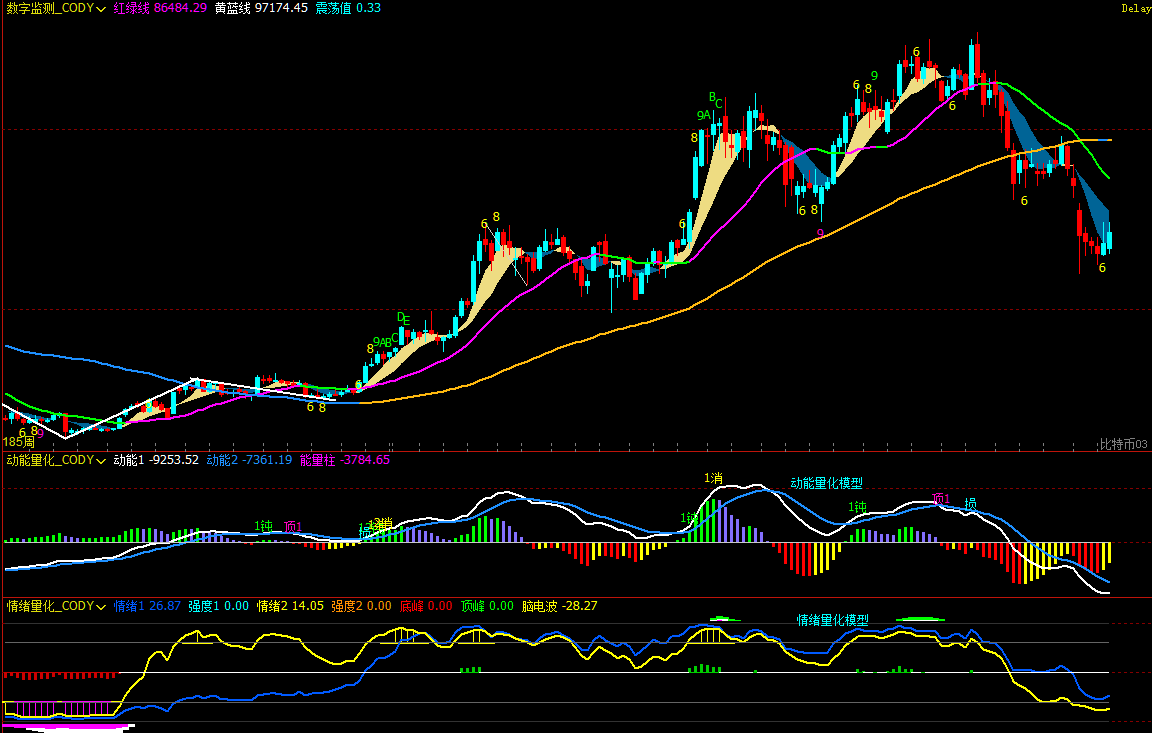
Figure 4
• Momentum量化 Model: Technical indicators show the momentum line declining同步, with the white momentum line showing signs of flattening; negative energy柱 gradually shortening, no divergence signal appeared.
• Sentiment量化 Model: Blue sentiment line value 26, strength zero; Yellow sentiment line value 13, strength zero, peak value is 0.
• Digital Monitoring Model: Moving averages show a bearish排列, last week closed with a large阳线, gain ~10.39%, price stood above the 7-week MA for the first time; bottom digital monitoring signal not present.
Comprehensive Analysis: From the data of the three models above, last week's market rebound was significant, with concentrated release of bullish momentum, multiple technical indicators repaired, oversold conditions eased. However, we believe the weekly chart bearish trend for Bitcoin has not reversed yet. Last week's large阳线 needs further observation to confirm its sustainability.
2. Analysis from the Daily chart level: As shown in (Fig. 5)
Bitcoin Daily K-line Chart: (Momentum量化 Model + Sentiment量化 Model)
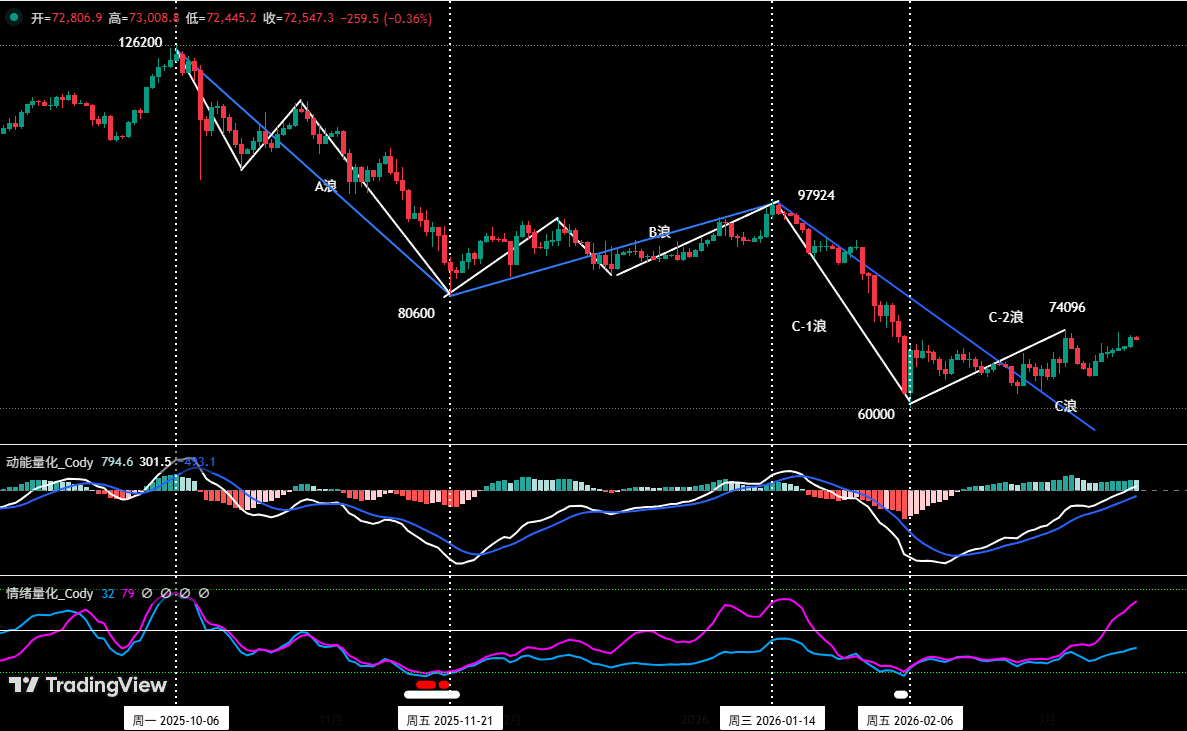
Figure 5
• Momentum量化 Model: Last week's overall showed a "震荡上行" (oscillating rise) pattern. Momentum line rose同步 below the zero axis, with the white momentum line crossing above the zero axis for the first time; positive energy柱 gradually strengthened, but weakly.
• Sentiment量化 Model: At last week's daily close, blue sentiment line value 31, strength zero; purple sentiment line value 75, strength zero, purple line rose significantly.
Comprehensive Analysis: Combining momentum量化 and sentiment量化 model analysis, we believe: Although last week's daily chart closed with 7 consecutive阳K线, showing strong short-term rebound momentum, the daily trading volume did not放大同步, the overall movement still belongs to the category of an oversold rebound, not yet breaking out of the range-bound pattern. The daily bearish trend continues. Subsequent focus should be on the battle between bulls and bears around the key demarcation line (zero axis).
IV. This Week's Market Prediction: (03.16~03.22)
1. Bitcoin Ascending Pivot Construction (Based on post-Feb 6 low price action): (Updated Weekly)
Bitcoin 4-hour K-line Chart
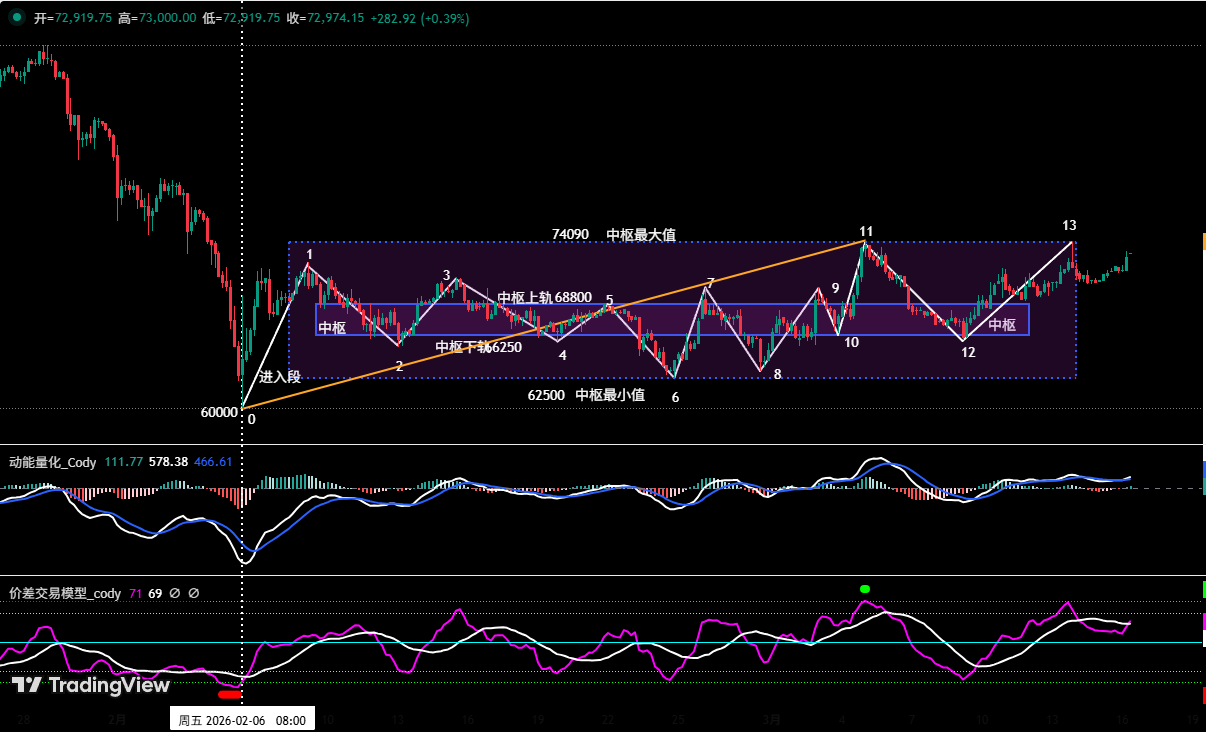
Figure 6
Using Bitcoin 4-hour as the analysis周期:
• Pivot Construction: (Fig. 6) shows: Last week mainly ran segment 12-13 structure. Currently, the ascending pivot is under construction. Its highest resistance level moved up to near $74,090, lowest support near $62,500; pivot upper rail ~$68,800, pivot lower rail ~$66,250.
2. C-2 Wave Rebound End Judgment:
• Maintain the previous core framework: The rising行情 initiated from the Feb 6 low (~$60,000) is, in nature, a C-2 wave oversold rebound within a large-degree C wave correction, to be followed by a C-3 wave corrective行情.
• Basis for C-2 Rebound End: If the price effectively breaks below the pivot lower rail support near $66,250 during adjustment, and subsequent pullback fails to reclaim this level, it constitutes a third-type selling point in Chan theory. This signal indicates strong selling momentum, likely破坏 the rebound structure, significantly increasing the possibility that the C-2 wave rebound has ended.
3. This Week's Core View: Maintain $62,500~$74,500 range-bound consolidation pattern, observe bull-bear struggle near range edges; Special attention: Price action after effectively breaking below the pivot lower rail (~$66,250). Strategically, firmly execute the principle of "reduce positions (longs) on rallies, control risk".
4. Core Resistance Levels:
• First Resistance Zone: Near $74,500 (Near previous important low)
• Second Resistance Zone: $79,500~$80,600 area (Near Nov 2025 low)
5. Core Support Levels:
• First Support: Near $65,000 (Previous important support area)
• Second Support: $60,000~$62,500 area (Feb 6 low area)
• Third Support: Near $57,400
V. This Week's Operation Strategy (Excluding Sudden News Impact): (03.16~03.22)
1. Medium-term Strategy: (See Fig. 7)
Bitcoin Daily K-line Chart: (Position Monitoring Model)
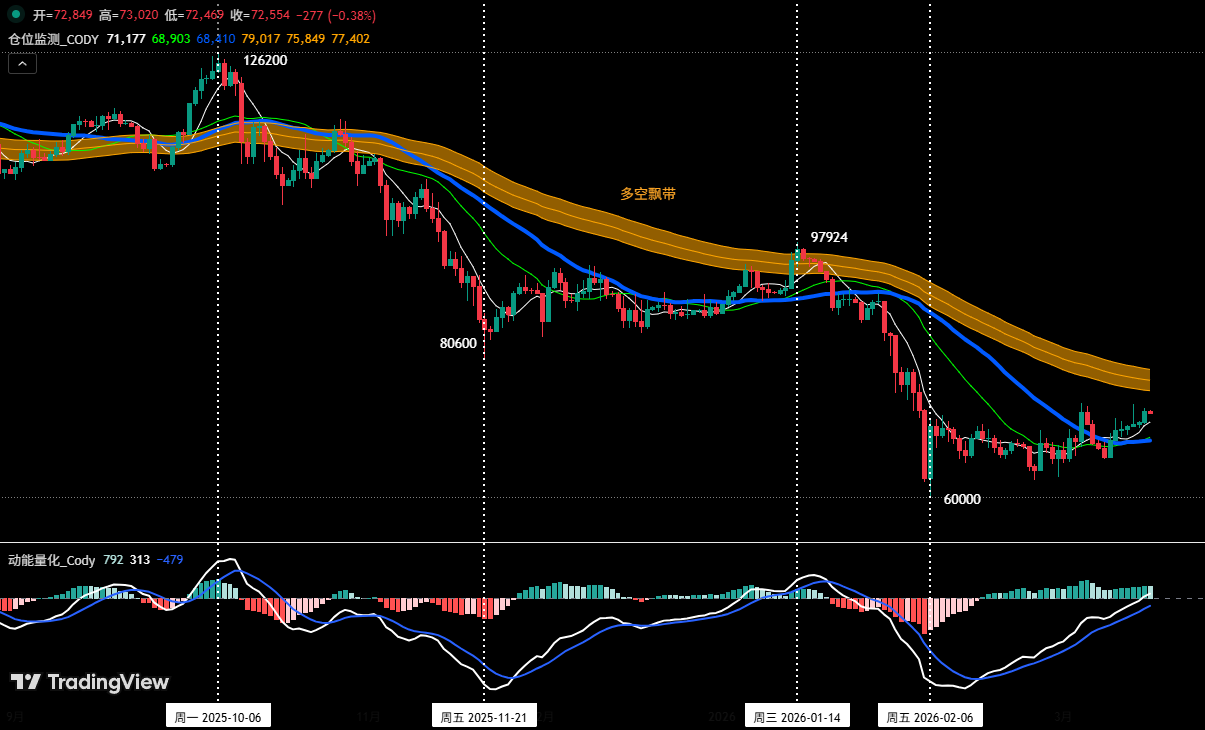
Figure 7
Position Monitoring Model: Currently price is below the Bull-Bear Ribbon (yellow), so continue holding the 60% short position established at $89,000 (Jan 28).
• If price反弹 effectively breaks above $74,500, reduce medium-term position to 40%.
• If price反弹 effectively breaks above and stabilizes above the Bull-Bear Ribbon, clear all medium-term positions.
2. Short-term Strategy: Utilize 30% position, set stop-loss, look for "spread" opportunities based on support and resistance levels. (Use 30min/60min as operation周期).
3. As the medium-term market direction is bearish, to dynamically respond to complex market changes and signals from our self-built trading model, we propose two short-term operation plans A/B:
• Plan A: Sell on rallies encountering resistance.
• Entry: When price持续反弹至 near $74,500 triggers resistance signals combined with model top signals, establish a 30% short position.
• Risk Control: Initial short stop-loss set above $76,000.
• Exit: When falling to important support levels combined with model signals, gradually close position to take profit.
• Plan B: Follow-through breakout short.
• Entry: When price effectively breaks below the pivot lower rail $66,250, then pulls back to this level but fails to hold, combined with model top signals,顺势 establish a 30% short position.
• Risk Control: Initial short stop-loss set above $67,500.
• Exit: When falling to support levels combined with model signals, gradually close position to take profit.
VI. Special Notes:
1. At entry: Immediately set initial stop-loss.
2. When profit reaches 1%: Move stop-loss to entry cost (breakeven point), ensuring principal safety.
3. When profit reaches 2%: Move stop-loss to the 1% profit level.
4. Continuous Tracking: Thereafter, for every additional 1% profit, move stop-loss同步 by 1%, dynamically protecting and locking in profits.
Financial markets change rapidly. All market analysis and trading strategies require dynamic adjustment. All views, analytical models, and operation strategies involved in this article are derived from personal technical analysis, intended solely for personal trading log purposes, and do not constitute any investment advice or operational basis. The market involves risks, investment requires caution. Do not make decisions based on this.


