Bitcoin Shows 'Bull Market Characteristics', Chart Pattern Points to $90,000

marsbitPublished on 2026-04-15Last updated on 2026-04-15

Abstract

Bitcoin surged over 5% to break above $76,000, reaching a 70-day high and showing renewed bullish momentum. The breakout from an ascending triangle pattern suggests a potential upward target of $89,050. Technical indicators, including the RSI rising from oversold levels, support the strengthening bullish trend. On-chain data further confirms the positive sentiment, with daily transaction counts increasing by 62% in 2026 to 765,130—the highest level since November 2024 when Bitcoin traded above $120,000. Transaction fees also rose, reflecting increased network demand and user willingness to pay for priority. Analysts highlight that closing above key resistance levels, including the 100-day moving average, could confirm a trend reversal and sustained upward momentum toward $90,000. The combination of technical breakouts and robust on-chain activity signals a potential continuation of the bull run.

Author: Nancy Lubale

Compiled by: Deep Tide TechFlow

Deep Tide Guide: Bitcoin surged 5% on Tuesday, breaking through $76,000 to hit a 70-day high. Technically, BTC broke through the upper rail of the ascending triangle, with a quantitative target pointing to $89,050. On-chain data is strengthening simultaneously: daily transaction count surged 62%, reaching the highest level since November 2024—back when Bitcoin was at $120,000. Signs of a divergence repair between network activity and price are emerging, with multiple analysts believing a trend reversal is being confirmed.

Market analysts say that after Bitcoin (BTC) rose 5% on Tuesday to break through $76,000, it is showing "re-established bullish momentum," with bulls targeting $90,000, and on-chain network activity is also improving simultaneously.

Bitcoin Price Hits 70-Day High

TradingView data shows that BTC/USD rose over 5% on Tuesday, hitting an intraday high of $76,120, a level last seen on February 6th.

This rally has pushed Bitcoin back above several key support lines, including the convergence area of the 100-day Exponential Moving Average (EMA) and Simple Moving Average (SMA) near $75,000.

@CryptoBlockto tweeted: Bitcoin breaks $76,000, surpassing the March high, re-establishing bullish momentum. The next key resistance is at $76,000; a decisive break above would confirm a trend reversal and sustained upward momentum.

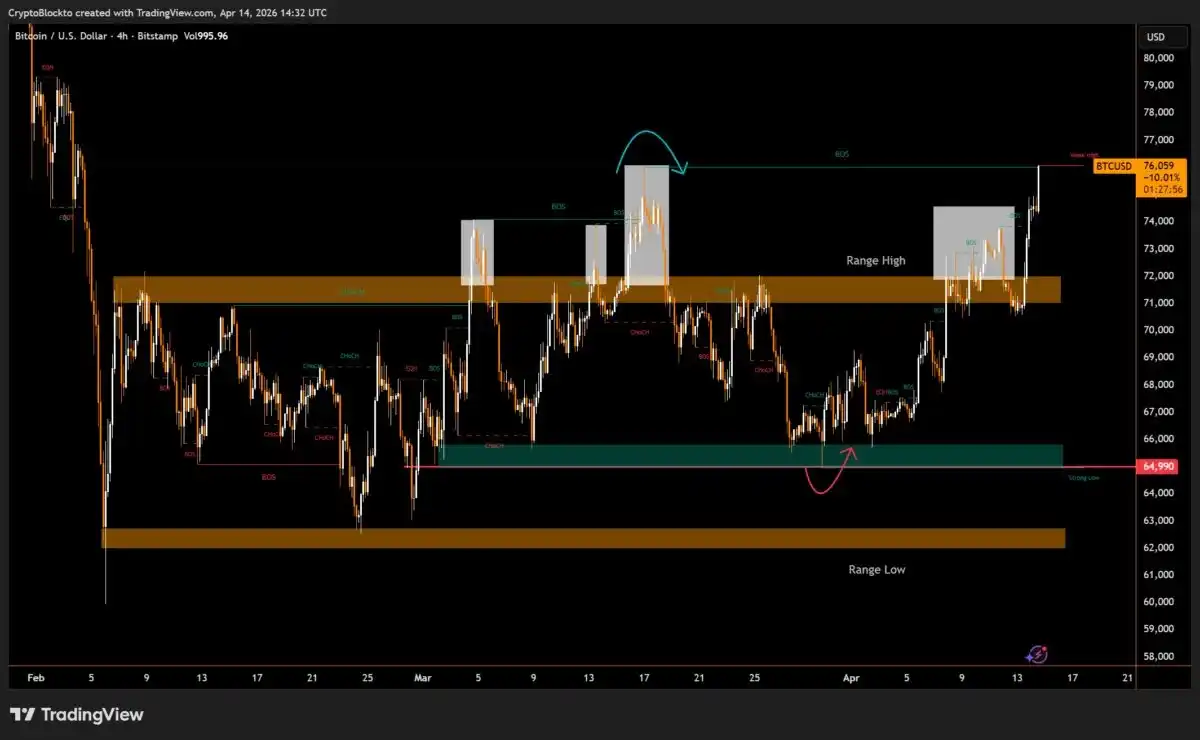
Caption: BTC/USD 4-hour chart, Source X/CryptoBlockto

From a technical pattern perspective, Bitcoin is validating a breakout of an ascending triangle—the price broke above the upper rail at $73,000 on Monday.

A daily close firmly above the moving average area at $75,000 would confirm the breakout's validity, with the next resistance being the psychological barrier of $80,000.

Beyond that, bulls could push the price towards the quantitative target of the ascending triangle at $89,050, representing a potential gain of approximately 18% from the current price.

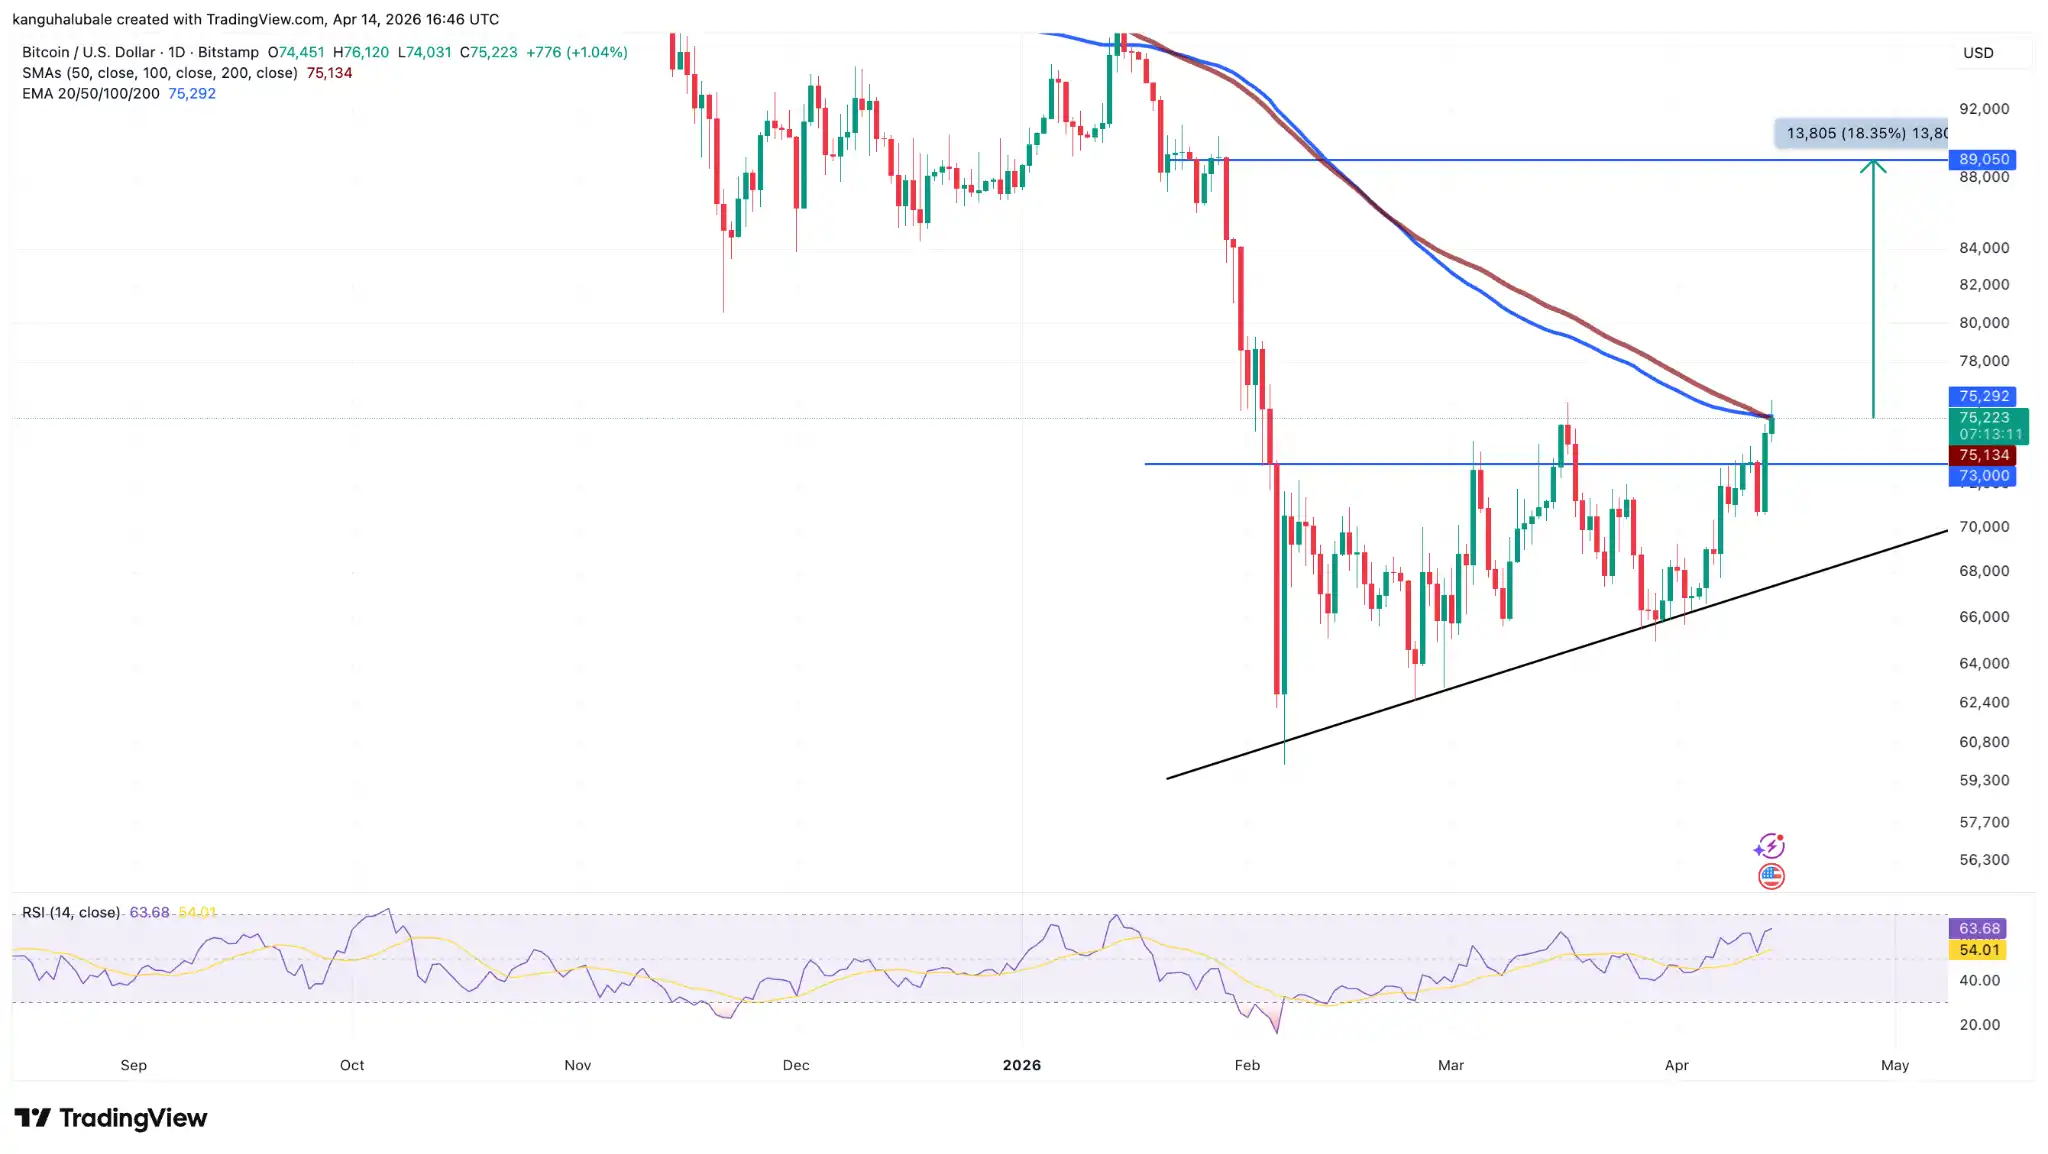
Caption: BTC/USD daily chart, Source Cointelegraph/TradingView

The daily RSI (Relative Strength Index) has rebounded from the oversold level of 15 on February 6th to 63, indicating continuously strengthening bullish momentum.

@ImCryptOpus tweeted: Bitcoin is trading within the horizontal supply zone of the ascending triangle, with the 100-day MA also acting as resistance above the current price. A strong breakout above the pattern's upper rail and the 100-day MA would confirm the market's entry into a bullish trend.

As previously reported by Cointelegraph, a daily close above $76,000 would complete the bullish ascending triangle, opening the door for a push towards $84,000.

Bitcoin Transaction Activity Rises to 17-Month High

While the price strengthens, on-chain data is also cooperating. The daily number of Bitcoin transactions has grown 62% in 2026, reaching 765,130 on April 5th.

The last time this level was reached was in November 2024, when the US election frenzy pushed Bitcoin above $100,000 for the first time.

@CW8900 tweeted: BTC's daily transaction count is higher than when BTC was at $120,000. The network is showing bull market characteristics.

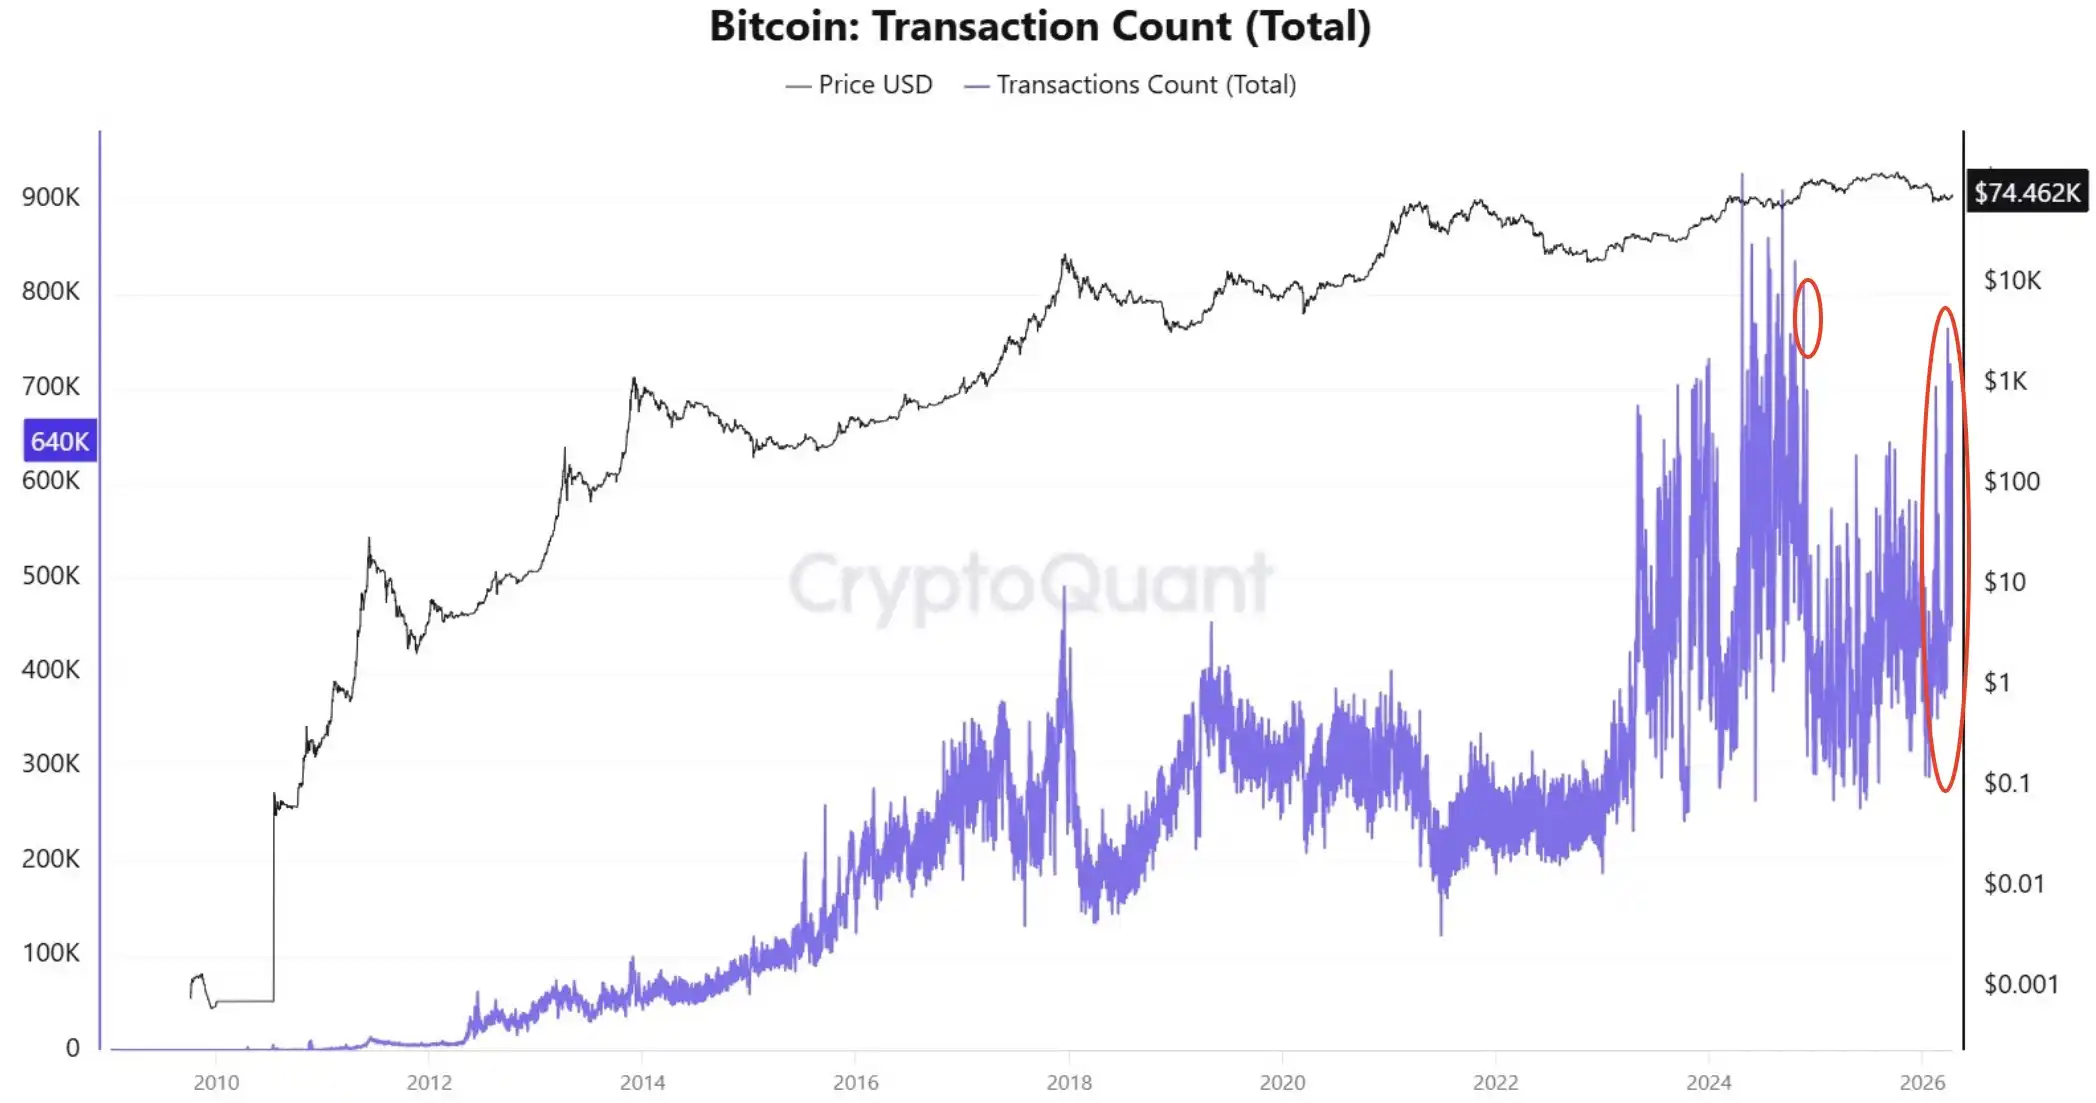
Caption: Bitcoin Daily Transaction Count, Source CryptoQuant

Bitcoin's total fee revenue is also rising, increasing 4% over the past week to $153,700. Glassnode stated in its latest Market Pulse report that this reflects increased on-chain demand:

"The rise in fees indicates a recovery in network activity, and users' willingness to pay for transaction priority is increasing."

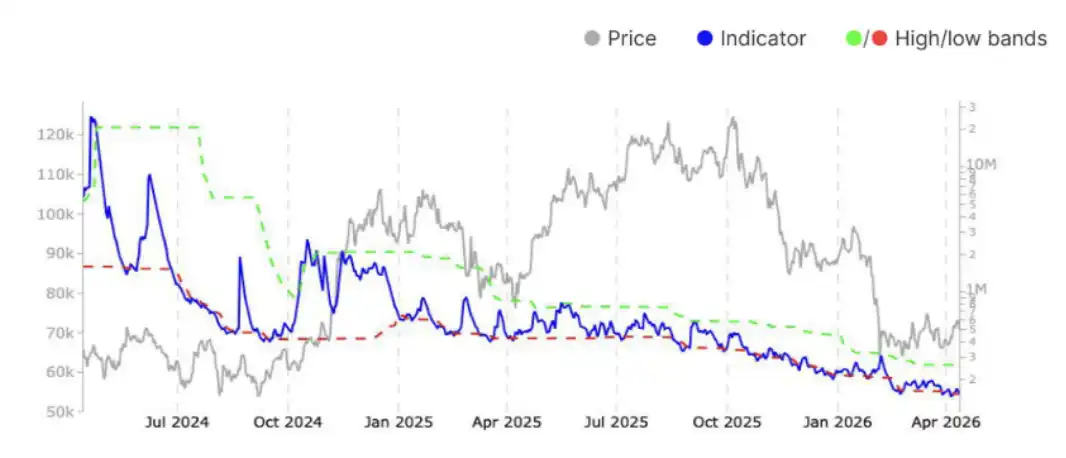
Caption: Bitcoin Total Transaction Fees, Source Glassnode

The simultaneous growth in transaction count and fees indicates that more users are interacting with the network. Increased on-chain activity is often linked to market interest and participant confidence—this is particularly noteworthy when the price is at a relatively low level.

Related Questions

QWhat key technical pattern did Bitcoin break through, and what is its price target according to the article?

ABitcoin broke through the upper trendline of an ascending triangle pattern, with a quantified target pointing to $89,050.

QWhat significant price level did Bitcoin surpass, and why is it important for confirming a trend reversal?

ABitcoin surpassed the $76,000 level. A daily close above this level would confirm the trend reversal and open the path towards $84,000.

QHow much did the number of daily Bitcoin transactions increase in 2026, and what historical period does this activity level recall?

AThe number of daily Bitcoin transactions increased by 62% in 2026, reaching a level last seen in November 2024 when Bitcoin was above $120,000.

QWhat on-chain metric, besides transaction count, also showed an increase, and what does it signify according to Glassnode?

AThe total transaction fee revenue also increased. According to Glassnode, this signifies a recovery in network activity and shows users' increased willingness to pay for transaction priority.

QWhat was the RSI reading on February 6th, and what is its value in the current analysis, indicating a change in momentum?

AOn February 6th, the RSI was in the oversold region at 15. It has since recovered to 63, indicating a strengthening of bullish momentum.

Related Reads

Trading

Spot
Futures

Hot Articles

What is $BITCOIN

DIGITAL GOLD ($BITCOIN): A Comprehensive Analysis Introduction to DIGITAL GOLD ($BITCOIN) DIGITAL GOLD ($BITCOIN) is a blockchain-based project operating on the Solana network, which aims to combine the characteristics of traditional precious metals with the innovation of decentralized technologies. While it shares a name with Bitcoin, often referred to as “digital gold” due to its perception as a store of value, DIGITAL GOLD is a separate token designed to create a unique ecosystem within the Web3 landscape. Its goal is to position itself as a viable alternative digital asset, although specifics regarding its applications and functionalities are still developing. What is DIGITAL GOLD ($BITCOIN)? DIGITAL GOLD ($BITCOIN) is a cryptocurrency token explicitly designed for use on the Solana blockchain. In contrast to Bitcoin, which provides a widely recognized value storage role, this token appears to focus on broader applications and characteristics. Notable aspects include: Blockchain Infrastructure: The token is built on the Solana blockchain, known for its capacity to handle high-speed and low-cost transactions. Supply Dynamics: DIGITAL GOLD has a maximum supply capped at 100 quadrillion tokens (100P $BITCOIN), although details regarding its circulating supply are currently undisclosed. Utility: While precise functionalities are not explicitly outlined, there are indications that the token could be utilized for various applications, potentially involving decentralized applications (dApps) or asset tokenization strategies. Who is the Creator of DIGITAL GOLD ($BITCOIN)? At present, the identity of the creators and development team behind DIGITAL GOLD ($BITCOIN) remains unknown. This situation is typical among many innovative projects within the blockchain space, particularly those aligning with decentralized finance and meme coin phenomena. While such anonymity may foster a community-driven culture, it intensifies concerns about governance and accountability. Who are the Investors of DIGITAL GOLD ($BITCOIN)? The available information indicates that DIGITAL GOLD ($BITCOIN) does not have any known institutional backers or prominent venture capital investments. The project seems to operate on a peer-to-peer model focused on community support and adoption rather than traditional funding routes. Its activity and liquidity are primarily situated on decentralized exchanges (DEXs), such as PumpSwap, rather than established centralized trading platforms, further highlighting its grassroots approach. How DIGITAL GOLD ($BITCOIN) Works The operational mechanics of DIGITAL GOLD ($BITCOIN) can be elaborated on based on its blockchain design and network attributes: Consensus Mechanism: By leveraging Solana’s unique proof-of-history (PoH) combined with a proof-of-stake (PoS) model, the project ensures efficient transaction validation contributing to the network's high performance. Tokenomics: While specific deflationary mechanisms have not been extensively detailed, the vast maximum token supply implies that it may cater to microtransactions or niche use cases that are still to be defined. Interoperability: There exists the potential for integration with Solana’s broader ecosystem, including various decentralized finance (DeFi) platforms. However, the details regarding specific integrations remain unspecified. Timeline of Key Events Here is a timeline that highlights significant milestones concerning DIGITAL GOLD ($BITCOIN): 2023: The initial deployment of the token occurs on the Solana blockchain, marked by its contract address. 2024: DIGITAL GOLD gains visibility as it becomes available for trading on decentralized exchanges like PumpSwap, allowing users to trade it against SOL. 2025: The project witnesses sporadic trading activity and potential interest in community-led engagements, although no noteworthy partnerships or technical advancements have been documented as of yet. Critical Analysis Strengths Scalability: The underlying Solana infrastructure supports high transaction volumes, which could enhance the utility of $BITCOIN in various transaction scenarios. Accessibility: The potential low trading price per token could attract retail investors, facilitating wider participation due to fractional ownership opportunities. Risks Lack of Transparency: The absence of publicly known backers, developers, or an audit process may yield skepticism regarding the project's sustainability and trustworthiness. Market Volatility: The trading activity is heavily reliant on speculative behavior, which can result in significant price volatility and uncertainty for investors. Conclusion DIGITAL GOLD ($BITCOIN) emerges as an intriguing yet ambiguous project within the rapidly evolving Solana ecosystem. While it attempts to leverage the “digital gold” narrative, its departure from Bitcoin's established role as a store of value underscores the need for a clearer differentiation of its intended utility and governance structure. Future acceptance and adoption will likely depend on addressing the current opacity and defining its operational and economic strategies more explicitly. Note: This report encompasses synthesised information available as of October 2023, and developments may have transpired beyond the research period.

363 Total ViewsPublished 2025.05.13Updated 2025.05.13

What is $BITCOIN

Discussions

Welcome to the HTX Community. Here, you can stay informed about the latest platform developments and gain access to professional market insights. Users' opinions on the price of BTC (BTC) are presented below.

活动图片