Bitcoin sheds $716B since ATH – Here’s what’s weighing on BTC

ambcryptoPublished on 2025-12-22Last updated on 2025-12-22

Abstract

Bitcoin's market cap has declined by $716 billion from its all-time high of $2.486 trillion, now standing at $1.77 trillion. The 28.8% drawdown is largely attributed to weakening capital inflows, with realized capitalization stalling for the first time in 2.5 years. Despite over $700 billion exiting the market, spot buyer activity has outweighed selling pressure, suggesting continued accumulation by retail investors. Additionally, Bitcoin’s price has been range-bound between $85,000 and $90,000 due to options-driven gamma effects, creating mechanical support and resistance. With $23 billion in options expiring on December 26th, a return to sentiment-driven price discovery may follow, potentially allowing a rebound if bullish trends persist.

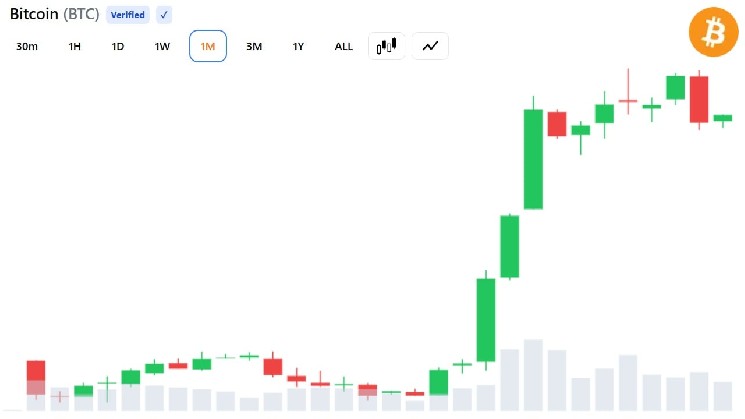
Bitcoin has been navigating one of its most challenging phases yet. Since its market capitalization peaked at an all-time high of $2.486 trillion, the asset has shed approximately $716 billion.

Bitcoin’s market capitalization stood at $1.77 trillion as of press time, according to CoinMarketCap.

A drawdown of 28.8% at this scale does not occur in isolation.

With Bitcoin [BTC] trading around $88,900 at the time of writing, multiple factors have contributed to the decline. AMBCrypto examined the forces weighing on Bitcoin’s performance and what could shape its next move.

Capital inflow weakens after 2.5 years

Bitcoin’s recent price weakness has been driven largely by capital exiting the market. While this may appear straightforward, on-chain data highlighted a more nuanced shift.

For the first time in over two years and six months, capital inflows have begun to weaken, as realized capitalization has stalled during this period.

In context, Realized Capitalization has remained flat for nearly a month, reflecting a pause in fresh capital entering the market as investors gradually pull out.

Ki Young Ju, Founder of CryptoQuant, noted that periods like this often require time to stabilize, as recovery depends on the return of new capital.

“Sentiment recovery might take a few months,” he said.

With more than $700 billion having exited the market and limited inflows replacing it, Bitcoin’s overall price structure remains fragile. Under normal conditions, this setup would increase the likelihood of price stagnation or further downside.

Does this spell doom?

Despite the liquidity slowdown sending a bearish signal, price action has not broken down sharply.

Spot market data over the past three months showed that buyer activity outweighed selling pressure. The Bitcoin Spot Taker Buy–Sell Cumulative Volume Delta indicated that investors remain in an accumulation phase, suggesting that retail participants are still active in the market.

This behavior offers a possible explanation for Bitcoin’s ability to hold its range despite weakening capital inflows.

The Spot market reinforces this trend.

Since December, investors have continued to accumulate Bitcoin. Between the week ending the 1st of December and the week ending the 15th, total Spot purchases reached approximately $3.12 billion.

When selling pressure is absorbed despite dominant bearish sentiment, it limits the extent to which prices decline.

Bitcoin remains structurally constrained

Market analyst David attributed Bitcoin’s price behavior largely to options traders hedging their positions rather than shifts in sentiment.

The analysis showed that call and put options clustered around $90,000 and $85,000 have effectively trapped Bitcoin within a narrow trading range. These positions create a positive gamma environment that mechanically restricts price movement.

In practical terms, whenever Bitcoin approaches the $90,000 level, market makers face a sell wall of roughly $40.7 million.

Conversely, when the price drops toward the $85,000 region, buy orders totaling about $80 million emerge. This dynamic creates a gamma effect that keeps the price oscillating within defined boundaries.

This confirmed that Bitcoin’s recent range-bound movement is driven by market structure rather than investor sentiment.

An estimated $278 million—representing 54% of total market gamma—is set to expire on the 26th of December ,aligning with the expiration of $23 billion in options contracts.

Once this gamma expires, Bitcoin is likely to return to sentiment-driven pricing. If bullish pressure remains dominant, as reflected in Spot volume trends, the conditions could support a potential rebound as true price discovery resumes.


Trending Cryptos

Related Questions

QHow much has Bitcoin's market capitalization dropped since its all-time high, and what is its current value?

ABitcoin's market capitalization has dropped approximately $716 billion since its all-time high of $2.486 trillion. Its current market cap stands at $1.77 trillion.

QWhat key on-chain metric indicates a weakening of capital inflows into the Bitcoin market?

AThe Realized Capitalization metric has stalled and remained flat for nearly a month, indicating a pause in fresh capital entering the market and a slowdown in capital inflows for the first time in over two and a half years.

QDespite the bearish capital flow signals, what market data suggests investors are still accumulating Bitcoin?

AThe Bitcoin Spot Taker Buy-Sell Cumulative Volume Delta indicates that buyer activity has outweighed selling pressure over the past three months, showing that investors remain in an accumulation phase with spot purchases reaching approximately $3.12 billion in a recent two-week period.

QWhat is the primary mechanism, according to market analyst David, that is currently trapping Bitcoin's price in a narrow trading range?

AOptions traders hedging their positions have created a positive gamma environment, with call and put options clustered around $90,000 and $85,000. This creates mechanical price boundaries where market makers face a $40.7 million sell wall near $90,000 and an $80 million buy support near $85,000.

QWhen is Bitcoin expected to return to sentiment-driven pricing, and what could potentially support a rebound?

ABitcoin is expected to return to sentiment-driven pricing after December 26th, when an estimated $278 million in market gamma (54% of the total) expires along with $23 billion in options contracts. If bullish pressure remains dominant as shown in spot volume trends, this could support a potential rebound as true price discovery resumes.

Related Reads

8,000 BTC Fails to Support Stock Price; Can a Reverse Stock Split Save American Bitcoin?

American Bitcoin, a company closely linked to Eric Trump, faces a paradox: despite significantly increasing its Bitcoin holdings to 8,000 BTC, its stock price continues to decline. The company recently executed a 1-for-15 reverse stock split, effective July 2, aimed at raising its per-share price to meet Nasdaq listing requirements. While this action does not change the company's overall valuation, it carries risks, including potential negative market perception and reduced liquidity. The company's strategy involves using its profitable mining operations, with a cost below market price, to accumulate Bitcoin, unlike competitors who primarily issue new shares to fund purchases. However, its Q1 2026 financials revealed a net loss and significant digital asset impairment losses, highlighting that mere Bitcoin accumulation does not guarantee stock performance. The core challenge is whether the stock offers value beyond direct Bitcoin ownership. Bullish arguments focus on the growing BTC reserves and the sustainable mining model. Bearish concerns center on weak liquidity, the threat of future share dilution from potential fundraising, and the market's reluctance to award a premium simply for holding Bitcoin. The reverse split, necessary to maintain its listing, underscores underlying business weakness. The company's future hinges on stabilizing its stock liquidity, transparently managing its BTC treasury, and proving its model can grow reserves without excessively diluting shareholders. Its performance serves as a critical test for the publicly traded Bitcoin treasury sector.

marsbit42m ago

8,000 BTC Fails to Support Stock Price; Can a Reverse Stock Split Save American Bitcoin?

marsbit42m ago

Bitcoin Volatility Unchanged Amid Dominant Downtrend; HYPE Faces Repeated Tests at Critical Trendline | Guest Analysis

This weekly market analysis updates the outlook for Bitcoin (BTC) and HYPE based on recent price action, largely confirming prior predictions. **Bitcoin (BTC) Analysis:** The report maintains that BTC is in a downtrend but currently within a corrective rebound phase that began from the July 1st low of $57,820. This rebound has reached a key resistance near $64,700. The daily chart shows a developing "descending central zone," suggesting a shift into a consolidation/range-bound phase. The 4-hour chart indicates the rebound may be completing, with proprietary models showing potential short-term topping signals near the current levels. **BTC Trading Strategy (July 13-19):** * **Key Levels:** Resistance is at $64,700, $65,700-$67,300, and $69,500-$71,000. Support lies at $60,950-$62,000, $57,820, and $55,000. * **Mid-term:** The overall structure is bearish. Hold ~20% short positions. Consider increasing shorts to 50% if price rallies to the $65,700-$67,300 zone and shows weakness. * **Short-term:** Use 30% capital for tactical trades. Three scenarios are outlined: 1. **A (Buying Dip):** Consider buying if price drops to $60,950-$62,000 support and shows signs of stabilization. 2. **B (Selling Rally):** Consider shorting if price rallies to the $65,700-$67,300 resistance zone with confirming signals. 3. **C (Buying Higher Low):** Consider buying if, after a breakout above $65,700, a pullback finds support above $57,820. **HYPE Analysis:** HYPE performed as anticipated last week, facing resistance and correcting from the warned level near $72.97 ("Endpoint 61"), with a maximum drop of 9.39%. The current (61-62) correction leg on the 4-hour chart has broken below a previous low ($68.16), damaging the prior upward structure. **HYPE Trading Strategy:** * **Key Levels:** Resistance is at $68-$69.5, $72.97, and $76.94. Support is at $65.5 and $60.5-$61.5. * **Outlook:** The focus is on where the current correction ends and whether any subsequent rebound can surpass the $72.97 resistance. * **Strategy:** Stay观望 if a rebound breaks above $72.97 (near the all-time high). However, if a rebound fails to reach $72.97, consider establishing short positions (up to 30%仓位) with strict stop-losses. **General Risk Management:** The article emphasizes strict trade execution: set initial stop-loss immediately, move stop-loss to breakeven at +1% profit, and then trail it upwards by 1% for every additional 1% gain to lock in profits dynamically. *Disclaimer: The analysis is based on personal technical models for journaling purposes and is not investment advice. Markets are volatile; trade cautiously.*

Odaily星球日报52m ago

Bitcoin Volatility Unchanged Amid Dominant Downtrend; HYPE Faces Repeated Tests at Critical Trendline | Guest Analysis

Odaily星球日报52m ago

Trading

Spot

Hot Articles

Discussions

Welcome to the HTX Community. Here, you can stay informed about the latest platform developments and gain access to professional market insights. Users' opinions on the price of S (S) are presented below.

活动图片