Bitcoin [BTC] has traded within an ascending channel since it rebounded from $65k a week ago. This is the longest bullish streak printed since early January, indicating improved market sentiment.
In fact, as of this writing, Bitcoin traded at $73,862, up 2.83% on the daily charts. With this sustained upside movement, the king coin has shown a potential trend reversal, based on its comparative performance relative to equities.
Bitcoin starts to outperform equities again
After a long period of underperformance relative to other markets, Bitcoin has again shown strong performance compared to equities. CryptosRus reported that BTC started to outperform equities on a risk-adjusted basis over the past seven days.
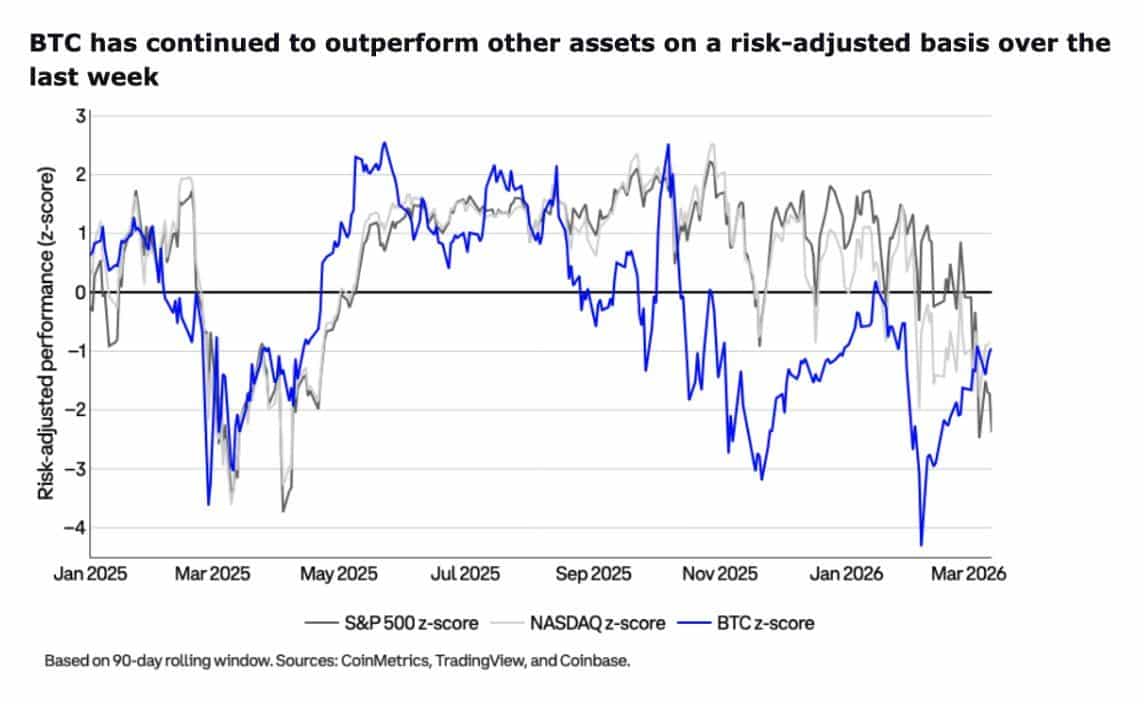

After months of navigating geopolitical tensions and macroeconomic pressures, BTC showed relative strength against the S&P 500 and Nasdaq. Citing the Coinbase report, CryptosRus posited that the market had moved past peak pessimism.
In fact, Comparative Rolling Performance data from Checkonchain showed that Bitcoin outperformed equities. Over the past week, BTC has shown recovery, rising from -26% to -15%.

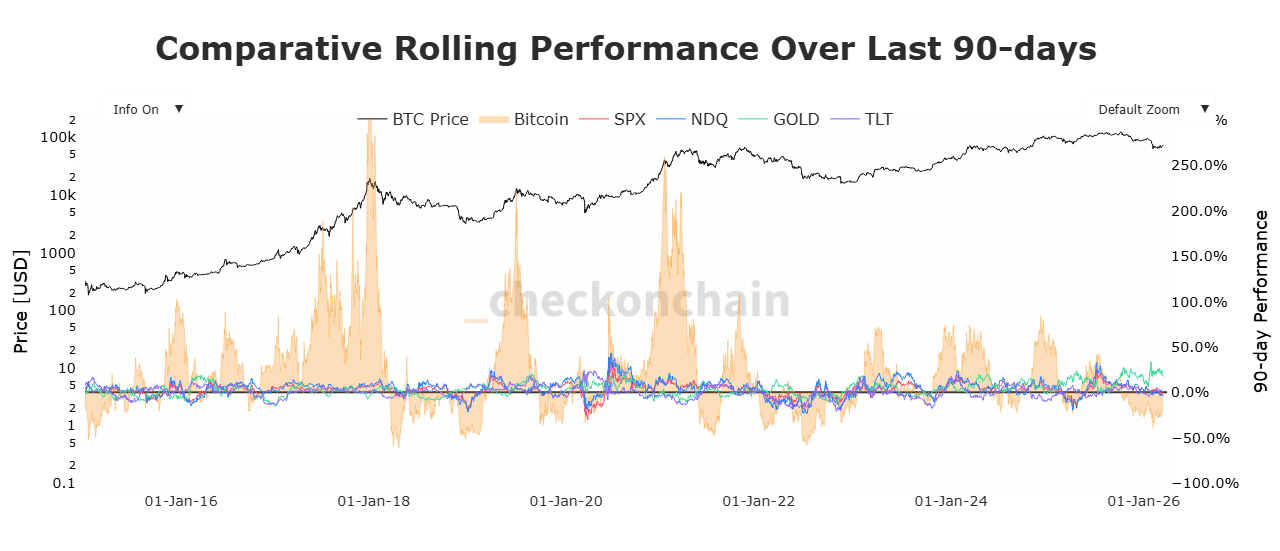
Over the same period, SPX and Nasdaq weakened significantly, with SPX dropping from -0.7% to -2.7% while NDQ fell to -2.7%. Other assets, such as TILT, also continued to weaken, falling to 0.1% from 2.6%.
These showed improved participation and capital inflow favoring BTC relative to other equities.
Moreover, Bitcoin’s realized volatility has outperformed that of all major tech stocks. This time round, BTC showed increased upside volatility while tech stocks remained stable.
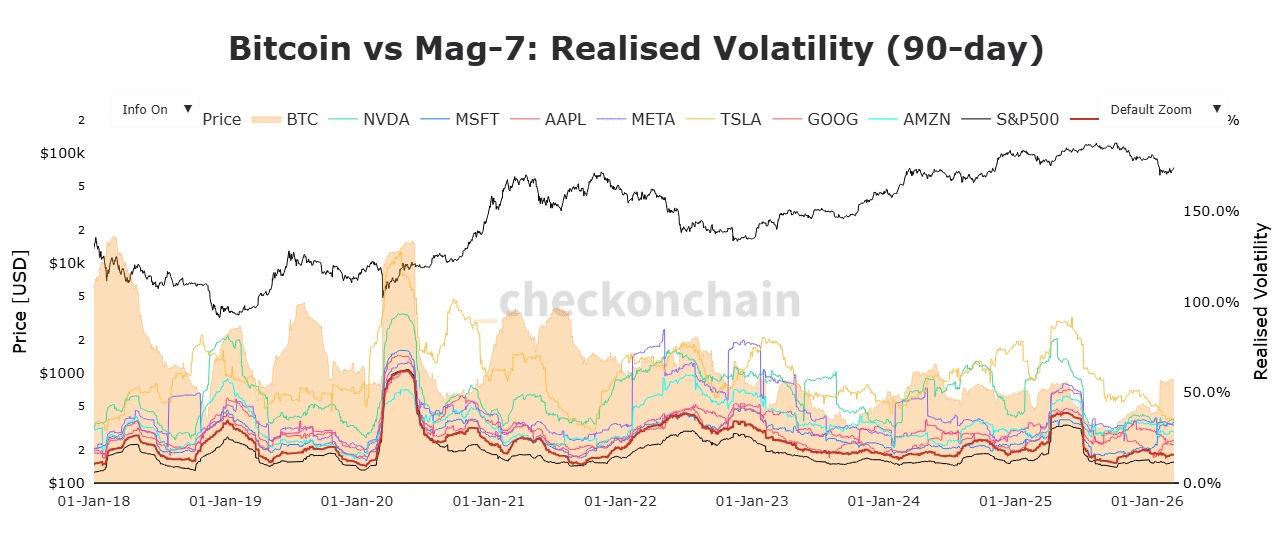

In fact, only Gold and Silver have outperformed BTC, while BTC has remained above SPX, NDQ, and SPX Total Return.
Is this the first signal for a trend reversal?
Bitcoin showed relative strength compared to equities, except Gold and Silver, indicating improved market favorability. Thus, market players have begun deploying significant capital into BTC while pulling out of other competing assets.
As a result, BTC’s upside momentum has gradually strengthened. In fact, Bitcoin’s Future Grand Trend flashed bullish for the first time in nearly two months.
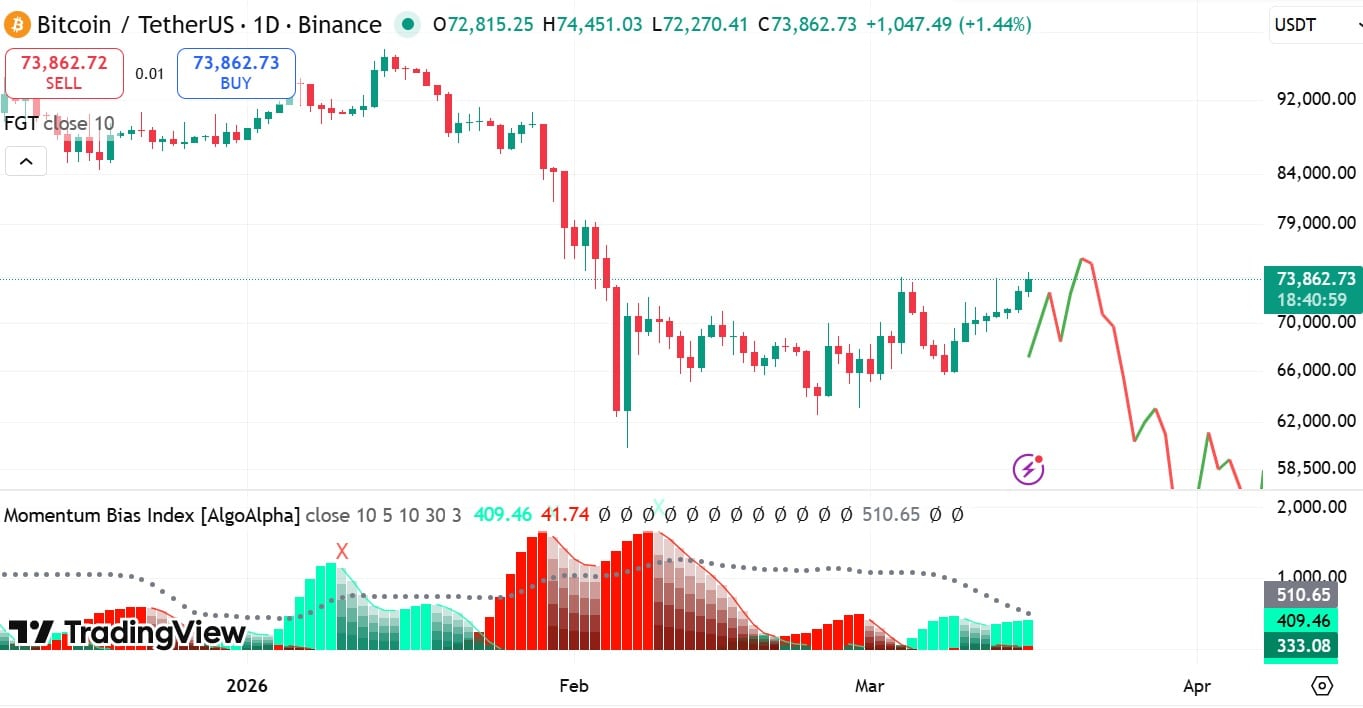

This momentum indicator pointed towards a potential jump to $75,823, before another pullback. Therefore, if the Momentum Bias finally shows buyers’ dominance, this uptrend is likely to continue.
However, the Momentum Bias Index showed mixed momentum with buyers and sellers battling for market control. This suggests that BTC is likely to continue trading sideways, and the next move will depend on which side dominates the market.
Final Summary
- Bitcoin has outperformed equities on a risk-adjusted basis over the past week, indicating improved sentiment.
- BTC extended its bullish streak, touching a monthly high of $74,451 before retracing to $73,862 at press time.