Bitcoin Is Mirroring 2017, Not 2021, And An Explosive Rally Will Begin After This Happens

bitcoinistPublished on 2026-03-03Last updated on 2026-03-03

Abstract

Based on technical analysis comparing Bitcoin's current price structure to historical cycles, this article argues that BTC is mirroring the slower, methodical buildup of 2017 rather than the rapid 2021 cycle. A key observation is that Bitcoin's price remains constrained below a long-term linear regression trendline, a major technical barrier that has historically preceded explosive rallies. In the 2017 cycle, a prolonged consolidation below this line was followed by a decisive breakout and a massive rally. Currently, despite setting a new all-time high, Bitcoin is still respecting this trendline as resistance and is approaching a key support level. The analysis suggests that a bounce from this support, followed by a confirmed breakout above the regression trendline, could initiate a powerful bull phase. This projected move, modeled on the 2017 pattern, has a long-term price target in the $500,000 range. The conclusion is that Bitcoin remains in an accumulation phase, and the true rally will only begin after this critical technical barrier is broken.

Bitcoin’s current price structure is prompting a reassessment in how this cycle is being interpreted. The only place to look for clues is the past, and an interesting technical analysis shows that Bitcoin’s current pattern resembles the slower, methodical buildup that defined 2017.

A long-term chart built around a linear regression channel shows that Bitcoin may still be in a preparatory phase, with one major technical barrier separating today’s consolidation from what could become a powerful rally.

The Linear Regression Line Holding Back The Breakout

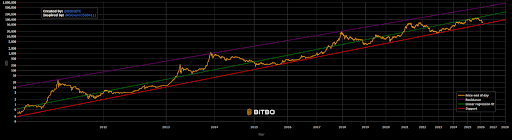
Technical analysis of Bitcoin’s price action posted on X by crypto analyst CW looks at the leading cryptocurrency’s price action fitted on a linear regression, with clearly defined support and resistance bands stretching back over a decade. Notably, Bitcoin’s most aggressive bull phases depicted on the chart began only after price broke above the regression trendline convincingly.

In the 2017 cycle, Bitcoin spent a prolonged period consolidating below this line before finally pushing through it. Once that breakout occurred, the price entered into a strong rally phase that lasted one year. The move ultimately carried BTC from below $1,000 to almost $20,000 in a relatively compressed timeframe.

On the other hand, the 2021 cycle showed a different behavior. Bitcoin’s price action moved more faster earlier in the structure, breaking above trend resistance sooner and running into its $69,000 peak without the same extended base formation seen in 2017.

The current cycle, according to the chart, has yet to produce a decisive break above the linear regression fit. Although Bitcoin has already created a new all-time high above $126,000 on its normal price chart, the price is still respecting this long-term trendline as a ceiling, and this is a sign that the major expansion phase is yet to come. Therefore, the outlook is that the real rally will begin only after this barrier is cleared with conviction.
BTC Price Chart. Source: @CW8900 On X

Structure Points To A Breakout Setup To $500,000

Going by this linear regression fit, Bitcoin is still in an accumulation phase. That assertion is due to the prolonged consolidation below the green regression trendline in the chart above. Right now, BTC is approaching the red support trendline, and the next outlook is a bounce from the support.

The red support trendline on the chart has repeatedly acted as a floor during pullbacks across several cycles. Whenever Bitcoin has tested or moved close to this area, it has coincided with periods that later proved to be significant accumulation phases.

If history repeats in a 2017-style fashion, the important rally moment would be a breakout above the green linear regression fit trendline, followed by a push to the purple resistance trendline. According to the projection illustrated on the chart, such a move would place Bitcoin in a trajectory that targets the $500,000 range before meeting that resistance trendline.

BTC fails to hold $67,000 | Source: BTCUSD on Tradingview.com

Trending Cryptos

Related Questions

QWhat does the technical analysis suggest about Bitcoin's current price structure compared to the 2017 and 2021 cycles?

AThe analysis suggests that Bitcoin's current price structure is mirroring the slower, methodical buildup of the 2017 cycle, not the faster-paced 2021 cycle. It is currently in a prolonged consolidation phase below a key linear regression trendline, similar to the period before the 2017 breakout.

QWhat is the major technical barrier that Bitcoin needs to break through to begin a powerful rally, according to the article?

AThe major technical barrier is the green linear regression fit trendline. A decisive and convincing break above this long-term trendline is identified as the key event that would signal the start of a major explosive rally.

QHow did the 2017 and 2021 cycles differ in their behavior around this linear regression trendline?

AIn 2017, Bitcoin spent a prolonged period consolidating below the trendline before breaking out, which was followed by a strong, year-long rally. In contrast, in 2021, the price broke above the trendline resistance much earlier and faster, reaching its peak without the same extended base formation.

QWhat is the significance of the red support trendline on the chart mentioned in the analysis?

AThe red support trendline has historically acted as a strong floor during price pullbacks across multiple cycles. Periods when Bitcoin tests or moves close to this line have consistently coincided with significant accumulation phases, making it a critical support level.

QWhat is the projected price target for Bitcoin if it breaks out in a 2017-style fashion, according to the chart's illustration?

AIf Bitcoin breaks out above the green linear regression trendline in a 2017-style move, the projection illustrated on the chart targets a trajectory that reaches the $500,000 range before meeting the next major resistance trendline.
Related Reads

South Korean Stock Market Sees Sharp Rebound After Forceful De-leveraging, SK Hynix Rises 30%

On July 31, South Korean stocks staged a historic rebound. The benchmark KOSPI index surged 18.27%, with chipmaker SK Hynix hitting a 30% gain limit. This followed a brutal, near-40% decline in the KOSPI over the previous month, driven largely by a deleveraging spiral involving leveraged ETFs. Analysts attributed the sharp sell-off to structural liquidity issues rather than deteriorating corporate fundamentals. The rally was triggered by a confluence of positive catalysts. Firstly, strong earnings from U.S. cloud giants Microsoft and Amazon alleviated fears of an "AI bubble burst," boosting global tech sentiment. Secondly, SK Group Chairman Chey Tae-won made a rare personal purchase of SK Hynix shares, seen as a strong vote of confidence. Thirdly, the South Korean government announced a 20 trillion won ($139 billion) AI investment fund. In response to the market turmoil, South Korean regulators are tightening controls on leveraged ETFs, admitting oversight shortcomings. Measures include raising minimum cash保证金 requirements for散户 investors and suspending new product launches. While the rebound signals eased liquidity pressure, analysts note deep structural issues remain. The market's future stability is seen as dependent on global tech capital expenditure trends and memory chip price cycles, with some viewing the surge as a technical correction rather than a definitive trend reversal.

marsbit15m ago

South Korean Stock Market Sees Sharp Rebound After Forceful De-leveraging, SK Hynix Rises 30%

marsbit15m ago

Cryptocurrency Company Wintermute Makes Pessimistic Statements Regarding Expected Altcoin Growth! Here are the Details

Crypto market maker Wintermute has made a pessimistic assessment regarding the anticipated altcoin season, suggesting that any upcoming rally may benefit only a limited number of projects. The company reports a record 72% of its spot OTC trading volume in H1 2026 came from institutional clients, whose capital is becoming more selective and concentrated. Data shows institutional traders act quickly on price spikes, while retail interest lasts longer. This selective behavior indicates the classic altcoin season, where hundreds of tokens rise simultaneously, may be changing. Wintermute believes only projects with strong use cases, high liquidity, and institutional appeal will stand out. Supporting this view, CryptoQuant data shows altcoin trading volume against Bitcoin is near its lowest since 2021, with the top 10 altcoins (excluding stablecoins) holding about 80.5% of the total altcoin market cap. Similarly, Kaiko reports that the top 10 altcoins now account for 63% of total altcoin trading volume, up from ~50% a few months ago, indicating capital concentration. Analysts suggest that in the current cautious institutional climate, projects with advanced technology, liquidity, and robust ecosystems will attract disproportionate attention. Therefore, any potential new altcoin season may be less broad than past bull markets, with gains concentrated in a narrower set of promising tokens.

cryptonews.ru15m ago

Cryptocurrency Company Wintermute Makes Pessimistic Statements Regarding Expected Altcoin Growth! Here are the Details

cryptonews.ru15m ago

UNI Activates Fee Switch: Uniswap Completes Commercial Debut, Faces First Test in September

Uniswap's Fee Switch activation on V4 has driven a surge in protocol revenue, with daily income jumping from $118,000 to $318,000. The newly launched Robinhood Chain has become the primary contributor, accounting for over 52% of total revenue, largely fueled by meme coin trading. This revenue fuels a new tokenomic "flywheel": fees accumulate in a pool, incentivizing arbitrageurs to buy and burn UNI tokens, creating deflationary pressure and boosting the token's price. However, concerns loom beneath the surface. Uniswap's revenue is now highly concentrated and dependent on the speculative, volatile activity on Robinhood Chain, which is currently subsidized by free gas fees. This subsidy is set to expire in late September, posing a significant test for sustained transaction volume and, consequently, protocol revenue. Furthermore, UNI's high valuation faces pressure if growth expectations aren't met. Debate also centers on the Fee Switch's impact. While Uniswap founder Hayden Adams clarified that the protocol fee is an "add-on" for traders and does not cut into Liquidity Providers' (LPs) existing share, questions remain about whether higher overall trading costs could indirectly reduce volume and LP earnings over time. Despite these challenges, Uniswap's Fee Switch marks a major step in protocol monetization, with its long-term success hinging on cultivating more sustainable usage beyond speculative trading.

marsbit24m ago

UNI Activates Fee Switch: Uniswap Completes Commercial Debut, Faces First Test in September

marsbit24m ago

Trading

Spot

Hot Articles

What is $BITCOIN

DIGITAL GOLD ($BITCOIN): A Comprehensive Analysis Introduction to DIGITAL GOLD ($BITCOIN) DIGITAL GOLD ($BITCOIN) is a blockchain-based project operating on the Solana network, which aims to combine the characteristics of traditional precious metals with the innovation of decentralized technologies. While it shares a name with Bitcoin, often referred to as “digital gold” due to its perception as a store of value, DIGITAL GOLD is a separate token designed to create a unique ecosystem within the Web3 landscape. Its goal is to position itself as a viable alternative digital asset, although specifics regarding its applications and functionalities are still developing. What is DIGITAL GOLD ($BITCOIN)? DIGITAL GOLD ($BITCOIN) is a cryptocurrency token explicitly designed for use on the Solana blockchain. In contrast to Bitcoin, which provides a widely recognized value storage role, this token appears to focus on broader applications and characteristics. Notable aspects include: Blockchain Infrastructure: The token is built on the Solana blockchain, known for its capacity to handle high-speed and low-cost transactions. Supply Dynamics: DIGITAL GOLD has a maximum supply capped at 100 quadrillion tokens (100P $BITCOIN), although details regarding its circulating supply are currently undisclosed. Utility: While precise functionalities are not explicitly outlined, there are indications that the token could be utilized for various applications, potentially involving decentralized applications (dApps) or asset tokenization strategies. Who is the Creator of DIGITAL GOLD ($BITCOIN)? At present, the identity of the creators and development team behind DIGITAL GOLD ($BITCOIN) remains unknown. This situation is typical among many innovative projects within the blockchain space, particularly those aligning with decentralized finance and meme coin phenomena. While such anonymity may foster a community-driven culture, it intensifies concerns about governance and accountability. Who are the Investors of DIGITAL GOLD ($BITCOIN)? The available information indicates that DIGITAL GOLD ($BITCOIN) does not have any known institutional backers or prominent venture capital investments. The project seems to operate on a peer-to-peer model focused on community support and adoption rather than traditional funding routes. Its activity and liquidity are primarily situated on decentralized exchanges (DEXs), such as PumpSwap, rather than established centralized trading platforms, further highlighting its grassroots approach. How DIGITAL GOLD ($BITCOIN) Works The operational mechanics of DIGITAL GOLD ($BITCOIN) can be elaborated on based on its blockchain design and network attributes: Consensus Mechanism: By leveraging Solana’s unique proof-of-history (PoH) combined with a proof-of-stake (PoS) model, the project ensures efficient transaction validation contributing to the network's high performance. Tokenomics: While specific deflationary mechanisms have not been extensively detailed, the vast maximum token supply implies that it may cater to microtransactions or niche use cases that are still to be defined. Interoperability: There exists the potential for integration with Solana’s broader ecosystem, including various decentralized finance (DeFi) platforms. However, the details regarding specific integrations remain unspecified. Timeline of Key Events Here is a timeline that highlights significant milestones concerning DIGITAL GOLD ($BITCOIN): 2023: The initial deployment of the token occurs on the Solana blockchain, marked by its contract address. 2024: DIGITAL GOLD gains visibility as it becomes available for trading on decentralized exchanges like PumpSwap, allowing users to trade it against SOL. 2025: The project witnesses sporadic trading activity and potential interest in community-led engagements, although no noteworthy partnerships or technical advancements have been documented as of yet. Critical Analysis Strengths Scalability: The underlying Solana infrastructure supports high transaction volumes, which could enhance the utility of $BITCOIN in various transaction scenarios. Accessibility: The potential low trading price per token could attract retail investors, facilitating wider participation due to fractional ownership opportunities. Risks Lack of Transparency: The absence of publicly known backers, developers, or an audit process may yield skepticism regarding the project's sustainability and trustworthiness. Market Volatility: The trading activity is heavily reliant on speculative behavior, which can result in significant price volatility and uncertainty for investors. Conclusion DIGITAL GOLD ($BITCOIN) emerges as an intriguing yet ambiguous project within the rapidly evolving Solana ecosystem. While it attempts to leverage the “digital gold” narrative, its departure from Bitcoin's established role as a store of value underscores the need for a clearer differentiation of its intended utility and governance structure. Future acceptance and adoption will likely depend on addressing the current opacity and defining its operational and economic strategies more explicitly. Note: This report encompasses synthesised information available as of October 2023, and developments may have transpired beyond the research period.

1.2k Total ViewsPublished 2025.05.13Updated 2025.05.13

What is $BITCOIN

Discussions

Welcome to the HTX Community. Here, you can stay informed about the latest platform developments and gain access to professional market insights. Users' opinions on the price of BTC (BTC) are presented below.

活动图片