Author: Michel Athayde, Bitget Wallet BD Ambassador
Abstract
In traditional financial markets, consistently buying deep out-of-the-money (OTM) Put options is often seen as a typical "black swan insurance" strategy: it continuously loses premium payments during normal times, only to break even or make a large profit during extreme risk events. The question is, does this logic still hold in the more volatile and crash-prone crypto market?
The answer from this backtest is not straightforward. Based on historical data from 2018-01-01 to 2026-03-14, we systematically tested BTC and ETH: buying one fixed deep OTM Put every month, holding until expiration, with no market timing. The results show this is not a "stable money-making" strategy, but rather a tail risk insurance tool characterized by extreme right skew, very low win rate, and strong path dependency. Under the baseline portfolio, the final total return for BTC was 97.62%, while for ETH it was -73.07%; meaning the same logic can yield completely opposite long-term results on different assets.
Research Background
"Buying insurance long-term" has always been one of the most debated strategies. Proponents argue that what ultimately determines the fate of long-term capital is not daily fluctuations, but a few systemic crashes; opponents believe that paying premiums year after year is essentially using certain losses to bet on uncertain disasters.
The crypto market makes this debate more interesting. On one hand, the volatility of BTC and ETH is much higher than traditional assets, and sharp drops are not rare; on the other hand, extreme market movements occur more frequently, theoretically making it more suitable for tail risk hedging survival. Thus, a key question arises: if one does not time the market or judge cycles, but mechanically buys one deep OTM Put every month starting from 2018, can this "simplest" form of tail insurance ultimately make money in the long run?
Strategy Design
The rules for this test are very simple and strict. Open a position on the first calendar day of each month; if there is no raw data for that day, postpone to the next available trading day; buy 1 European-style Put, hold until expiration, no early profit-taking or stop-loss. The target Delta for the baseline portfolio is 0.01, expiration is 30 days later, initial capital is $2000, investing 2% of the current account net value each time. If the budget is insufficient to buy a full contract, scale the position according to the budget.
For sensitivity analysis, the backtest was extended to Delta 0.02, 0.05, investment proportions of 1%, 2%, 5%, and expiration days of 14, 30, 45, totaling 54 parameter combinations.
Backtest Methodology
Pricing used the Black-Scholes model, assuming a risk-free rate of 0, with the annualized volatility proxied by the past 30 days' daily return volatility. The strike price was not arbitrarily set but derived by inverting the target Delta. Data-wise, the daily samples for BTC and ETH both cover up to 2026-03-14. After cleaning, BTC has 3055 records, ETH has 3048 records, with no missing dates or closing prices needing repair. In the entire parameter grid, skipped trades were solely due to "expiration date exceeding the backtest end date," with no silent failures.
In other words, these conclusions are not based on a small sample or incomplete data, but on a complete historical review of BTC and ETH under the same set of rules.
Backtest Results
First, look at the baseline portfolio, the version closest to the proposition "buy one fixed deep OTM Put every month": Delta 0.01, invest 2%, hold for 30 days.
The results are highly divergent. BTC executed 98 trades in total, with a final total return of 97.62% and an annualized compound growth rate (CAGR) of 8.66%; ETH also executed 98 trades, but the total return was only -73.07%, with a CAGR of -14.78%. Looking solely at the conclusion, one could say: this strategy can make money long-term on BTC, but not on ETH.
But what is truly noteworthy is not the return itself, but its cost. The maximum drawdown for the BTC baseline portfolio was as high as -97.24%, and for ETH it reached -93.82%. The win rate for BTC was only 2.04%, and for ETH even lower at 1.02%. The median return per trade for both was -100%, and the worst trade for both was also -100%. This means that most of the time, this strategy doesn't "lose a little"; it loses the entire premium at expiration.
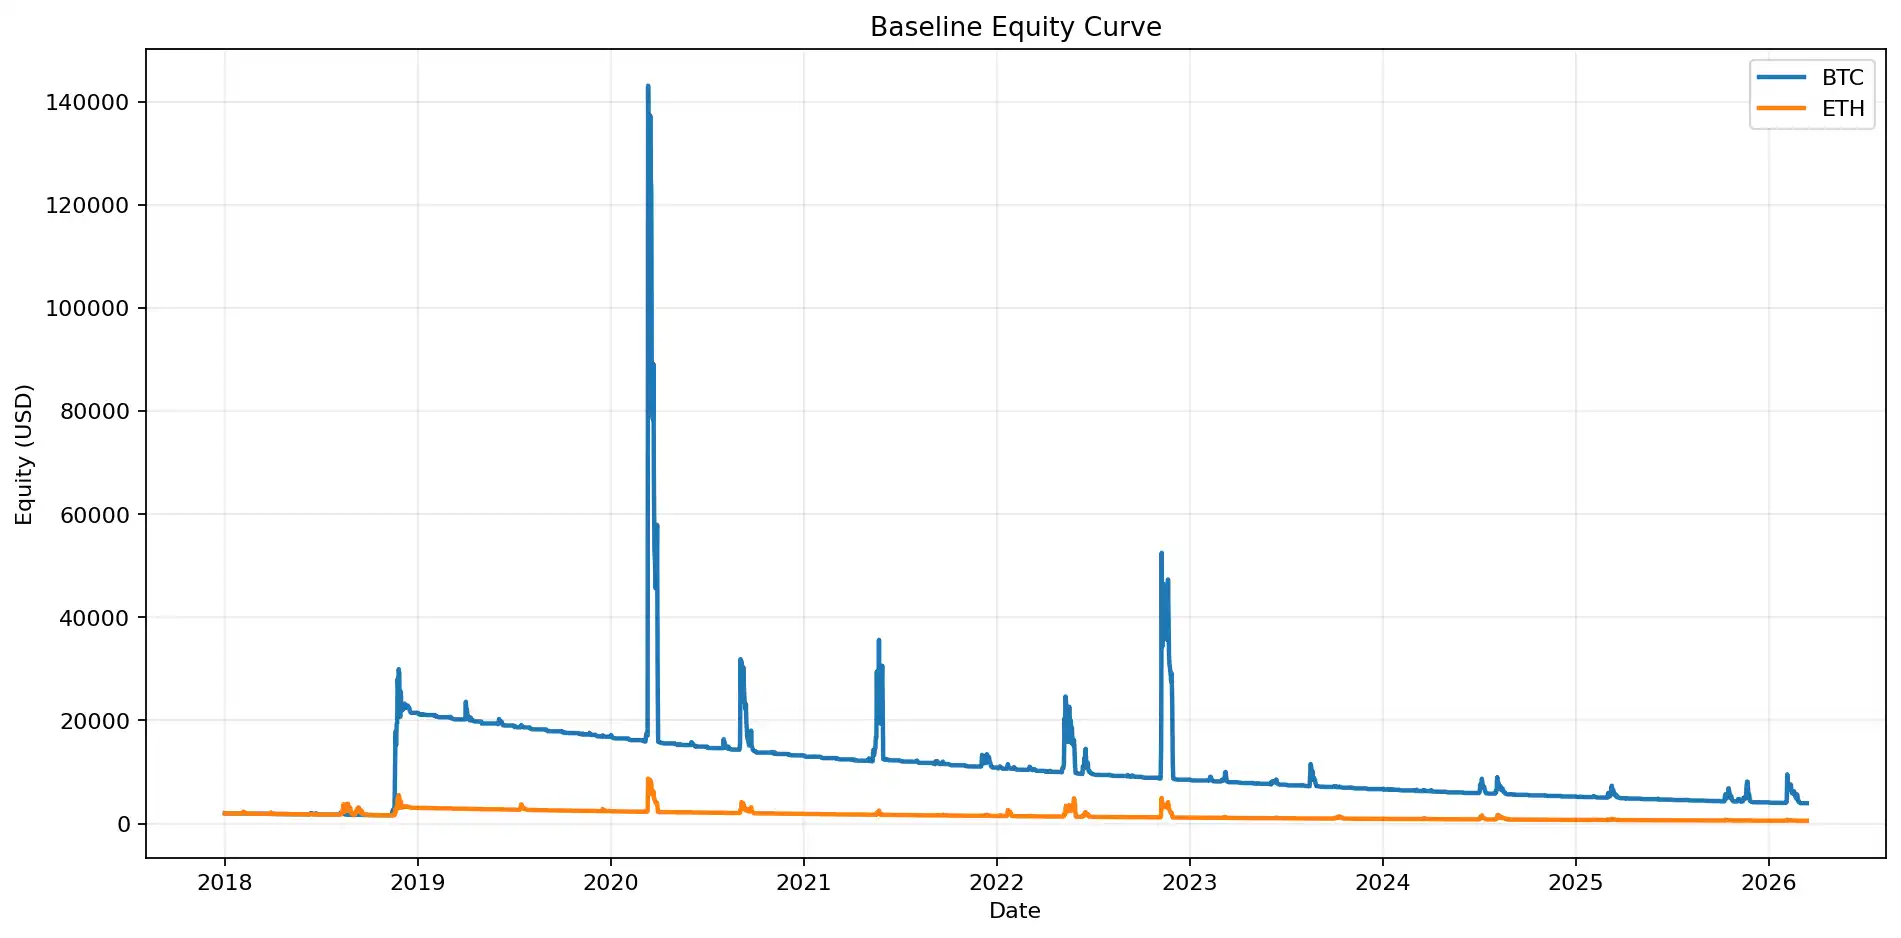
Figure 1: The equity curve of the baseline portfolio shows a clear divergence in long-term results between BTC and ETH. BTC ultimately achieved a positive return, while ETH's net value declined over the long term.
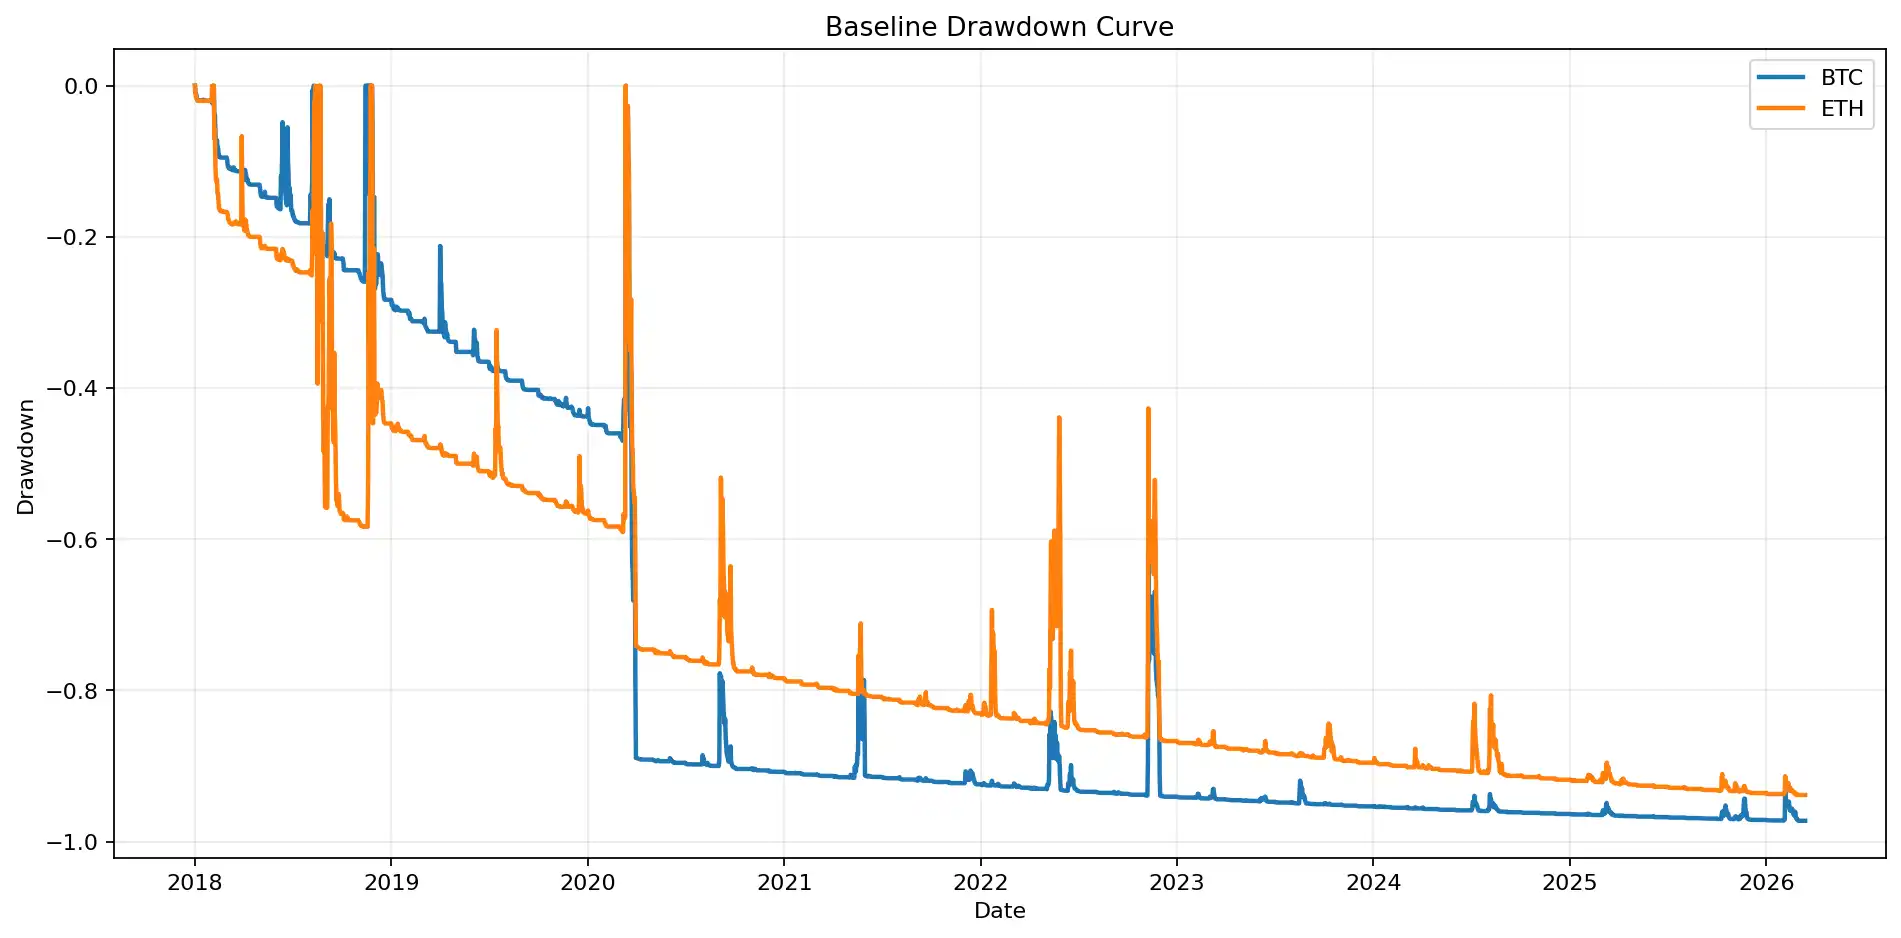
Figure 2: The drawdown curve illustrates that even if such strategies ultimately make money, they can remain deeply underwater for long periods. The maximum drawdown for the BTC baseline portfolio reached -97.24%, and for ETH it was -93.82%.
This is visually clear from the charts. The equity curve does not rise smoothly; instead, it lingers at low levels for long periods, occasionally pulled up by extreme profits in jumps. The drawdown curve remains deeply negative for extended periods. The histogram of single-trade returns is clearly left-skewed, densely clustered at -100%, with only a very few extreme large profits on the right. It is not a traditional "win-rate strategy" but a typical "positive skewness strategy."
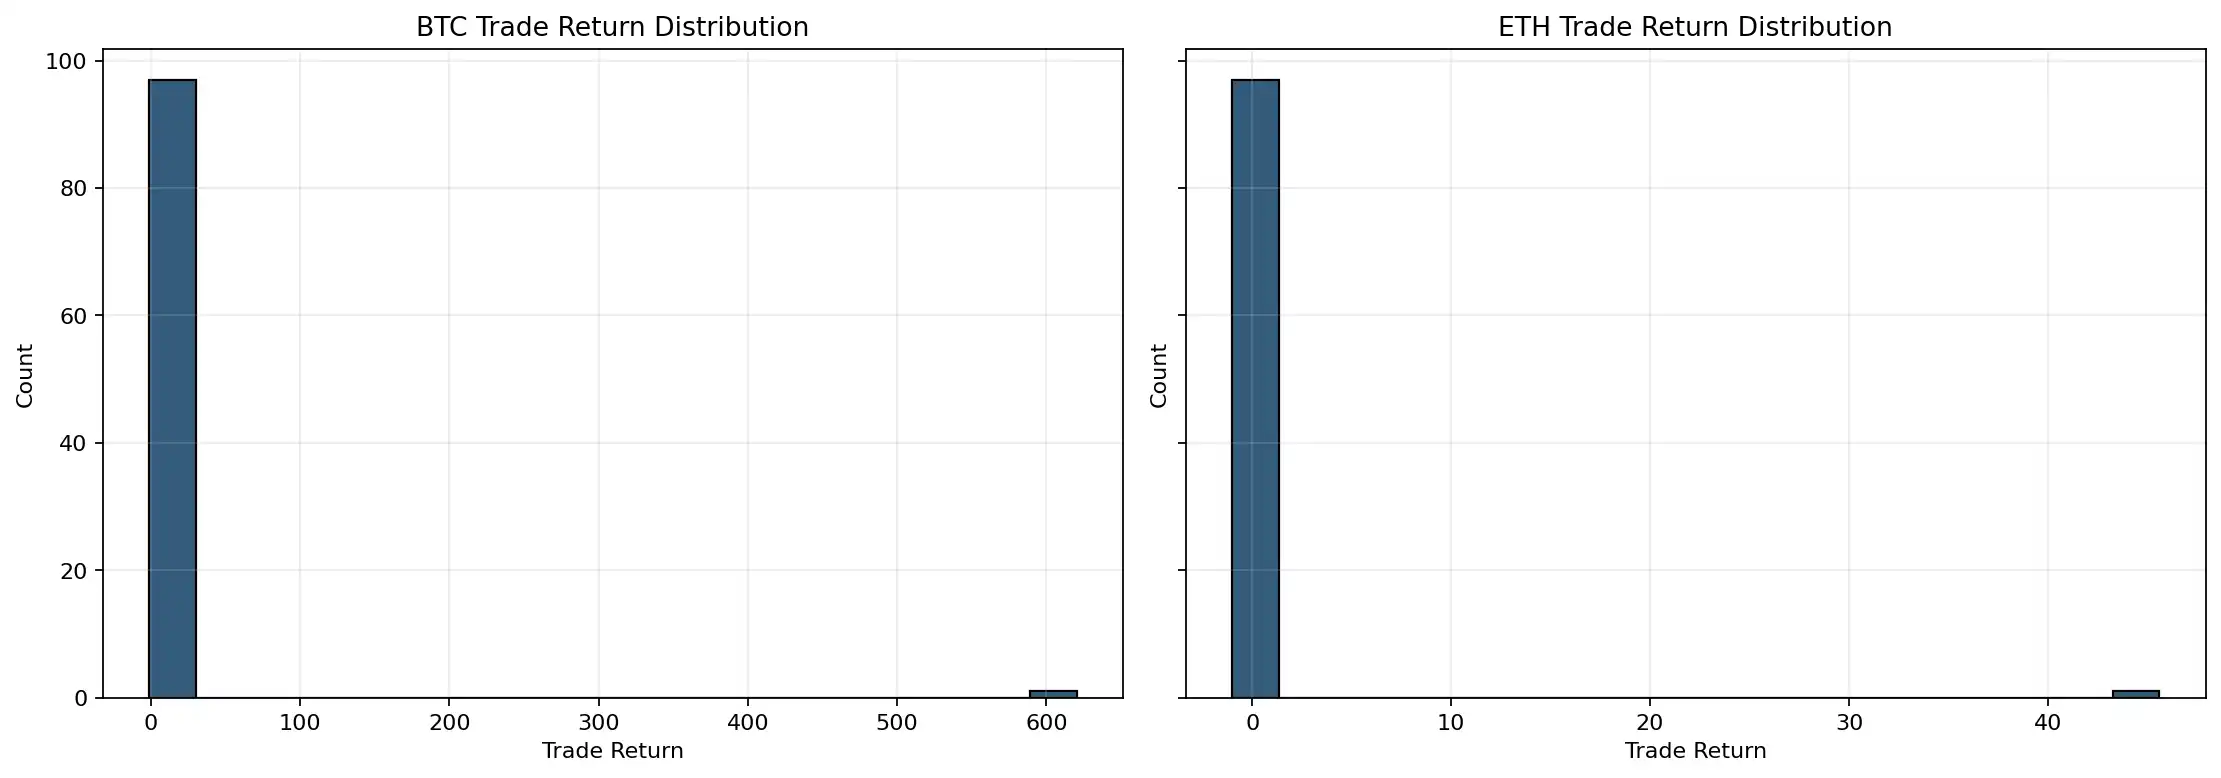
Figure 3: The distribution of single-trade returns is highly right-skewed. Premiums expire worthless in the vast majority of months; a few extremely profitable trades determine the long-term outcome.
Profit Source Analysis
The core feature of this strategy is that profits do not come from "making money in most months" but from "making a lot of money in very few months."
The proportion of profitable months for the BTC baseline portfolio was only 4.08%, and for ETH only 2.04%. The longest consecutive losing months for BTC reached 57 months, and for ETH it reached 87 months. This means that even if it ultimately makes money, an investor might have to endure years of continuous losses and the feeling of the strategy failing.
On the other hand, the single best trade return for the BTC baseline portfolio was over 620 times, and the average single trade return was pulled up to 5.36 by extreme profits; the skewness of the return distribution reached 9.90, and the kurtosis approached 98. The top 5 profitable trades contributed 10.54 times the total net profit for BTC. These numbers almost spell out the nature of this strategy: it doesn't make money through stable carry but relies on a few extreme moments to "reimburse" years of premiums at once.
ETH's structure has similar characteristics, but the problem is that ETH's extreme profits are insufficient to cover the long-term costs. Under the baseline portfolio, ETH paid a total premium of $2984.47 and recovered only $1523.06 at expiration, resulting in a Premium Burn Ratio of 48.97%; whereas BTC paid a total of $18903.47 and recovered $20855.85, resulting in a Premium Burn Ratio of -10.33%, indicating that on BTC, extreme events ultimately covered the premium losses and even left a surplus.
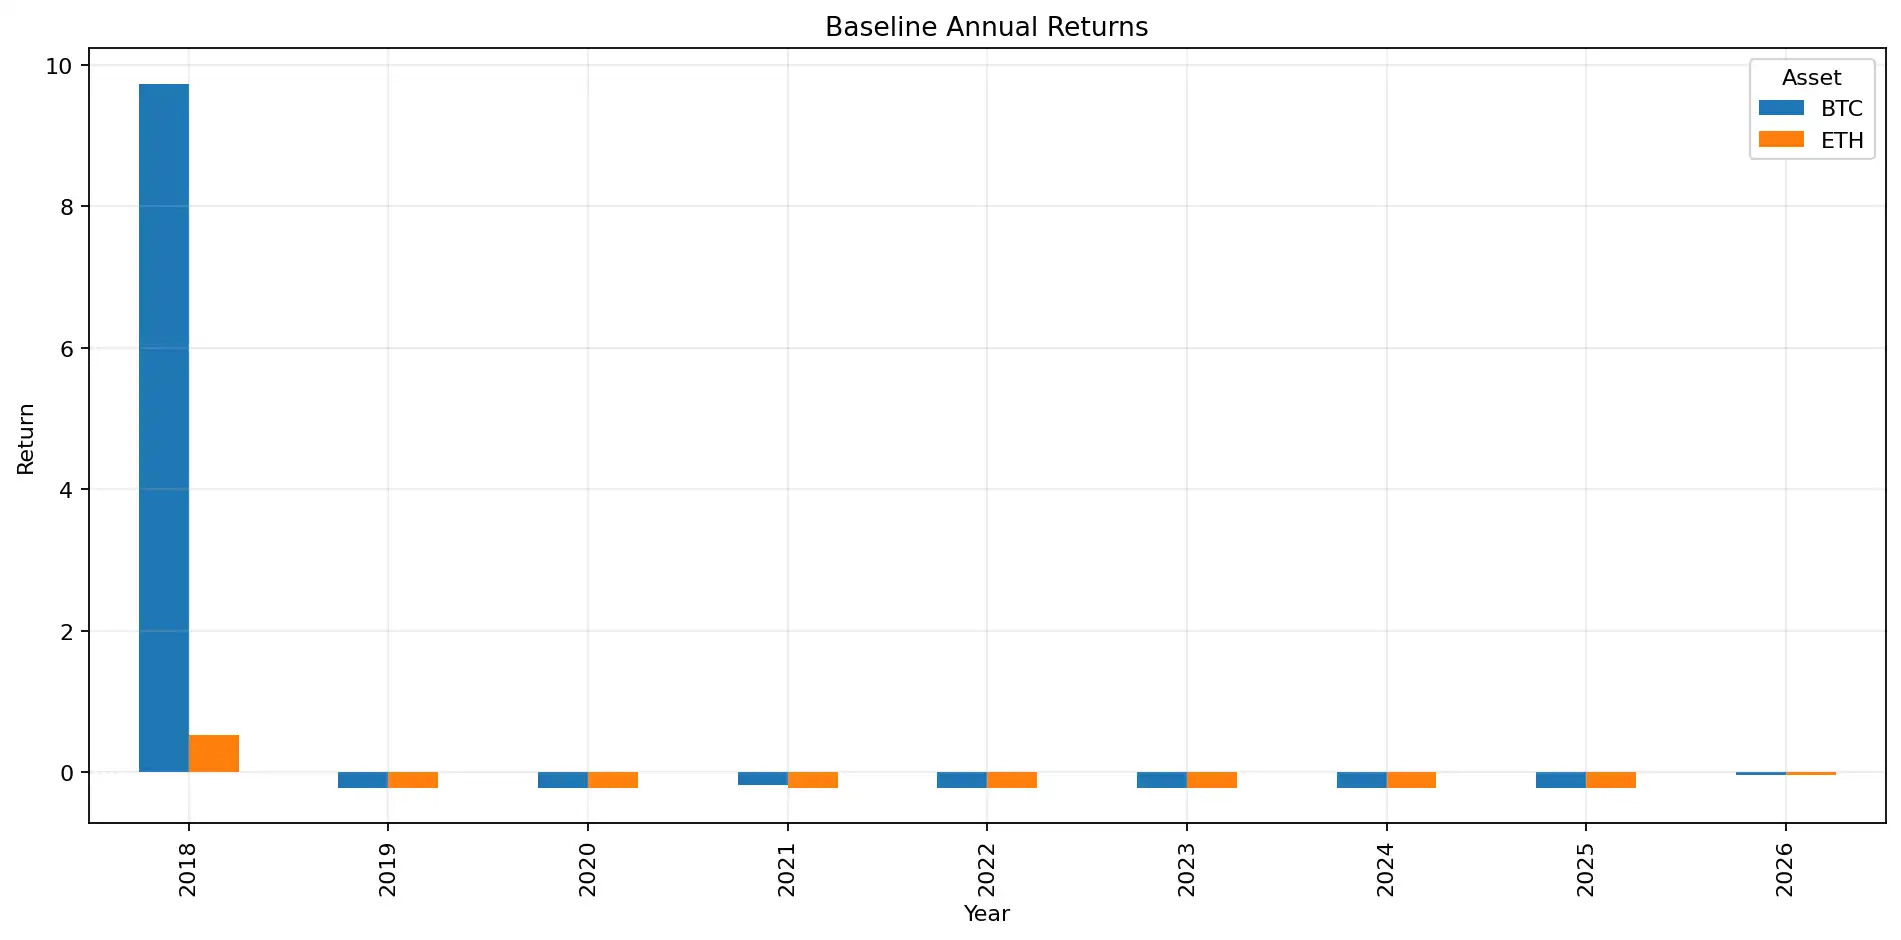
Figure 4: The extreme profit contribution chart shows that BTC's long-term profits are almost entirely driven by a few top trades, which is typical for tail insurance strategies.
Contribution of Extreme Market Conditions to Strategy Returns
A very interesting finding is that "a major market crash occurs" does not equal "your Put will definitely make money." Under the baseline portfolio, we specifically examined the performance of holdings around the March 2020 pandemic crash, the May 2021 crypto crash, the May 2022 LUNA event, and the November 2022 FTX event.
The results are not romantic. For BTC, only the May 2021 event window was profitable, with a single trade return of 127.09%, a recovery multiple of 2.27 times at expiration, contributing 15.87% to the total net profit. The holdings corresponding to March 2020, May 2022, and November 2022 all lost 100% of the premium. For ETH, it was more extreme: all four event windows resulted in 100% losses.
This shows that tail insurance is not "automatically profitable whenever a black swan occurs"; it highly depends on the entry timing, remaining time to expiration, and strike price level. Fixed monthly rolling purchases ensure you are "in the game long-term" but do not guarantee you "hold the most profitable contract at the right time."
BTC vs. ETH Performance Difference
Looking at the average results across the full parameter grid, BTC clearly outperforms ETH. The average total return for all parameter combinations for BTC was 1326.06%, with an average CAGR of 23.87% and an average Tail Insurance Score of 0.544; for ETH, these figures were 519.48%, 13.39%, and 0.362, respectively. In the baseline portfolio, BTC was positive and ETH was negative. This difference is also very evident in the net value comparison charts across different Deltas and durations.
More importantly, BTC's extreme profits are more capable of covering long-term premium costs, while ETH is more prone to remain in a state of "paying premiums long-term without necessarily getting paid back at critical moments." Simply put, when buying tail insurance, BTC is more like "insurance that pays out," while ETH is more like "insurance that is more expensive and harder to claim."
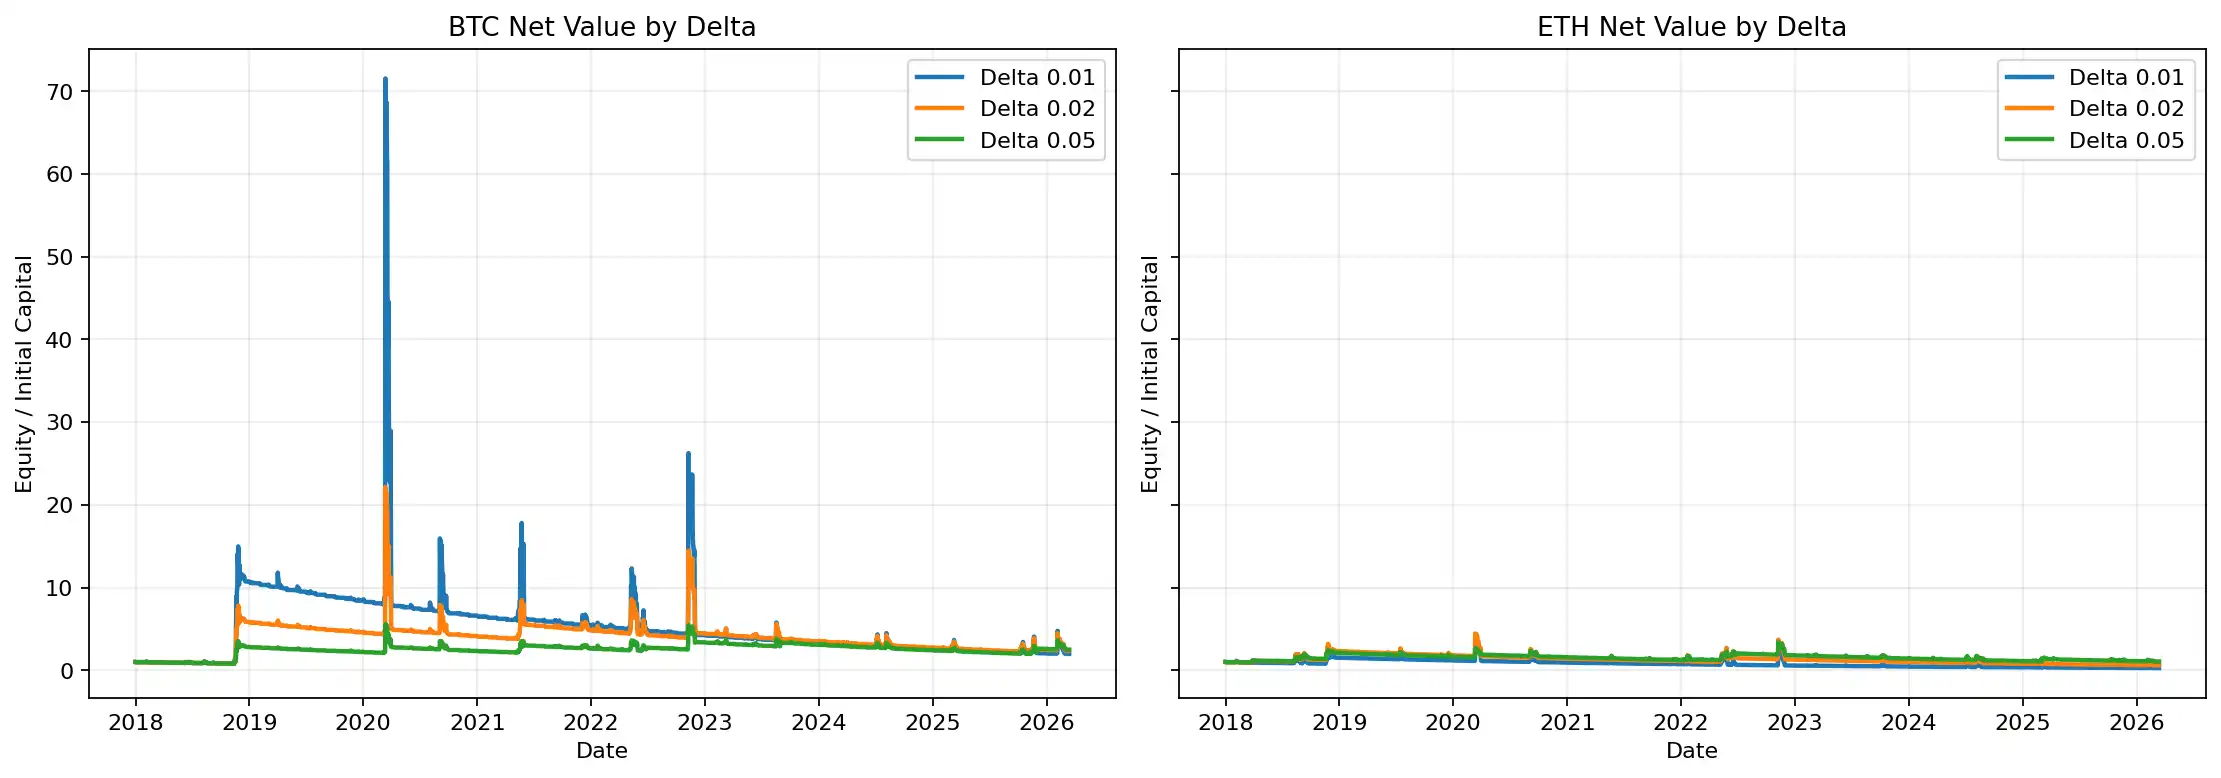
Figure 5: The baseline strategy comparison chart for BTC and ETH shows that although both assets experience extreme volatility, BTC's tail insurance efficiency is higher.
Parameter Sensitivity: Is Deeper Out-of-the-Money Better?
The parameter comparison results provide a more complete picture. Sorted by total return, the highest-yielding combination was for BTC: Delta 0.01, invest 2%, 45 days to expiration, achieving a total return of 9747.06%, corresponding to a CAGR of 74.99%. If looking only at "profitability," deeper OTM, longer duration, and适度杠杆 combinations perform extremely well on BTC.
But if considering risk constraints, the answer is not so simple. The combination with the lowest maximum drawdown was for ETH: Delta 0.05, invest 1%, 14 days, with a maximum drawdown of -37.89%. Looking at comprehensive average metrics, Delta 0.02 offers a better balance between Total Return, Calmar Ratio, and Premium Burn Ratio, making it the most "reasonable" Delta in this full parameter grid.

Figure 6: Net value curves for different Deltas show that the deeper the Delta, the more the strategy resembles typical black swan insurance; when Delta is slightly higher, more balanced combinations appear between returns and capital experience.

Figure 7: Comparison of different investment proportions说明, position size significantly amplifies return elasticity but also同步放大 long-term drawdown and path risk.
Strategy Advantages and Disadvantages
The advantages of this type of strategy are very distinct. First, simple structure, fixed rules, no reliance on subjective judgment. Second, extremely strong convexity; once extreme行情 are hit, the profit elasticity is astonishing. Third, its logic is completely different from mainstream long strategies; it is closer to a risk coverage tool in asset allocation rather than a directional trade.
But the disadvantages are equally harsh. First, the long-term capital experience is extremely poor; low win rate, long periods of drawdown, and consecutive years of losses are all possible. Second, it is highly sensitive to the "holding path"; even if the market crashes, you might not be holding the most profitable Put. Third, although this backtest is strict, it is still based on Black-Scholes and historical volatility proxy; implied volatility skew, liquidity, fees, and slippage in the real market would further affect live results.
What Type of Investor is This Strategy Suitable For?
It is more suitable for three types of people. First, institutional capital that treats it as portfolio insurance, not a primary profit strategy. Second, highly disciplined investors who can withstand years of "appearing to lose continuously." Third, those who explicitly want convex returns in extreme markets, not追求 daily high win rates.
It is not suitable for investors who view it as a "stable money-making model," nor for capital with short-term evaluation cycles that cannot tolerate long-term underwater performance. Because, as the backtest results show, even the ultimately profitable BTC baseline portfolio experienced a -97.24% maximum drawdown and 57 consecutive months of losses. Without极强的 capital endurance, this strategy is almost impossible to hold.
Final Conclusion
If you started buying one deep OTM Put every month since 2018, could you make money in the long run? The answer from this backtest is: Yes, but not in the普遍 sense of "yes." On BTC, the baseline portfolio ultimately achieved a 97.62% total return; on ETH, the same logic lost 73.07%. This means it is not a money-printing machine that works stably across assets and environments.
Is it a strategy purely reliant on extreme markets? Based on the backtest results, essentially yes. The extremely low win rate, the very low proportion of profitable months, the high skewness and kurtosis, and the overwhelming contribution of the top 5 profitable trades to the final net profit all indicate that it is not a strategy that "works hard long-term, collecting a salary monthly," but rather one that "pays premiums long-term, waiting for a few fateful moments."
If one must draw a more practical conclusion from these results, it is this: BTC is more suitable for this type of tail insurance than ETH; Delta 0.02 is a more balanced choice, as it offered better overall value in the full parameter comparison; and if investors seek more extreme convexity, Delta 0.01 remains the most aggressive and most "black swan insurance" like version.
In the end, consistently buying deep OTM Puts is not the most expensive strategy, nor the best strategy. It is more like an expensive but sometimes irreplaceable配置 tool. The question is never "is it worth buying," but rather whether you actually need this insurance, and whether you can withstand the long wait before the真正的理赔 arrives.