Pronóstico del precio de Ethereum: ¿Puede ETH superar los $2,000 mientras la relación ETH/BTC forma un patrón de 'copa y asa'?

cryptonews.ruPublished on 2026-08-03Last updated on 2026-08-03

Abstract

Análisis del precio de Ethereum: ETH se mantiene en consolidación alrededor de $1,850 el 3 de agosto, atrapado entre el soporte clave en $1,837 (retroceso de Fibonacci del 0,382) y la resistencia en la línea de tendencia bajista cerca de $1,900 y la EMA de 100 días en $1,925. El RSI neutro y una posible divergencia bajista sugieren que el impulso alcista aún no está confirmado. La esperanza para los alcistas proviene de dos factores fundamentales: los ETF spot de $ETH registran su cuarta semana consecutiva de entradas netas ($27,42M la última semana), y el ratio $ETH/$BTC está formando un patrón técnico de "Copa con Asa". Una ruptura confirmada por encima de 0,030 en este ratio podría indicar un mejor desempeño de Ethereum frente a Bitcoin. No obstante, persiste un debate estructural sobre la valoración de $ETH. Aunque la red escala rápidamente a través de capas 2 (L2), que procesan mucha más actividad que la capa principal (L1), la captura de valor por parte de la L1 en forma de comisiones quemadas se ha reducido significativamente. Los datos del Q2 muestran que la L1 capturó solo un 4,9% de las comisiones generadas por las aplicaciones construidas sobre ella. Perspectivas: El escenario alcista apunta a una ruptura por encima de $1,925, con un objetivo en $2,042 (Fibonacci 0,618). El escenario bajista, activado por una pérdida del soporte en $1,837, llevaría el precio hacia $1,711 (Fibonacci 0,236).

Ethereum se negocia a $1,856.19 el 3 de agosto, con una caída del 1.44%, consolidándose en el rango de Fibonacci entre $1,837 y $1,939, ya que la línea de tendencia bajista desde el máximo de mayo continúa limitando los intentos de recuperación.

$ETH mantiene el Fibonacci 0.382, pero la línea de tendencia bajista no ha sido rota
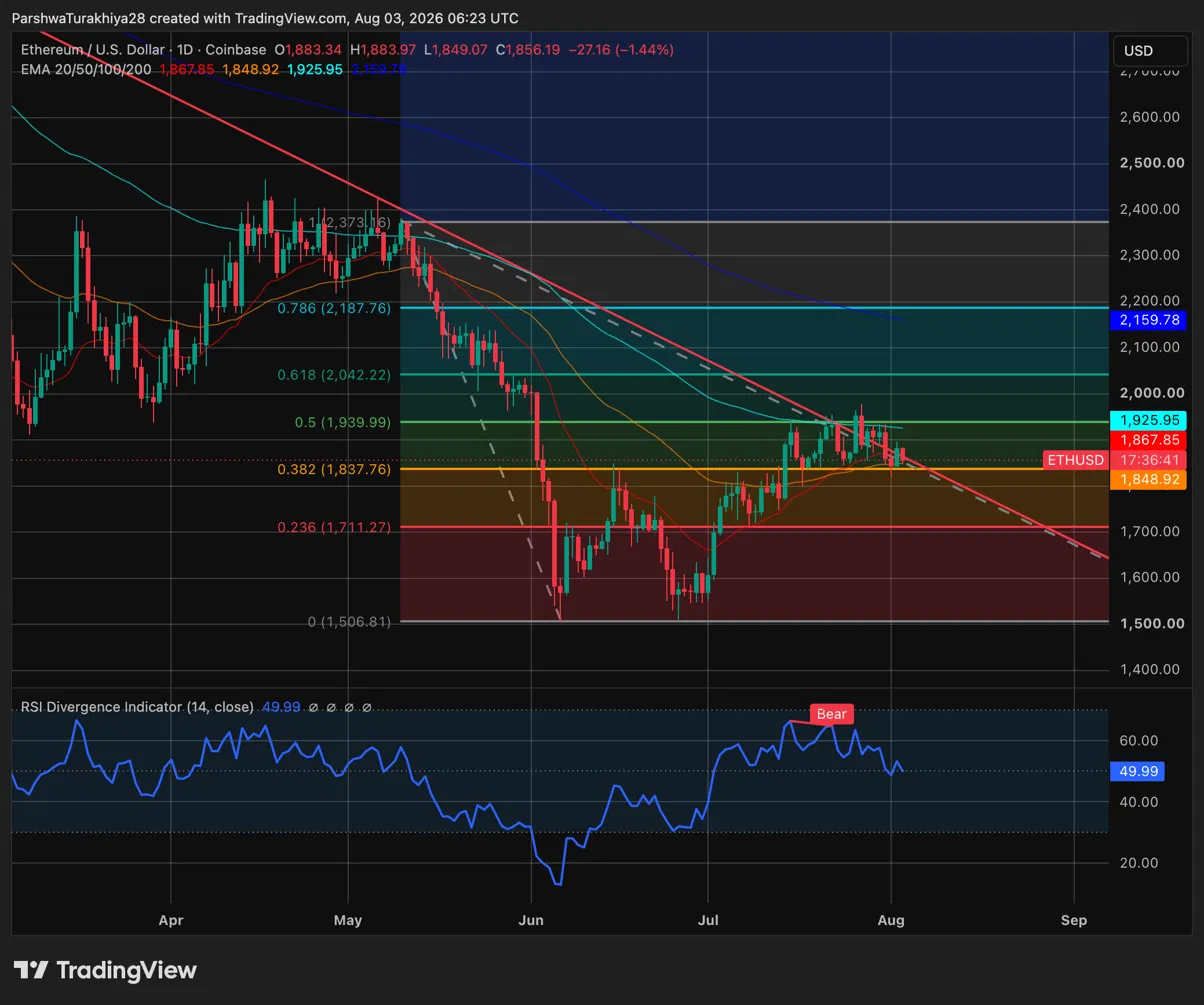
Análisis del precio de Ethereum (Fuente: TradingView)

$ETH se negocia entre el Fibonacci 0.382 en $1,837.76 y el nivel 0.5 en $1,939.99, con la sesión de hoy cayendo desde un máximo de $1,883.97 hasta cerrar en $1,856.19. La EMA de 20 días en $1,867.85 está justo por encima del techo más cercano, y la EMA de 50 días en $1,848.92 es el primer soporte por debajo.

La línea de tendencia bajista desde el pico de mayo alrededor de $2,373 continúa rechazando el precio cerca de $1,900, y la EMA de 100 días en $1,925.95 se agrupa con esta línea, haciendo que la zona de $1,925–$1,940 sea un área clave que superar antes de alcanzar los $2,000. El RSI en 49.99 está justo en neutral con una señal bajista de divergencia, lo que significa que el impulso aún no ha confirmado la recuperación.

Niveles de soporte y resistencia de $ETH, 3 de agosto de 2026

Tipo Precio Nivel
Resistencia $1,867.85 EMA de 20 días, techo más cercano
Resistencia $1,925.95 EMA de 100 días, coincide con la línea de tendencia bajista
Resistencia $1,939.99 Fibonacci 0.5
Resistencia $2,042.22 Fibonacci 0.618
Resistencia $2,159.78 EMA de 200 días, techo a largo plazo
Soporte $1,848.92 EMA de 50 días, primer soporte por debajo
Soporte $1,837.76 Fibonacci 0.382, piso clave
Soporte $1,711.27 Fibonacci 0.236
Soporte $1,506.81 Mínimo de junio, base Fibonacci

Los ETF de $ETH spot registran su cuarta semana consecutiva de entradas

Los ETF spot de Ethereum registraron una entrada neta diaria de $9.03 millones el 31 de julio, elevando el ingreso semanal total a $27.42 millones y extendiendo la racha de entrada de $ETH a cuatro semanas consecutivas , según SoSoValue. Este flujo siguió a las entradas semanales de $103.90 millones, $105.44 millones y $84.42 millones de las tres semanas anteriores, lo que hace de la semana del 31 de julio la más débil de las cuatro, pero aún positiva. Las entradas netas acumuladas para todos los productos ahora ascienden a $11.21 mil millones, con activos netos totales de $10.23 mil millones.

El contraste con los ETF de Bitcoin es notable. Los productos spot de $BTC registraron una salida diaria de $265.37 millones el 31 de julio, interrumpiendo tres semanas de entradas, mientras que los productos de $ETH mantuvieron resultados positivos por cuarta semana consecutiva.

La relación $ETH/$BTC forma un patrón de 'copa y asa'
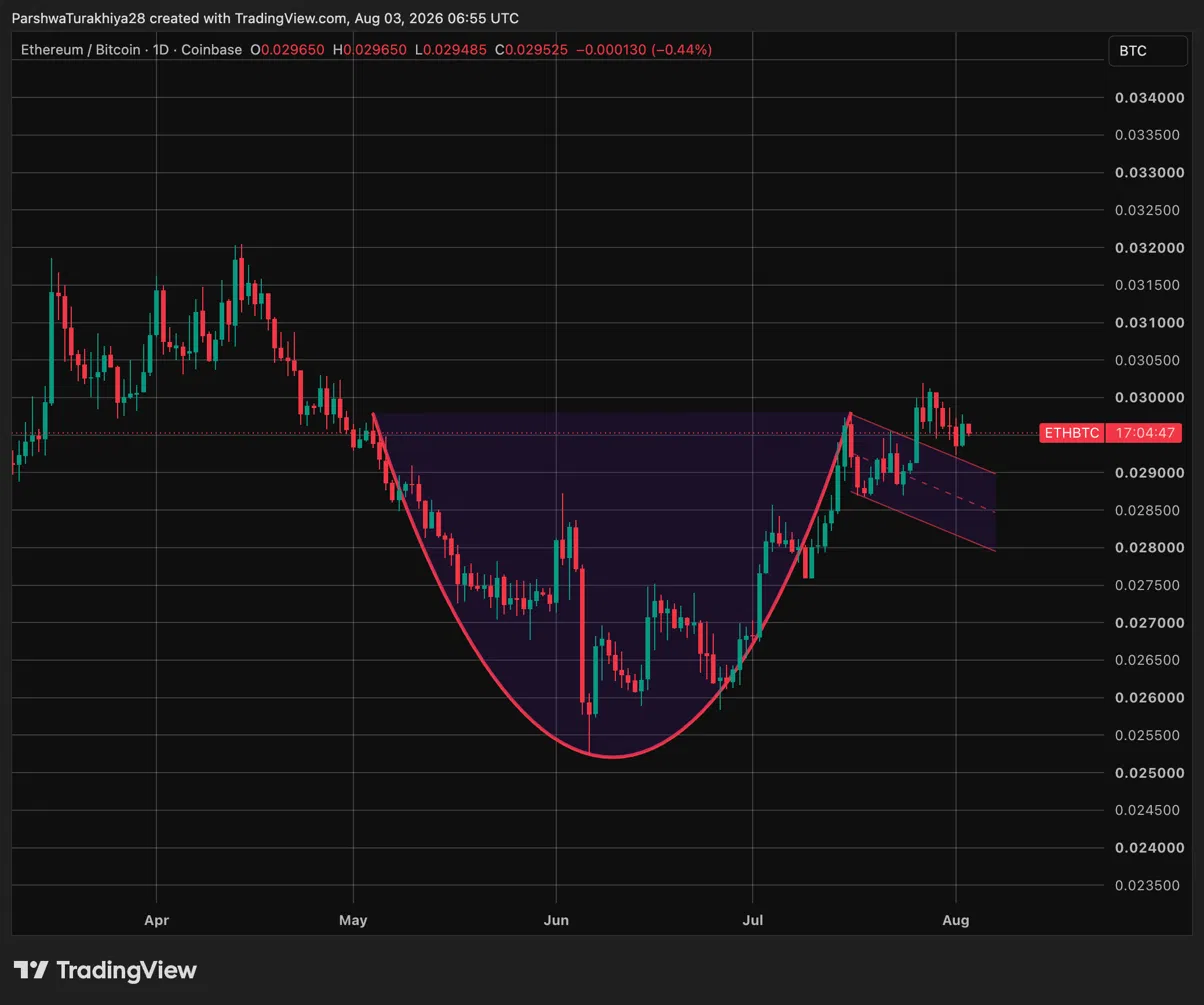
Análisis de la relación $ETH/$BTC (Fuente: TradingView)

El par $ETH/$BTC se negocia a 0.029525 en el gráfico diario, con una caída del 0.44% en la sesión, pero la estructura más amplia presenta una versión más constructiva. La relación ha formado una copa completa desde el máximo de mayo alrededor de 0.0300, alcanzando un mínimo alrededor de 0.0255 en junio antes de recuperarse de nuevo hacia la línea del borde. El precio ahora está formando el 'asa' justo por debajo de la resistencia de 0.030, una configuración clásica de 'copa y asa'.

Una ruptura confirmada por encima de 0.030 en el cierre diario señalaría que $ETH está superando a Bitcoin a corto plazo, lo que históricamente se corresponde con una mayor fortaleza de los altcoins. El límite inferior del asa alrededor de 0.0285 es un nivel a vigilar para un retroceso. Una ruptura por debajo de este nivel volvería a cuestionar la estructura de recuperación y sugeriría que Bitcoin continúa liderando.

Debate sobre la valoración de Ethereum: Escalabilidad sin captura de comisiones

➥ Ethereum está escalando más rápido que nunca, pero $ETH aún se negocia por debajo de $2,000

Como alguien que realmente posee $ETH, creo que esta desconexión es el debate más importante en el ecosistema en este momento.

Los números del Q2 no fueron terribles, pero expusieron una debilidad estructural:

– Ethereum... https://t.co/c8UCEkhCk9 pic.twitter.com/ke8X3XcEiI

— Tanaka (@Tanaka_L2) 31 de julio de 2026

El analista Tanaka señaló una tensión clave en un hilo del 31 de julio: Ethereum está escalando más rápido que nunca, pero el propio $ETH captura cada vez menos del valor creado sobre él.

Los datos del segundo trimestre lo concretan. Ethereum L1 generó $88.4 millones en valor económico real, mientras que las aplicaciones construidas sobre él generaron alrededor de $1.79 mil millones en comisiones, lo que significa que L1 capturó solo el 4.9% de la producción de su ecosistema. Las roll-ups actualmente procesan alrededor de 1,270 operaciones por segundo frente a solo 20.4 en L1, una diferencia de 41.6 veces. Solo Robinhood Chain maneja aproximadamente 4.7 veces más actividad que la red principal de Ethereum. Las comisiones baratas por blobs permitieron la escalabilidad, pero también redujeron la quema de $ETH, con una quema de comisiones por blobs de 7 días de solo 0.22 $ETH.

El argumento de Tanaka es que la teoría antigua de más usuarios impulsando tarifas de gas más altas y más quema de $ETH ya no funciona. Su apuesta actual es en la adopción institucional: $17.2 mil millones en activos reales tokenizados ya están en Ethereum dentro de un mercado de stablecoins de $299.4 mil millones, posicionando a $ETH como infraestructura de garantía y liquidación, no como un activo generador de comisiones.

Métrica Valor
Valor Económico Real L1 $88.4M (crecimiento trimestral del 7%, caída anual del 68%)
Comisiones a nivel de aplicaciones ~$1.79B
Tasa de Captura de Valor L1 ~4.9% de las comisiones a nivel de aplicación
Actividad en roll-ups ~1,270 UOPS frente a 20.4 en L1
Quema de comisiones por blobs (7 días) ~0.22 $ETH
$ETH en staking ~41.10M (33.7% de la oferta)
RWA Tokenizados en Ethereum ~$17.2B

Pronóstico del precio de Ethereum: Objetivos alcistas y bajistas

Escenario alcista, objetivo: $2,042 (Fibonacci 0.618)

$ETH mantiene la EMA de 50 días en $1,848.92 y recupera la EMA de 20 días en $1,867.85 al cierre diario, confirmando el Fibonacci 0.382 como soporte. La línea de tendencia bajista se rompe mientras las entradas de $ETH en ETF continúan por quinta semana consecutiva, y la relación $ETH/$BTC confirma la ruptura del patrón 'copa y asa' por encima de 0.030. El precio rompe a través de la EMA de 100 días en $1,925.95 y el nivel psicológico de $2,000 hacia el Fibonacci 0.618 en $2,042.22.

Escenario bajista, nivel de riesgo: $1,711 (Fibonacci 0.236)

La línea de tendencia bajista continúa rechazando el precio, y la divergencia bajista del RSI gana fuerza. $ETH pierde la EMA de 50 días en $1,848.92 y el Fibonacci 0.382 en $1,837.76, mientras que el índice $ETH/$BTC rompe por debajo de 0.0285, confirmando la reanudación del dominio de Bitcoin. El precio desciende hacia el Fibonacci 0.236 en $1,711.27, y el mínimo de junio en $1,506.81 vuelve a considerarse para un mínimo más profundo.

end-content

Trending Cryptos

Related Reads

Wall Street Morning Report: AI + Cloud Computing Takes Over the Market Again, Amazon Knocks on the Door of $3 Trillion

Wall Street's August began with a strong rally, driven by easing Middle East tensions as President Trump signaled progress on U.S.-Iran talks, prompting a sharp drop in oil prices. Major indices hit record or near-record highs, with the Dow Jones Industrial Average up 1.32%, the Nasdaq Composite surging 2.13%, and the S&P 500 rising 1.48%. The energy sector was the sole decliner. The AI and cloud computing narrative dominated the tech rally. The "Magnificent Seven" index jumped 3.6%. Amazon's market cap surpassed $3 trillion for the first time following robust AWS results, while Nvidia regained a $5 trillion valuation. Meta, Google, and Microsoft also posted significant gains. Other AI-related stocks like Palantir, CoreWeave, and various semiconductor and infrastructure companies saw strong advances. In other markets, gold held above $4,000, supported by central bank buying. Treasury yields fell as oil prices dropped. The U.S. dollar remained stable despite strong manufacturing data. Japan's substantial currency intervention raised concerns, but U.S. officials reassured markets about the mechanism used. Key events ahead include major industry conferences (Ai4 2026, FMS Summit) and earnings reports from companies like SpaceX, AMD, and Pfizer. The White House is also set to host a meeting with leading AI firms to discuss regulatory frameworks.

marsbit4m ago

Wall Street Morning Report: AI + Cloud Computing Takes Over the Market Again, Amazon Knocks on the Door of $3 Trillion

marsbit4m ago

The July Tech Stock Pullback: Which Funds Are Paying the Price for Buying High?

In July, China's technology stocks experienced a sharp correction, causing significant pain for actively managed mutual funds that aggressively increased their holdings in the sector during the second quarter. The sell-off saw major indices like the ChiNext and STAR 50 fall over 25% and 28% for the month, respectively. Funds that piled into tech at its June peak faced steep losses. Notably, several veteran "value investor" fund managers, known for long-term holdings in consumer staples, made dramatic shifts. Star managers like Zhang Kun (E Fund Blue Chip Selected) and Liu Yanchun (Invesco Great Wall Dingyi) drastically reduced positions in liquor stocks like Kweichow Moutai, switching instead to semiconductor and AI hardware companies like SMIC and Ingenic International. Data shows active equity funds' allocation to the electronics sector reached a historical high of 42.64% by end-Q2. Around 67 funds saw their TMT (Technology, Media, Telecom) weighting surge from an average of 6.75% to 54.99%. The consequences were severe in July: these high-TMT funds fell an average of over 20%, with 12 plunging more than 40%. Examples include Jinhua High-Quality Growth and Guoshou Anbao Wenhui, which fell 26.34% and nearly 40% respectively after raising TMT weights above 70%. The article also highlights issues of "style drift," where funds with names like "high-dividend" held high-P/E tech stocks instead, confusing investors. Newly launched funds suffered even more. For instance, Guotai Haitong New Energy RuiXuan Hybrid, launched in mid-June, saw its net asset value plummet to 0.5509 yuan by July 30, a loss of nearly 45%. Analysts note the extreme sector concentration mirrored past bubbles (e.g., 2021 new energy). The intense, crowded trade itself became a major risk. While tech stocks rebounded sharply on July 31, the funds that chased the high face a longer-term market test.

marsbit20m ago

The July Tech Stock Pullback: Which Funds Are Paying the Price for Buying High?

marsbit20m ago

Dalio's Warning: AI Bubble Is Here, Gold Is the Hard Asset

Ray Dalio, founder of Bridgewater Associates, warns that the AI sector is currently in a bubble, drawing parallels to historical examples like the 1929 crash and the dot-com bubble. He explains that revolutionary new technologies lead to excessive excitement and investment, often with investors ignoring price fundamentals and taking on debt, which ultimately creates unsustainable asset valuations. Dalio outlines three key signs that a bubble is about to burst: 1) Rising interest rates, which force asset sales for liquidity. 2) A significant increase in stock supply as companies issue more shares. 3) A shift in ownership from steadfast institutional investors to less knowledgeable, often leveraged, retail investors. To navigate the potential downturn, he strongly advocates for a diversified investment portfolio, criticizing cash as a poor long-term store of value due to inflation. He specifically recommends allocating 5-15% of a portfolio to gold, which he views as a unique "hard asset" and an effective hedge because it is no one else's liability. In contrast, he is skeptical of Bitcoin as "digital gold," citing potential vulnerabilities to future technologies like quantum computing and government intervention. Regarding the AI revolution, Dalio believes the primary beneficiaries will be capitalists who own the automating technology, potentially exacerbating wealth inequality as machines replace both physical and increasingly complex cognitive labor. However, he concludes that humans with exceptional intelligence and strong collaborative skills will continue to thrive by leveraging uniquely human traits like emotion and intuition that AI cannot replicate. Finally, touching on his theory of long-term cycles, Dalio suggests the world is currently approaching a significant inflection point in an approximate 80-year cycle of changing world orders.

marsbit48m ago

Dalio's Warning: AI Bubble Is Here, Gold Is the Hard Asset

marsbit48m ago

On the Eve of Circle's Earnings Report, Wall Street Shows Major Divergence in CRCL Valuation

On the eve of Circle (CRCL) releasing its quarterly earnings report, Wall Street analysts are deeply divided over the company's valuation. Morgan Stanley downgraded Circle from "Equal Weight" to "Underweight," slashing its price target from $106 to $38. Analyst James Faucette argues the market overestimates the growth potential of Circle's core USDC stablecoin, noting its circulation hasn't increased since Q3 2025 and new use cases beyond remittances and card spending are limited. He warns that slowing USDC growth could pressure the crucial "reserve income" and shift revenue toward lower-margin transaction fees. In stark contrast, TD Cowen initiated coverage with a "Buy" rating and an $82 price target. Analyst Bryan Bergin believes the market underestimates Circle's potential to evolve from a stablecoin issuer into a broader digital financial infrastructure platform. He forecasts a ~31% annual growth rate for USDC through 2030 and expects faster growth in fee-based revenue from services like payments, RWA tokenization, and its Arc network. A key external factor adding uncertainty is the stalled progress of the CLARITY Act in the US Senate, whose delay could dampen institutional adoption expectations for stablecoins. The core disagreement lies in whether Circle's future hinges on USDC circulation growth or a successful platform-based transformation. The upcoming earnings report is keenly awaited for insights into reserve income trends and the progress of newer business verticals.

marsbit2h ago

On the Eve of Circle's Earnings Report, Wall Street Shows Major Divergence in CRCL Valuation

marsbit2h ago

Trading

Spot

Hot Articles

What is $BITCOIN

DIGITAL GOLD ($BITCOIN): A Comprehensive Analysis Introduction to DIGITAL GOLD ($BITCOIN) DIGITAL GOLD ($BITCOIN) is a blockchain-based project operating on the Solana network, which aims to combine the characteristics of traditional precious metals with the innovation of decentralized technologies. While it shares a name with Bitcoin, often referred to as “digital gold” due to its perception as a store of value, DIGITAL GOLD is a separate token designed to create a unique ecosystem within the Web3 landscape. Its goal is to position itself as a viable alternative digital asset, although specifics regarding its applications and functionalities are still developing. What is DIGITAL GOLD ($BITCOIN)? DIGITAL GOLD ($BITCOIN) is a cryptocurrency token explicitly designed for use on the Solana blockchain. In contrast to Bitcoin, which provides a widely recognized value storage role, this token appears to focus on broader applications and characteristics. Notable aspects include: Blockchain Infrastructure: The token is built on the Solana blockchain, known for its capacity to handle high-speed and low-cost transactions. Supply Dynamics: DIGITAL GOLD has a maximum supply capped at 100 quadrillion tokens (100P $BITCOIN), although details regarding its circulating supply are currently undisclosed. Utility: While precise functionalities are not explicitly outlined, there are indications that the token could be utilized for various applications, potentially involving decentralized applications (dApps) or asset tokenization strategies. Who is the Creator of DIGITAL GOLD ($BITCOIN)? At present, the identity of the creators and development team behind DIGITAL GOLD ($BITCOIN) remains unknown. This situation is typical among many innovative projects within the blockchain space, particularly those aligning with decentralized finance and meme coin phenomena. While such anonymity may foster a community-driven culture, it intensifies concerns about governance and accountability. Who are the Investors of DIGITAL GOLD ($BITCOIN)? The available information indicates that DIGITAL GOLD ($BITCOIN) does not have any known institutional backers or prominent venture capital investments. The project seems to operate on a peer-to-peer model focused on community support and adoption rather than traditional funding routes. Its activity and liquidity are primarily situated on decentralized exchanges (DEXs), such as PumpSwap, rather than established centralized trading platforms, further highlighting its grassroots approach. How DIGITAL GOLD ($BITCOIN) Works The operational mechanics of DIGITAL GOLD ($BITCOIN) can be elaborated on based on its blockchain design and network attributes: Consensus Mechanism: By leveraging Solana’s unique proof-of-history (PoH) combined with a proof-of-stake (PoS) model, the project ensures efficient transaction validation contributing to the network's high performance. Tokenomics: While specific deflationary mechanisms have not been extensively detailed, the vast maximum token supply implies that it may cater to microtransactions or niche use cases that are still to be defined. Interoperability: There exists the potential for integration with Solana’s broader ecosystem, including various decentralized finance (DeFi) platforms. However, the details regarding specific integrations remain unspecified. Timeline of Key Events Here is a timeline that highlights significant milestones concerning DIGITAL GOLD ($BITCOIN): 2023: The initial deployment of the token occurs on the Solana blockchain, marked by its contract address. 2024: DIGITAL GOLD gains visibility as it becomes available for trading on decentralized exchanges like PumpSwap, allowing users to trade it against SOL. 2025: The project witnesses sporadic trading activity and potential interest in community-led engagements, although no noteworthy partnerships or technical advancements have been documented as of yet. Critical Analysis Strengths Scalability: The underlying Solana infrastructure supports high transaction volumes, which could enhance the utility of $BITCOIN in various transaction scenarios. Accessibility: The potential low trading price per token could attract retail investors, facilitating wider participation due to fractional ownership opportunities. Risks Lack of Transparency: The absence of publicly known backers, developers, or an audit process may yield skepticism regarding the project's sustainability and trustworthiness. Market Volatility: The trading activity is heavily reliant on speculative behavior, which can result in significant price volatility and uncertainty for investors. Conclusion DIGITAL GOLD ($BITCOIN) emerges as an intriguing yet ambiguous project within the rapidly evolving Solana ecosystem. While it attempts to leverage the “digital gold” narrative, its departure from Bitcoin's established role as a store of value underscores the need for a clearer differentiation of its intended utility and governance structure. Future acceptance and adoption will likely depend on addressing the current opacity and defining its operational and economic strategies more explicitly. Note: This report encompasses synthesised information available as of October 2023, and developments may have transpired beyond the research period.

1.4k Total ViewsPublished 2025.05.13Updated 2025.05.13

What is $BITCOIN

Discussions

Welcome to the HTX Community. Here, you can stay informed about the latest platform developments and gain access to professional market insights. Users' opinions on the price of BTC (BTC) are presented below.

活动图片