Avenir + Glassnode: Bitcoin's Liquidity Profile

insights.glassnodePublished on 2025-06-23Last updated on 2025-07-01

As Bitcoin integrates more deeply with global markets, its behavior is shifting - no longer governed by crypto-native cycles but by global liquidity, regulated access points, and institutional positioning. This report, co-authored by Glassnode and Avenir Group, presents a multi-dimensional analysis of Bitcoin’s market structure through on-chain activity, exchange-based liquidity, and macroeconomic linkages.

Across four chapters, the report introduces a unified liquidity framework that helps decode market conditions with greater precision - and contextualizes Bitcoin's role in a complex, multi-asset world.

📄
Download your copy of the report here.

A Unified Framework for Analyzing Bitcoin’s Liquidity

The Avenir x Glassnode report introduces a framework that integrates on-chain activity, market microstructure, and macroeconomic linkages into a single analytical view.

Rather than treating these layers in isolation, the report examines how capital moves between them - and how structural imbalances in one domain (such as ETF flows or order book depth) can influence dynamics across the broader market.

Below is a preview of key findings from the study:

On-Chain Liquidity: Demand Scales with Bitcoin’s Market Maturity

Bitcoin’s price performance since the 2022 cycle low continues to track closely with previous cycles - despite a significantly larger market capitalization. This indicates that capital inflows are scaling in line with the asset’s growth, reinforcing its structural depth.
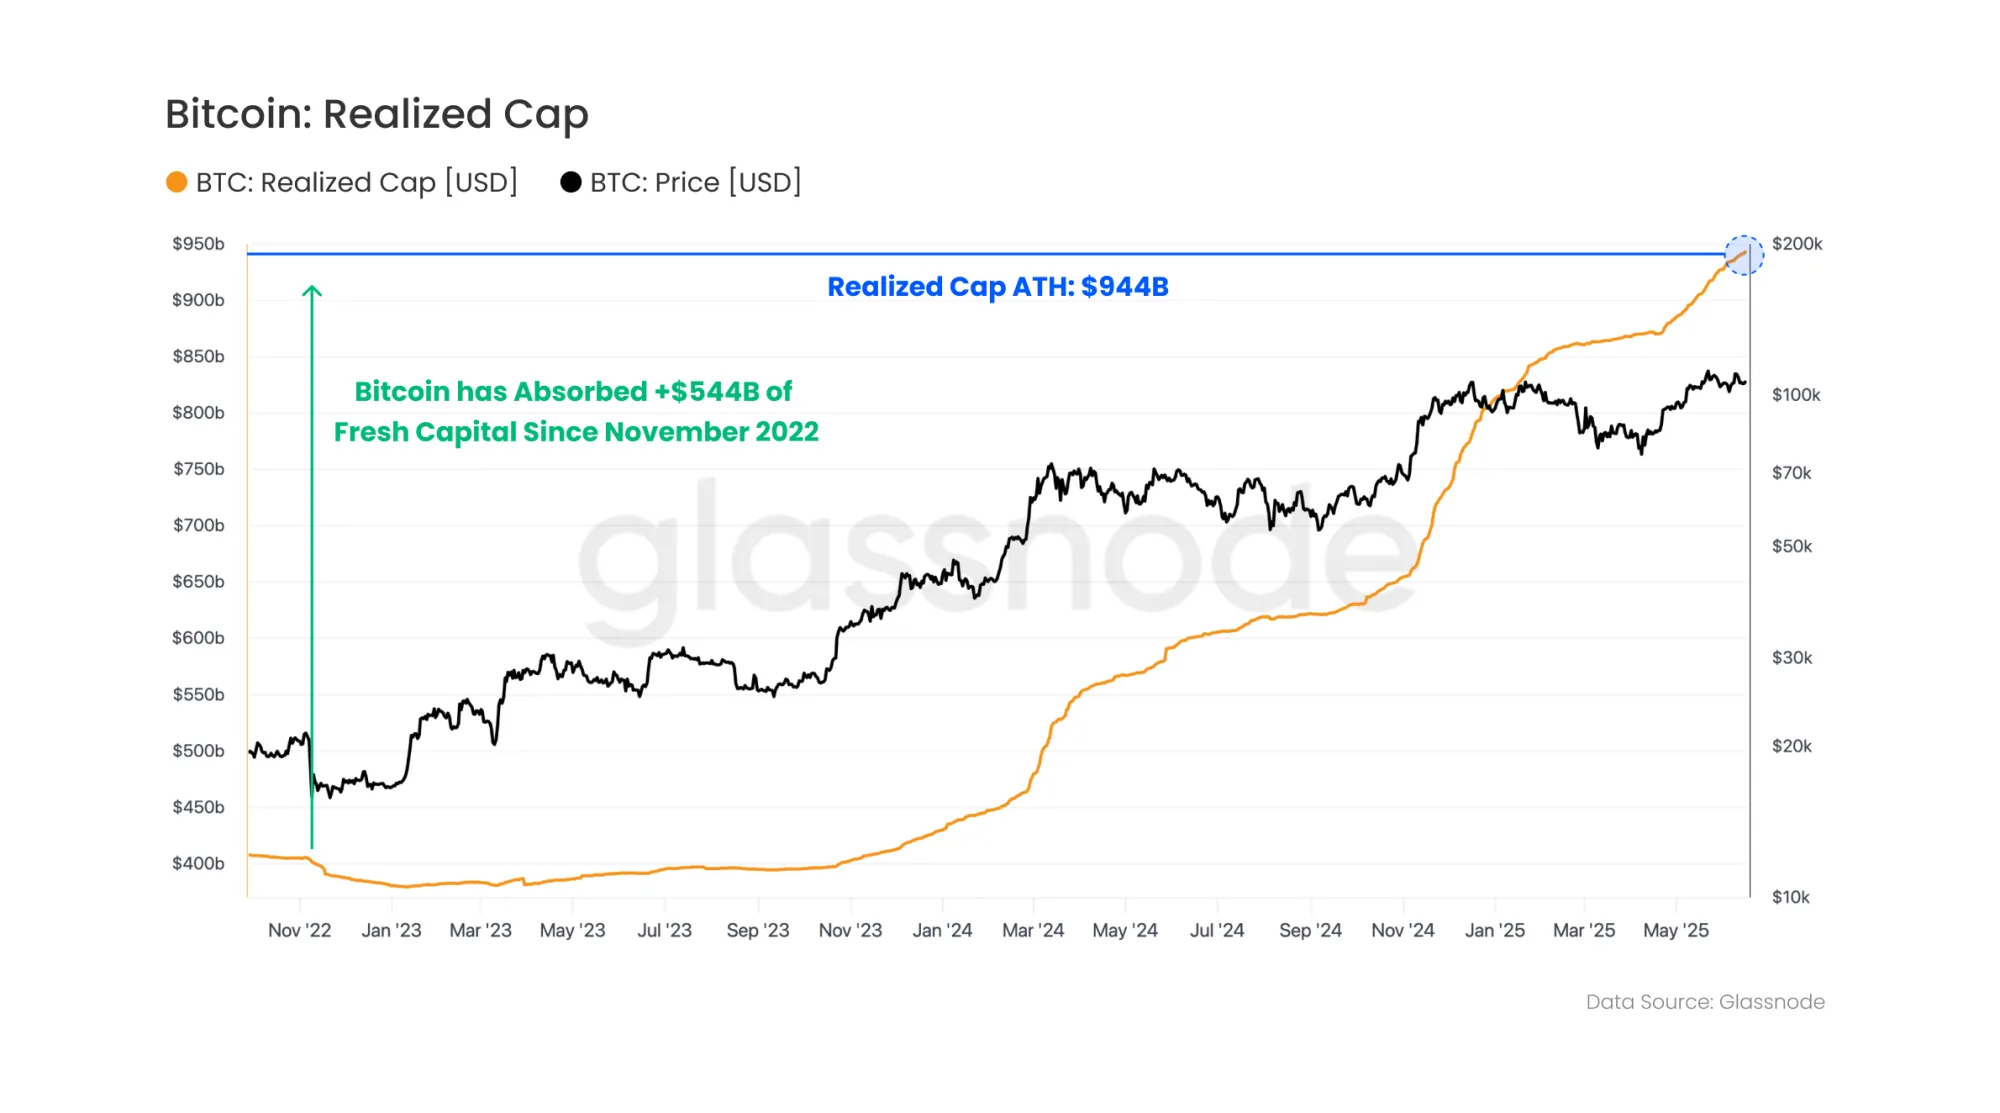
Realized Cap has surged by over $544B since November 2022, pushing Bitcoin’s network liquidity to an all-time high of $944B. As institutional and sovereign adoption accelerate, on-chain data shows that Bitcoin’s role in the global financial system is expanding - mirroring broader macro liquidity trends.

Off-Chain Market Microstructure: ETFs, Order Books, and Derivatives

Perhaps the most underexplored layer of Bitcoin market analysis is the off-chain microstructure: the mechanics of how trades execute across spot and derivative venues, and how institutional access vehicles such as ETFs influence flows.
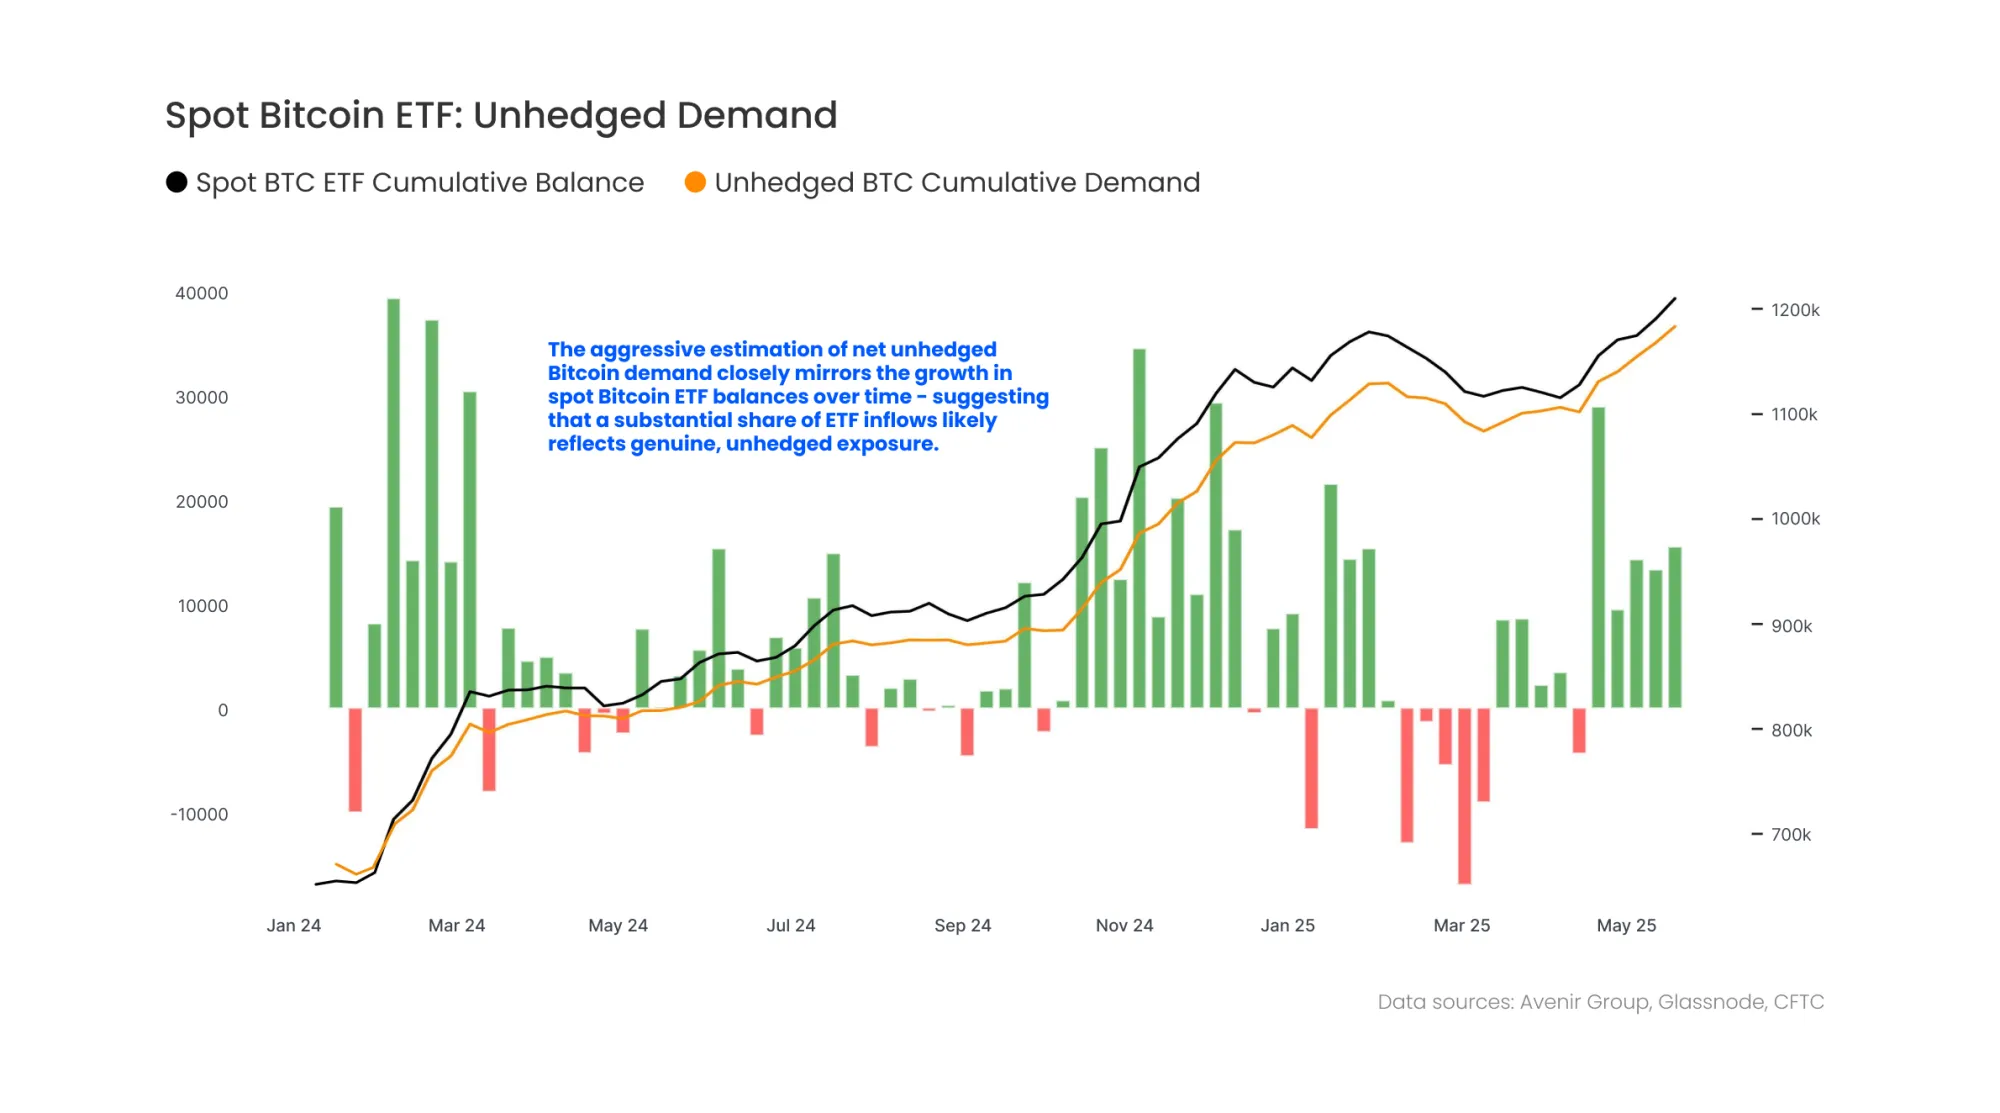
One of the most significant findings in the report is that the majority of inflows into U.S.-listed spot Bitcoin ETFs appear to be unhedged. This suggests that institutional allocators are using these vehicles not for arbitrage or basis trading - but to express directional, long-only exposure. As a result, ETF flows may exert a more lasting effect on price formation than initially assumed.
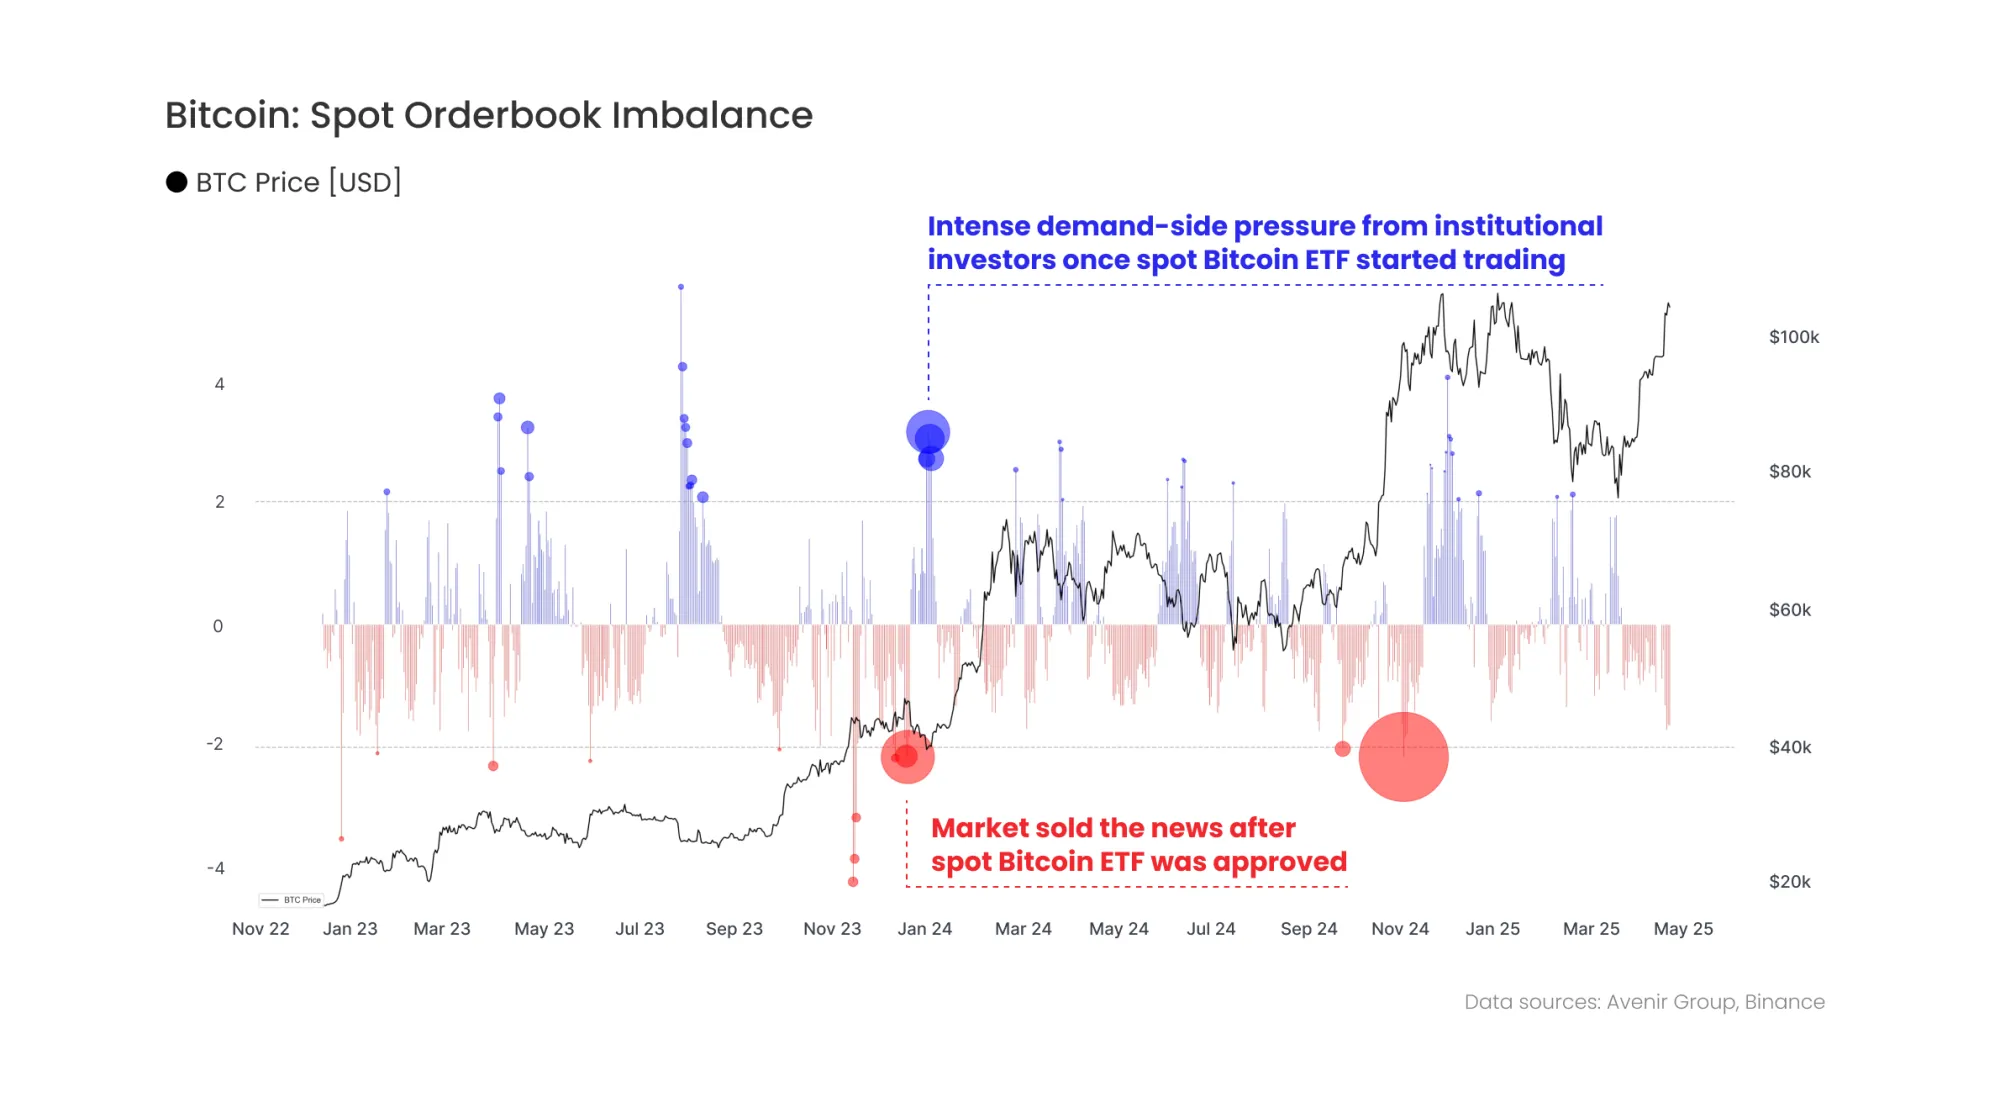
In addition, order book imbalance analysis using z-scores reveals persistent structural dislocations between bids and asks, which can act as early indicators of directional shifts. These imbalances tend to emerge well before trend reversals, offering a tool for more granular risk assessment.

Macro Linkages: Bitcoin Aligns with Global Liquidity and Risk Cycles

Bitcoin's behavior in 2025 shows increasing alignment with macroeconomic variables. Correlation and beta analysis in the report demonstrates that Bitcoin now exhibits:

  • A positive beta to global liquidity
  • A positive correlation to risk assets like equities
  • A negative correlation to the U.S. dollar and credit stress indicators
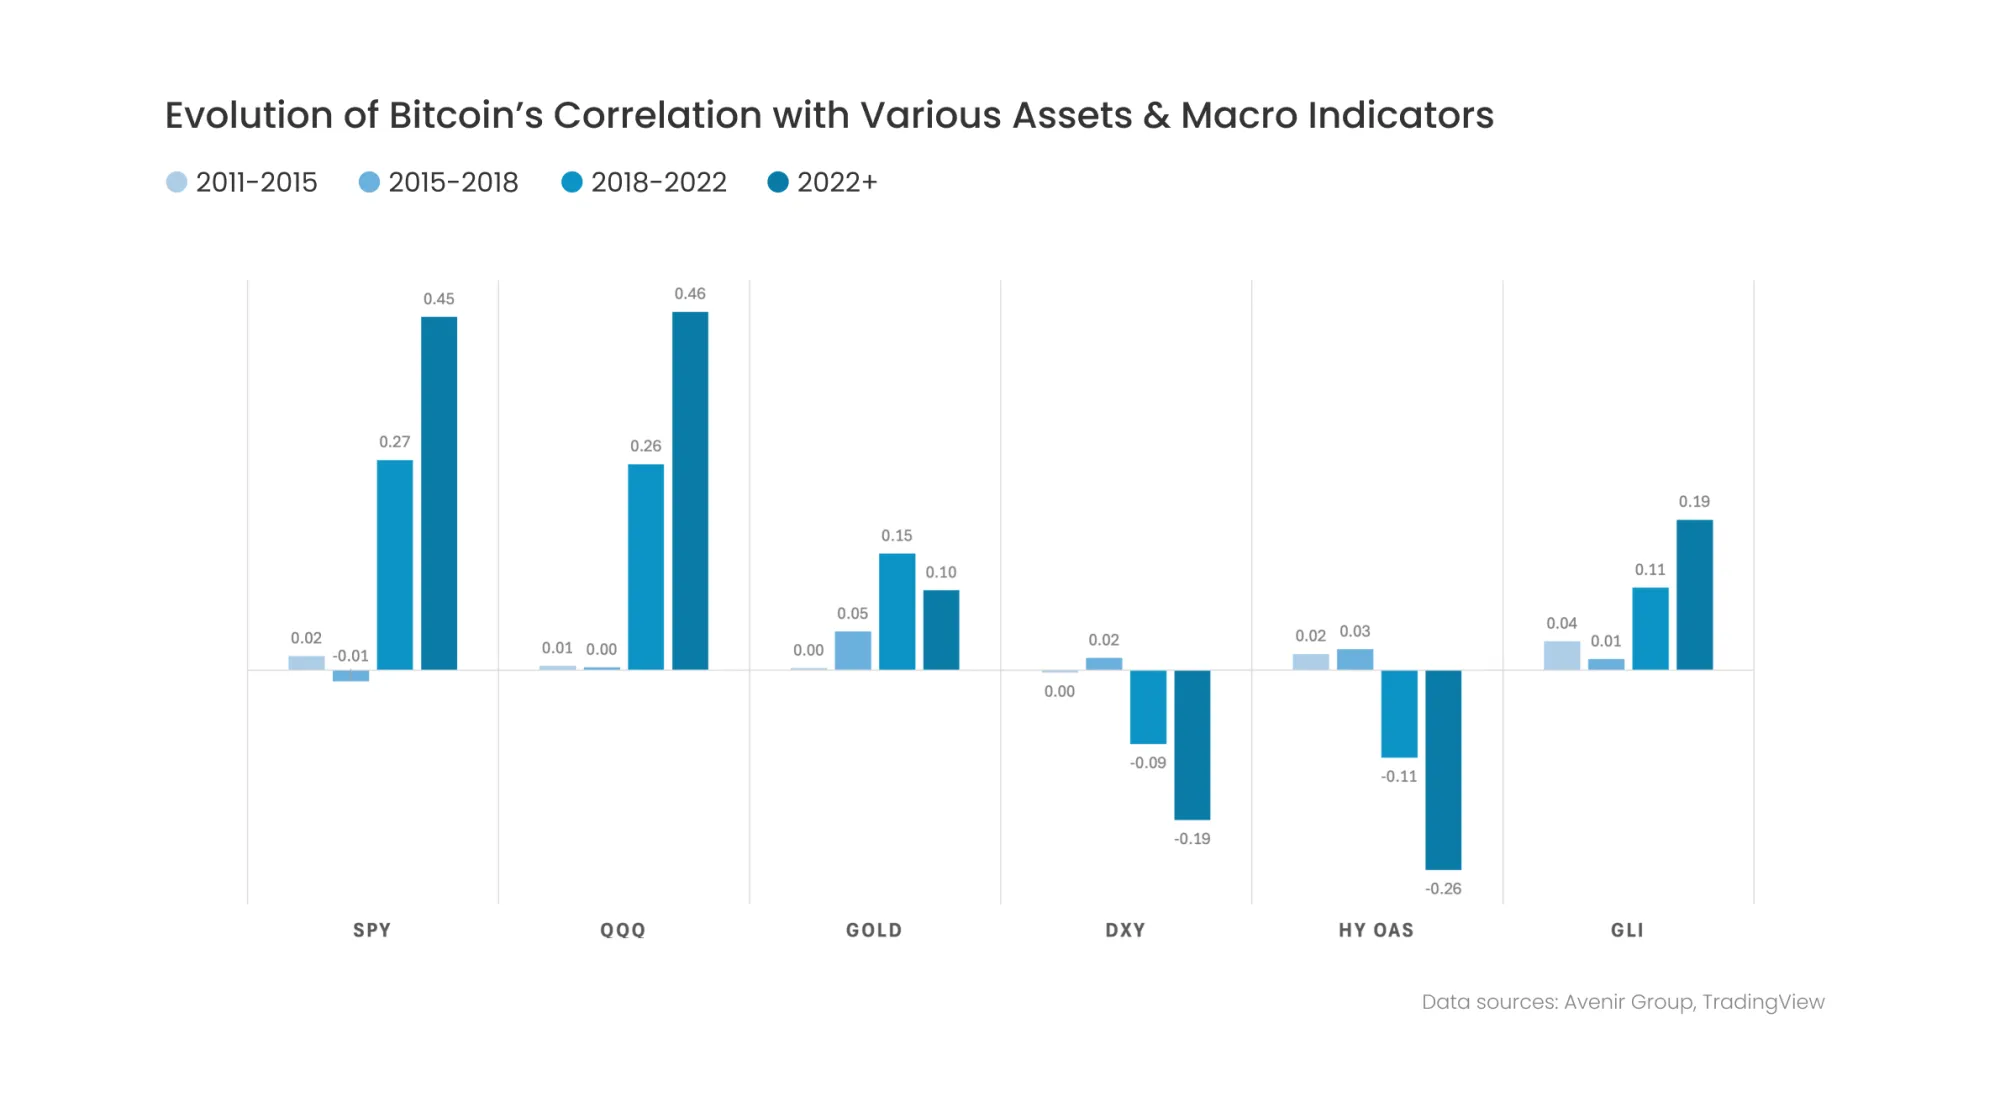
This represents a shift from Bitcoin’s earlier, more idiosyncratic phase, and places it in the same analytical domain as traditional macro assets. Volatility clustering also supports this observation: Bitcoin’s realized volatility now more closely mirrors equities and gold than commodities or FX.

Discover more in the full report

This Avenir x Glassnode report delivers a thorough institutional assessment of Bitcoin’s evolving liquidity profile. Inside, you'll uncover:

  • On-chain indicators of capital inflows and profit-taking regimes
  • Exchange-level data, derivatives trends, and limit order book analysis
  • Altcoin market fragmentation and liquidity divergence
  • Correlations between Bitcoin and traditional macro indicators
  • A framework for interpreting Bitcoin as a structurally maturing macro asset

To explore these dynamics in detail, including chart data and methodology, access the full report here.

Glassnode remains committed to providing the highest quality data and analysis to support institutional investors in the world of digital assets. Contact us for bespoke reports, data services, and more. For more reports on the current trends in the crypto markets, please visit Glassnode Insights.


Trending Cryptos

Related Reads

Collateral Dollars: How Does a 'Second-Layer Dollar' Above Stablecoins Form?

Collateral Dollars: How Does a "Second Layer of Dollars" Form on Top of Stablecoins? Most assume stablecoins replicate Eurodollar functions, expanding the offshore dollar system. However, stablecoins primarily replace specific functions like operational dollar balances for settlement. They do not inherently create new dollar credit; they substitute existing claims. The key question is: what happens when financial intermediaries use stablecoins as collateral to create a new layer of dollar-denominated claims? This "collateral dollar" channel operates through secured lending, not direct money creation. A money-like event only occurs when a liability issued against the controlled stablecoin is funded, rolled over, or accepted at near-par value by another balance sheet. The discount (haircut) prices the gap between "effective control over the token" and "reliable convertibility to bank dollars." Elasticity stems not from the stablecoin itself but from the liability issued against it and the willingness of third-party balance sheets to treat that liability as a near-par asset. Compared to the traditional Eurodollar system—where elasticity originates from bank deposit creation—the stablecoin collateral chain is structurally different. Eurodollar deposits are credit-expansive from inception. Stablecoins are initially substitutive; elasticity emerges later if an intermediary's liability against them gains monetary acceptance. Stablecoins disrupt specific tiers of the offshore dollar system, mainly replacing operational settlement balances. They do not replace the need for full dollar balance-sheet capacity (credit lines, hedging, maturity transformation). For systemic impact, the second-layer liability must pass three tests: transferability, funding capacity, and monetary acceptance (being fundable or held at par by others). Pressure transmission also differs. In the Eurodollar system, stress moves up a hierarchy of claims. In a stablecoin collateral chain, the second-layer liability can lose its money-like status well before the underlying stablecoin faces a run, often triggered by haircut increases and margin calls that create a dynamic spiral of falling token prices and rising discounts. In conclusion, the "collateral dollar" is not the stablecoin itself. It is the second-layer liability issued against a controlled token balance that is willing to be funded and maintained at near-par value. Its existence depends on that liability surviving the leap from "token liquidity" to "bank dollar liquidity."

marsbit46m ago

Collateral Dollars: How Does a 'Second-Layer Dollar' Above Stablecoins Form?

marsbit46m ago

Collateral Dollars: How the 'Second-Layer Dollar' Above Stablecoins Takes Shape?

"Collateralized Dollars: How a 'Second Layer of Dollars' Forms on Top of Stablecoins" Most assume stablecoins replicate Eurodollars and expand the offshore dollar system, but this is not accurate. Stablecoins primarily replace certain functions within the existing system, especially operational dollar balances for daily settlement. The critical question is what happens when financial intermediaries create a new layer of dollar claims *on top of* stablecoins. This article explains how this new collateralized funding channel works. Stablecoins introduce tokenized private dollar claims. Even if issuers and reserves are within the US legal perimeter, their circulation and use as collateral can become economically "offshore." Enforceable control over collateral opens a secured credit channel but does not itself create a monetary claim. A true monetary event occurs only when another balance sheet funds, rolls over, or accepts a liability issued against the controlled token at near-par value. The discount prices the gap between "effective control over the token" and "reliable convertibility into bank dollars." Elasticity comes from the balance sheet issuing the liability against the token and from third-party willingness to treat that liability as a near-par asset. Collateralized Dollars are not the stablecoins themselves; they are the second-layer liability that another balance sheet is willing to issue, fund, and maintain at near-par against a controlled token balance. The Eurodollar system is a hierarchy of claims, with elasticity originating in expandable bank liabilities. In contrast, the stablecoin collateral chain starts with a tokenized asset. It gains systemic significance only when an intermediary's liability against that token is treated as money-like by other balance sheets. Key determining factors include: who has effective control, the legal/operational path to bank dollars, and whether the resulting claim can still be financed near-par under stress. Pressure in this new channel manifests differently. The upper-layer (intermediary) claim fails first, losing its money-like status, potentially while the underlying stablecoin remains solvent. Increased haircuts and forced sales can create a destructive feedback loop, widening the very gap the discount measures. In conclusion, the Eurodollar analogy has limits. Reserve quality supports the underlying token's solvency, but the leverage, credit, and liabilities built atop it face a separate test. Collateral eligibility is not monetary acceptance. Only when a claim built on stablecoins survives the leap from "token liquidity" to "bank dollar liquidity" do Collateralized Dollars truly exist.

链捕手52m ago

Collateral Dollars: How the 'Second-Layer Dollar' Above Stablecoins Takes Shape?

链捕手52m ago

Don't Be Misled by the $1.25 Billion Cap: MicroStrategy's Three-Pronged Bitcoin Sale Pools Hide Massive Selling Pressure

Don't Be Misled by the $1.25B Cap: Strategy's Three-Tier Bitcoin Sales Plan Hides Massive Potential Selling Pressure Strategy recently sold 3,588 BTC (~$216M) to fund a dividend and replenish its dollar reserve, while claiming its $1.25B "reserve build" capacity remains fully available. This highlights a key nuance: the widely cited $1.25B limit applies only to sales for "Building" the reserve. Strategy's broader capital framework, however, allows Bitcoin sales for three primary purposes, each with different scales: 1. **Building the Reserve:** Selling BTC to raise up to $1.25B for the reserve. 2. **Covering Priority Share Expenses:** Selling BTC to pay dividends/interest or to replenish the reserve after such payments are made from it (no specified limit). 3. **Share Repurchase Funding:** Selling BTC to fund up to $1B each in convertible note and common stock repurchases (totaling $2B potential). Combined, just the capped "Build" and "Repurchase" channels could facilitate over $3B in Bitcoin sales, excluding the uncapped "Cover Expenses" channel. The accounting distinction between "Building" (adding cash before a payout) and "Replenishing" (adding cash after a payout) is operationally blurry but allows sales like the recent $216M transaction without touching the $1.25B "Build" quota. This gives Strategy significant flexibility. The move signifies a strategic shift: Strategy is transforming from a simple Bitcoin accumulator into an active capital manager, akin to a hedge fund. Bitcoin is now a financial lever to balance pressures between common stock, convertible notes, dollar reserves, and Bitcoin holdings. This creates inherent tensions—actions benefiting one part of the capital structure may harm another. Investors must understand that the potential Bitcoin sales are far greater than the surface-level $1.25B figure. Strategy has become a complex financial entity where every term in its disclosures matters. Betting on it now is a wager on its active capital management skill to navigate these internal contradictions without a systemic failure.

Foresight News59m ago

Don't Be Misled by the $1.25 Billion Cap: MicroStrategy's Three-Pronged Bitcoin Sale Pools Hide Massive Selling Pressure

Foresight News59m ago

Trading

Spot

Hot Articles

Discussions

Welcome to the HTX Community. Here, you can stay informed about the latest platform developments and gain access to professional market insights. Users' opinions on the price of S (S) are presented below.

活动图片