Executive Summary
- The Bitcoin market continues to consolidate within the $76k to $87k range, with the Realized Profit/Loss Ratio starting to show signs of near-term seller exhaustion but not yet a renewal of sustained bullish momentum.
- A longer-term view reveals a deterioration of investor profitability, and an on-chain ‘Death-Cross’ has occurred, suggesting the market may remain weak for the foreseeable future.
- Supply in loss remains elevated at 4.7M BTC, while the behavior of coins held in-loss is signalling moderate investor stress. Together, these metrics build a picture of deepening bearish conditions.
- Ripple’s XRP network recently experienced a +490% spike in address activity and a near-doubling of Realized Cap, signalling aggressive retail interest. However, profitability has rapidly faded, suggesting retail interest may be increasingly fragile.
Short-Term Relief
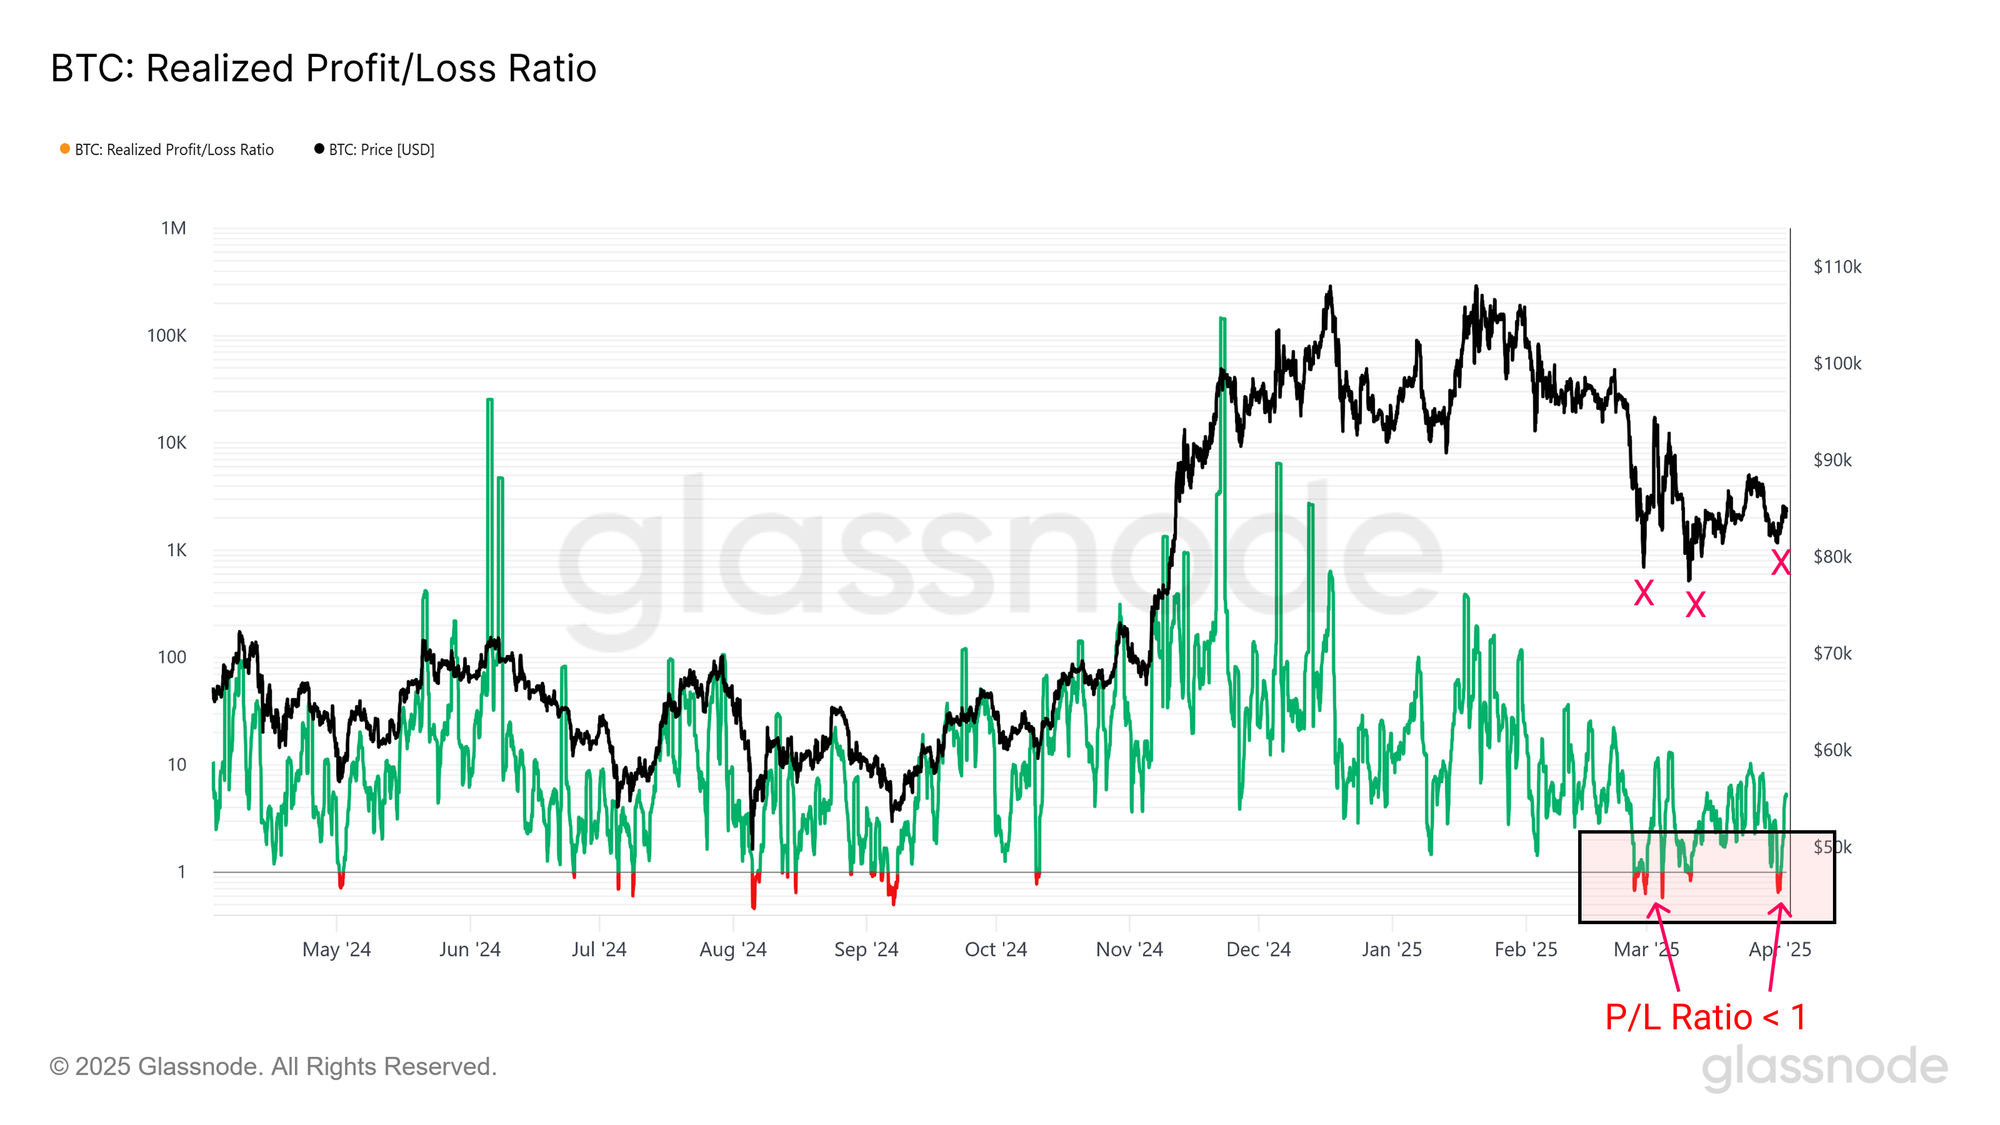
Recent weeks in digital asset markets have been defined by a steady downtrend, with Bitcoin prices trading -30% below the ATH. During this correction, the $76k to $85k zone has emerged as a critical area of interest, with the market trading in this range since late February. Each sell-off towards the range lows has been met with a swift recovery, suggesting the presence of strong reactive demand has shown up whenever prices trade below $80k.
To better understand these dynamics, we turn to the Realized Profit/Loss Ratio — a metric that compares the USD volume of realized profits versus losses. When this ratio falls below 1.0, it signals that more capital is being locked in a loss than a profit. These retests of the 1.0 level often coincide with local capitulation events and short-term price reversals.
Most notably, each dip into the $76k to $80k range has coincided with a P/L Ratio dipping below 1.0, highlighting episodes where losses outweighed profits. This imbalance typically marks a degree of seller exhaustion, where downside momentum fades as sell-side pressure is absorbed.
The resulting rebound appears as relief rallies, but we have not yet seen signs of renewed and sustained strength, reflecting a market which is still processing the emotional and financial hangover of the $109k ATH peak.
Zooming Out
Although short-term seller exhaustion can provide momentary relief, a deeper question emerges: Are these rebounds signs of a larger bullish impulse, or simply reactive bounces within a broader downtrend?
While some market participants may speculate that repeated bounce-backs from the $76k–$80k range could eventually rally toward new all-time highs, a longer-term perspective is necessary to gauge the sustainability of such momentum.
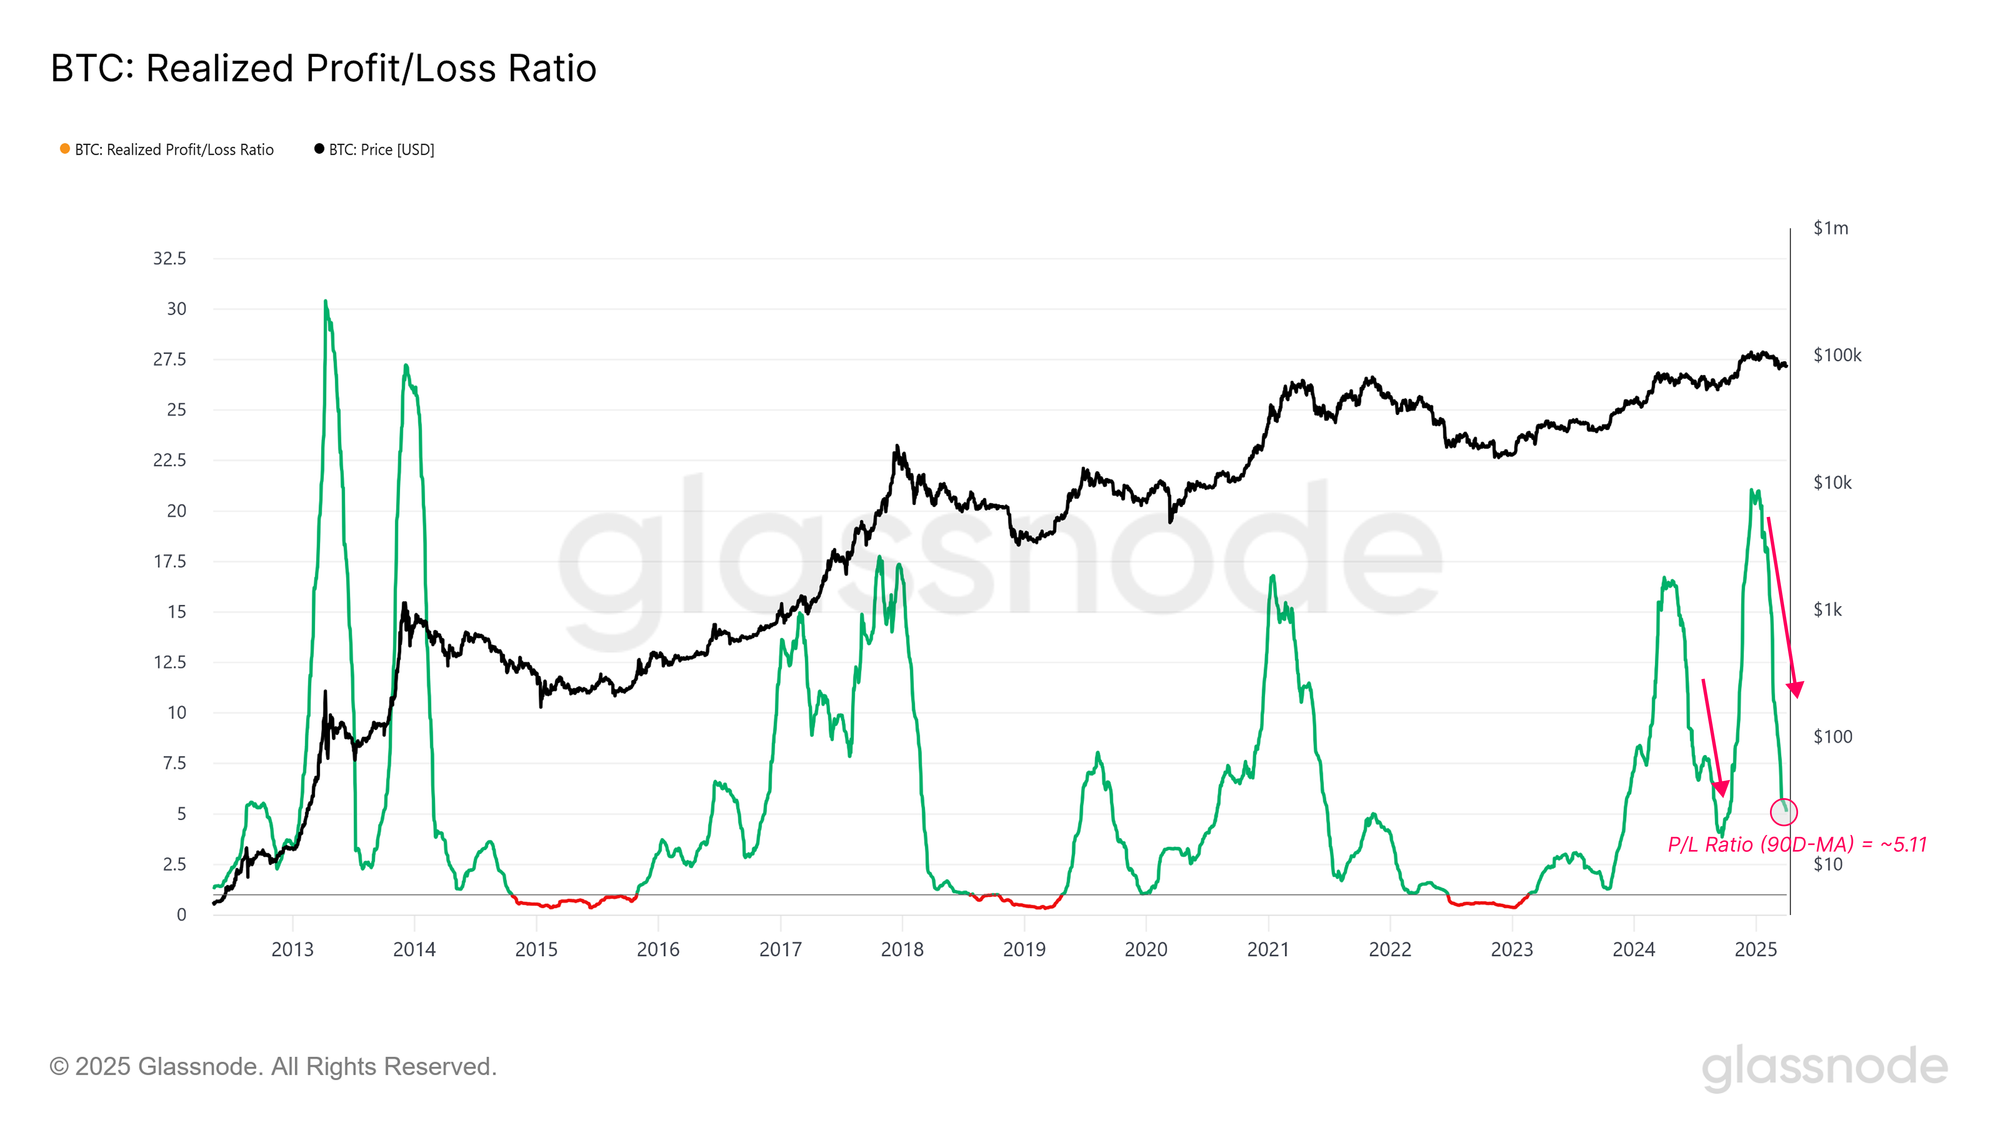
The Realized Profit/Loss Ratio, is traditionally shown in logarithmic scale due to its volatility and wide range. To provide a clearer view of broader market dynamics, we have plotted a 90-day simple moving average to the metric on a linear scale. This smoothed presentation helps filter out the daily noise and highlights prevailing trends in spending profitability.
From this vantage point, the longer-term momentum has declined markedly since early January, despite the recent short-term spikes seen on the raw daily resolution. These brief profit-driven surges have failed to reverse the broader downtrend, suggesting that the macro picture remains one of generally weaker liquidity and deteriorating investor profitability.
So far, there is little evidence suggesting a structural bullish shift in momentum is underway.
An On-Chain Death Cross
With profitability trending lower, it’s logical to turn our attention to price momentum as a core driver behind investors locking in both profit and loss.
Traditionally, technical analysts identify major shifts in momentum when a “Death Cross” occurs, indicating where the 50-day moving average drops below the 200-day. This event often signals a weakening trend.
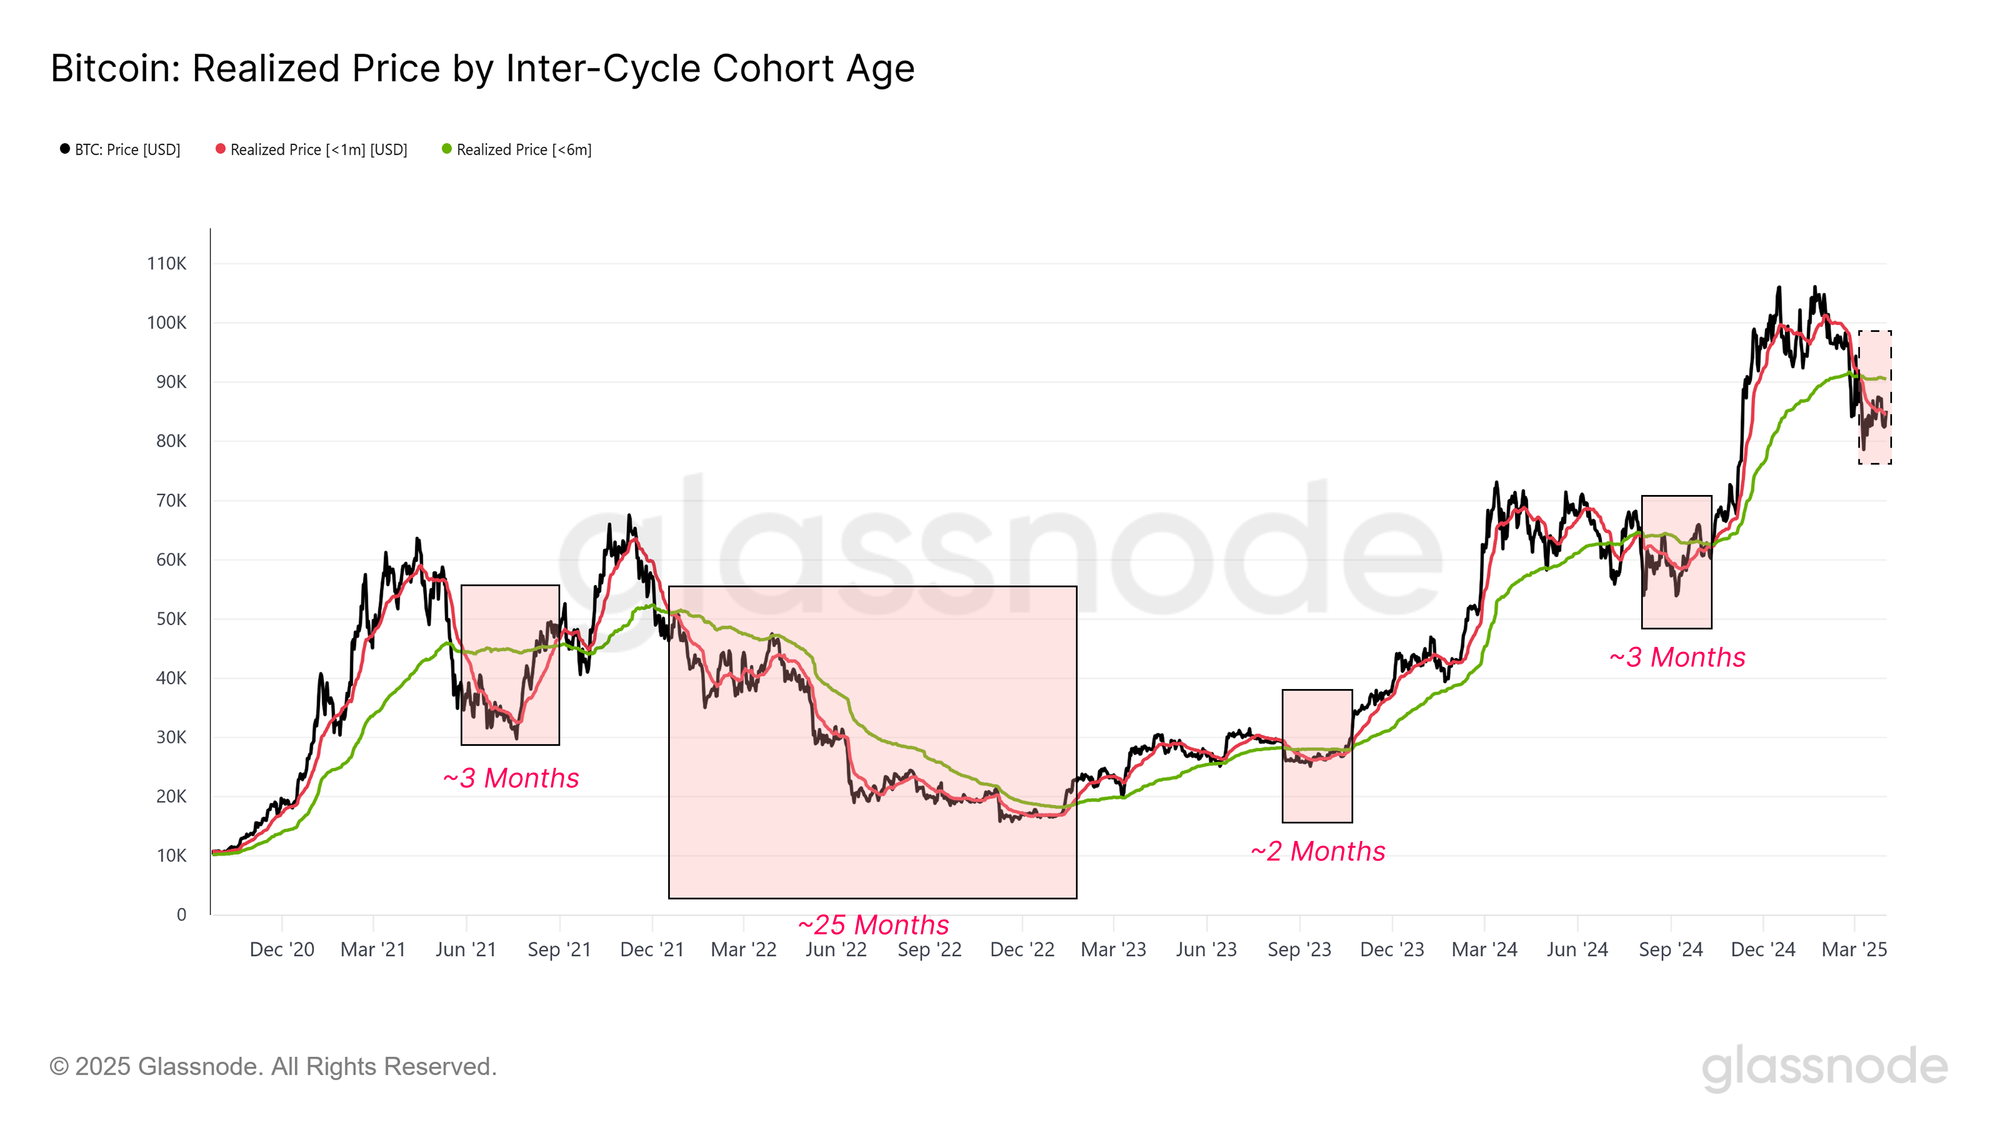
To bring this concept into the on-chain domain, we construct an analogue using on-chain volume-weighted prices for coins moved in the last 1 month, compared to the last 6 months. This method directly reflects market sentiment by factoring in both when and how much capital actually moves on-chain.
The recent crossover of the short-term 1-month average below the long-term 6-month price could be considered to mark an on-chain Death Cross. This pattern has historically preceded 3–6 month-long bearish trends. If this cycle follows suit, it suggests the market may still be working through a period of weakness before the bulls can reestablish a robust uptrend.
Bear Market Depth
Following signs of weakening momentum and shrinking profitability, the current market structure ticks nearly many of the boxes we look at for a typical bear market phase. The current market is characterized by tighter liquidity conditions, negative sentiment and momentum, and investor behaviour increasingly moving toward loss-taking events.
In such environments, investor psychology is dominated by fear and emotional fatigue. Historically, the most extreme bearish phases tend to culminate with a capitulation event, often setting the stage for bottom formation and an eventual recovery.
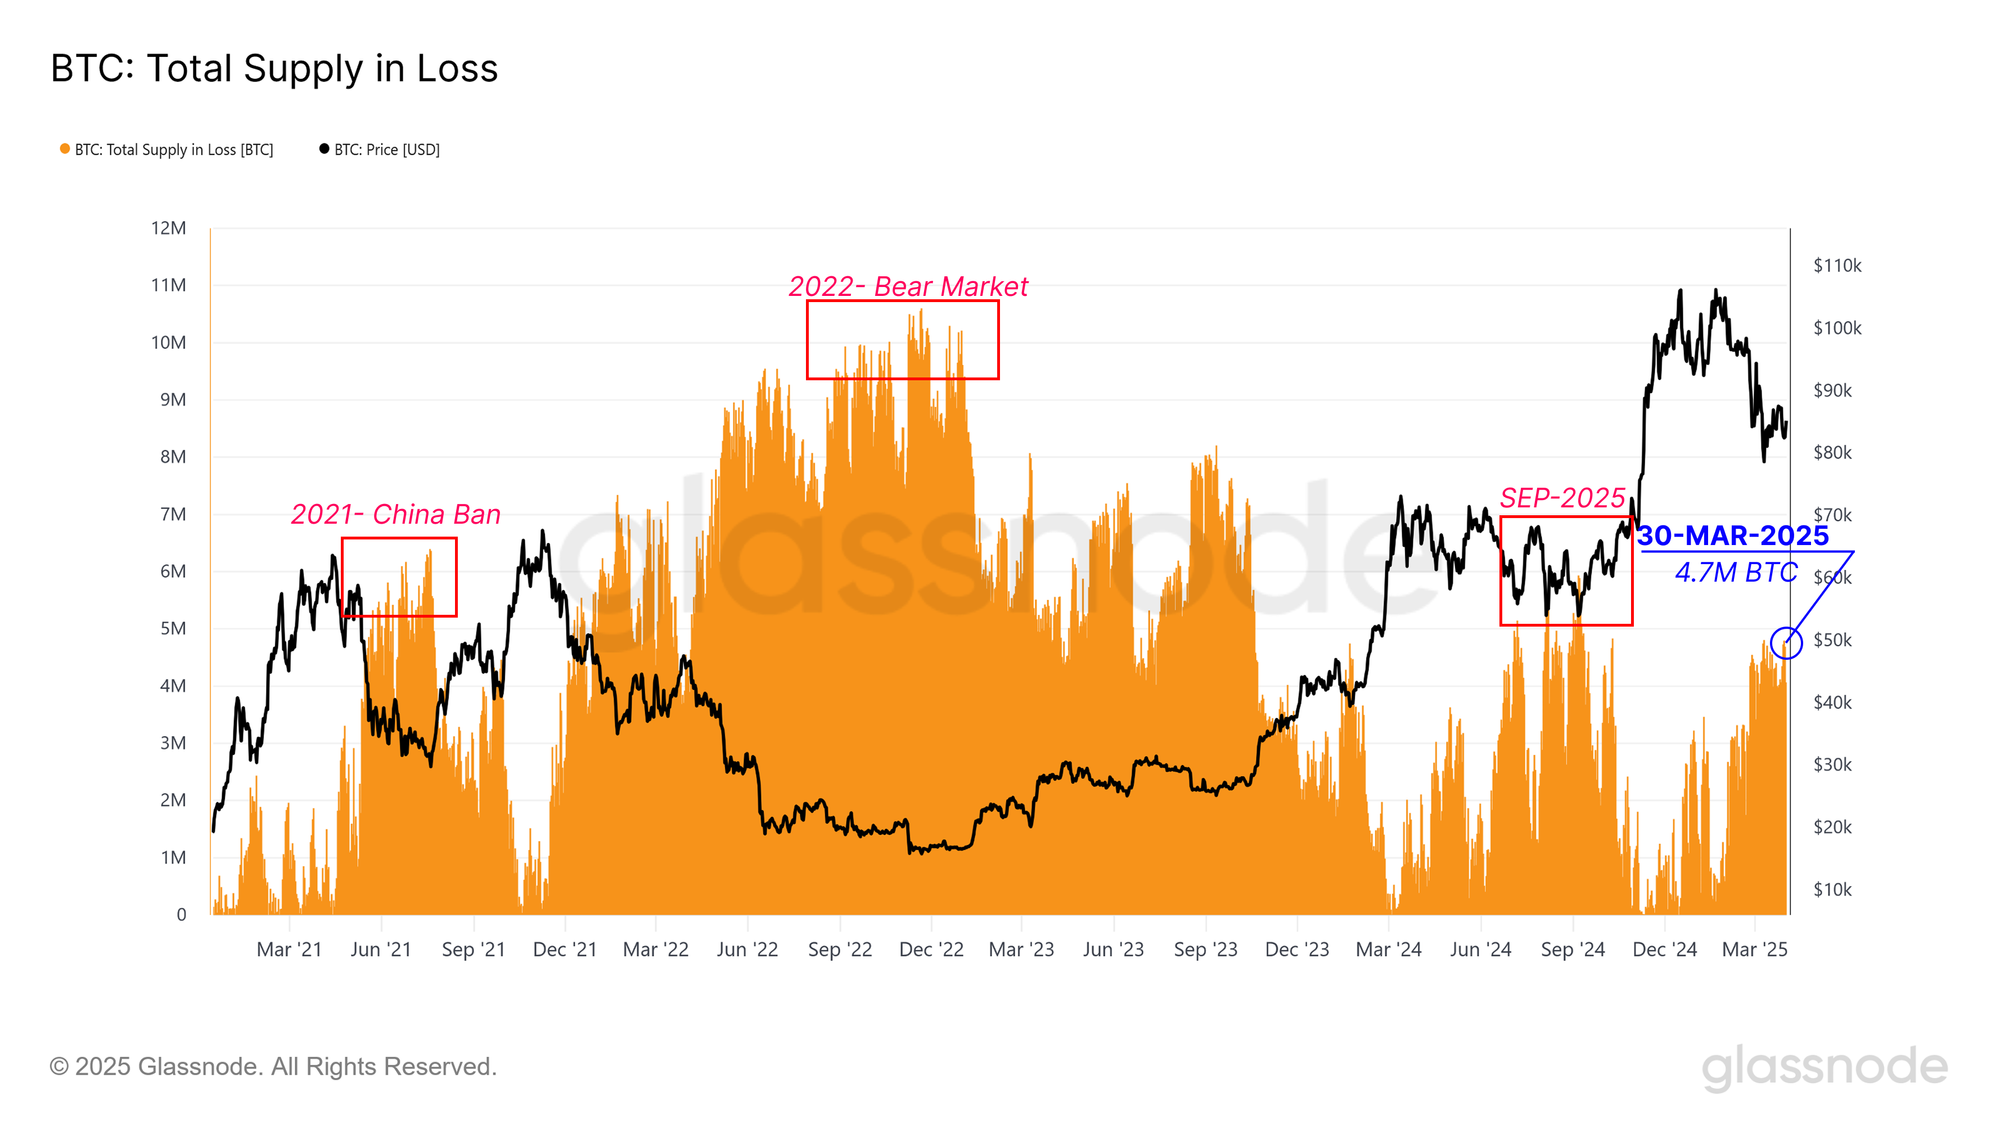
A comprehensive analysis of bearish markets involves two key dimensions: loss dominance and loss intensity. Loss dominance is captured by the Total Supply held in Loss, which tracks the volume of coins held below their on-chain acquisition price. On March 30, 4.7M BTC were held below their cost basis, which is an elevated level, though still below extremes seen in mid-2021, the 2022 bear market, and during the September 2024 drawdown.
Sizing up these losses helps frame where we are in the cycle and whether the market is deep in despair, nearing exhaustion, or may still have more pain to endure.
Measuring Loss Intensity
Building on our view of loss dominance, the second dimension of investor stress is loss intensity, which captures how far below the cost basis investor holdings are. To assess this, we turn to the Market Value to Realized Value (MVRV) ratio, a metric that compares the spot price to the average cost basis of all coins in the supply.
To isolate the experience of underwater investors, we can focus specifically on the MVRV of supply held in loss. We can construct this metric by dividing the total USD-denominated unrealized loss held by the market by the number of coins contributing to it.
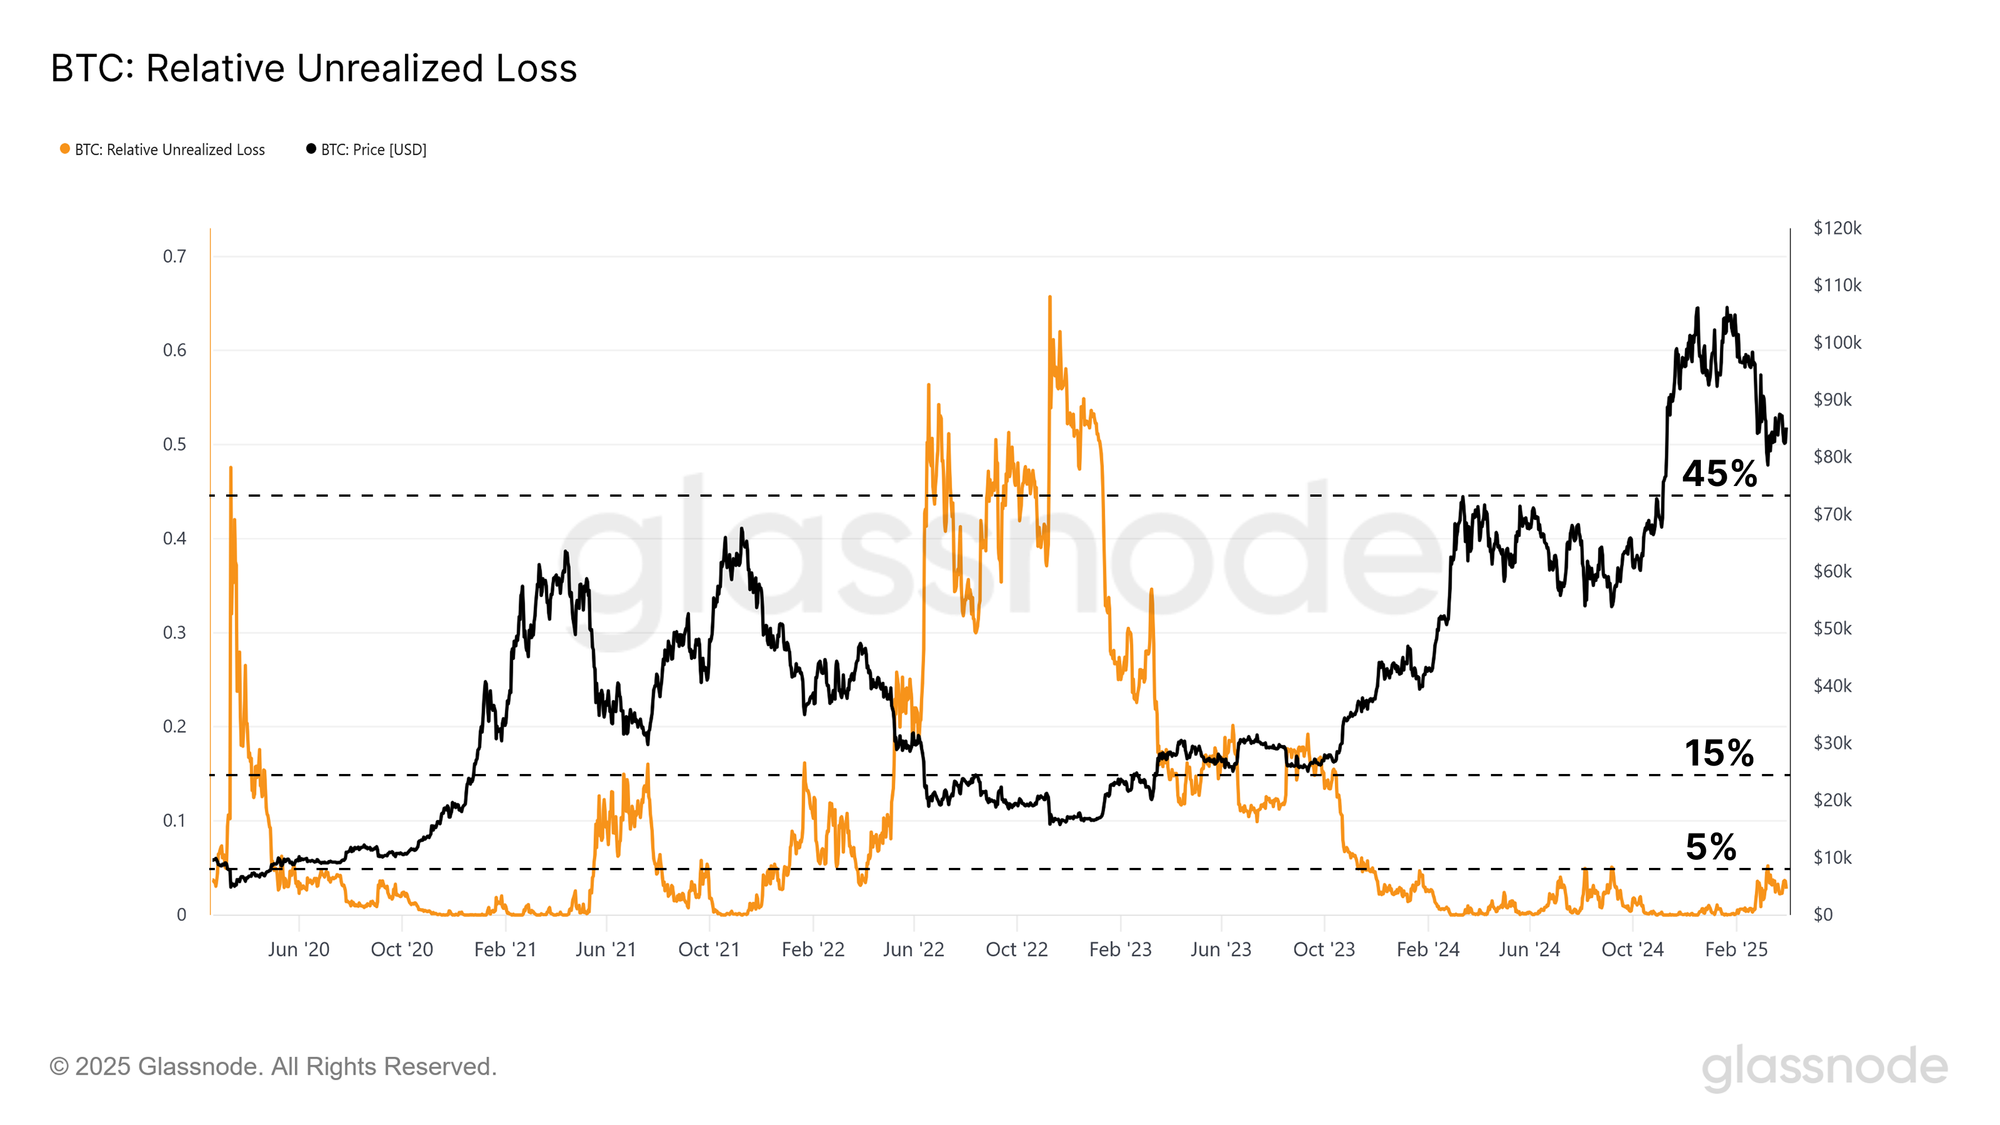
The Relative unrealized loss, which expresses the proportion of the market cap that is underwater, is currently at 2%. This is notably lower in magnitude than what we have seen in previous bear markets, such as in 2022. By this measure, whilst the number of coins held in loss is substantial, the magnitude of the unrealized losses they carry is not.
From this, we can compute the average cost basis of coins in loss using the following formula:

The realized price for the supply in loss is at $96.7k, which means, on average, the average underwater coin is holding an unrealized loss of -12%.
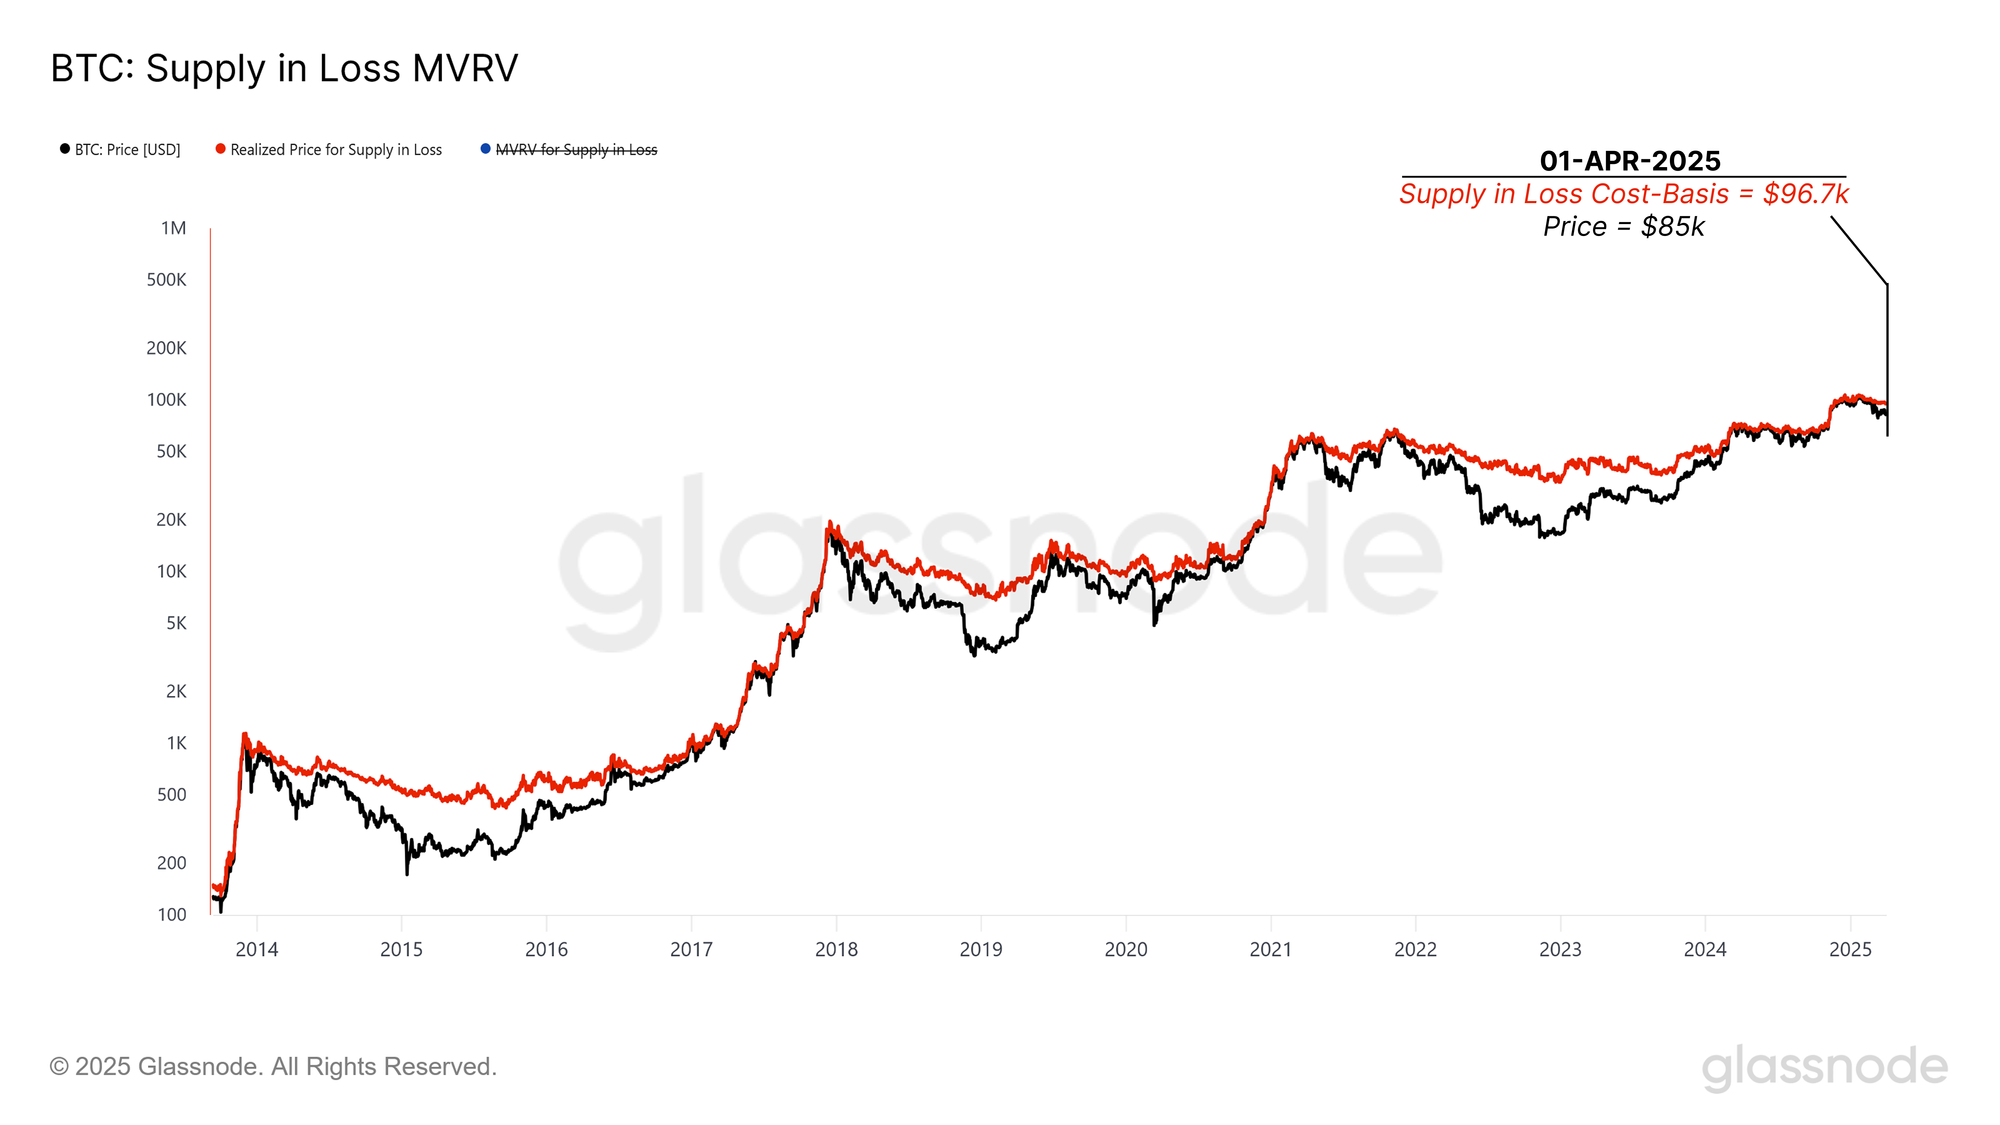
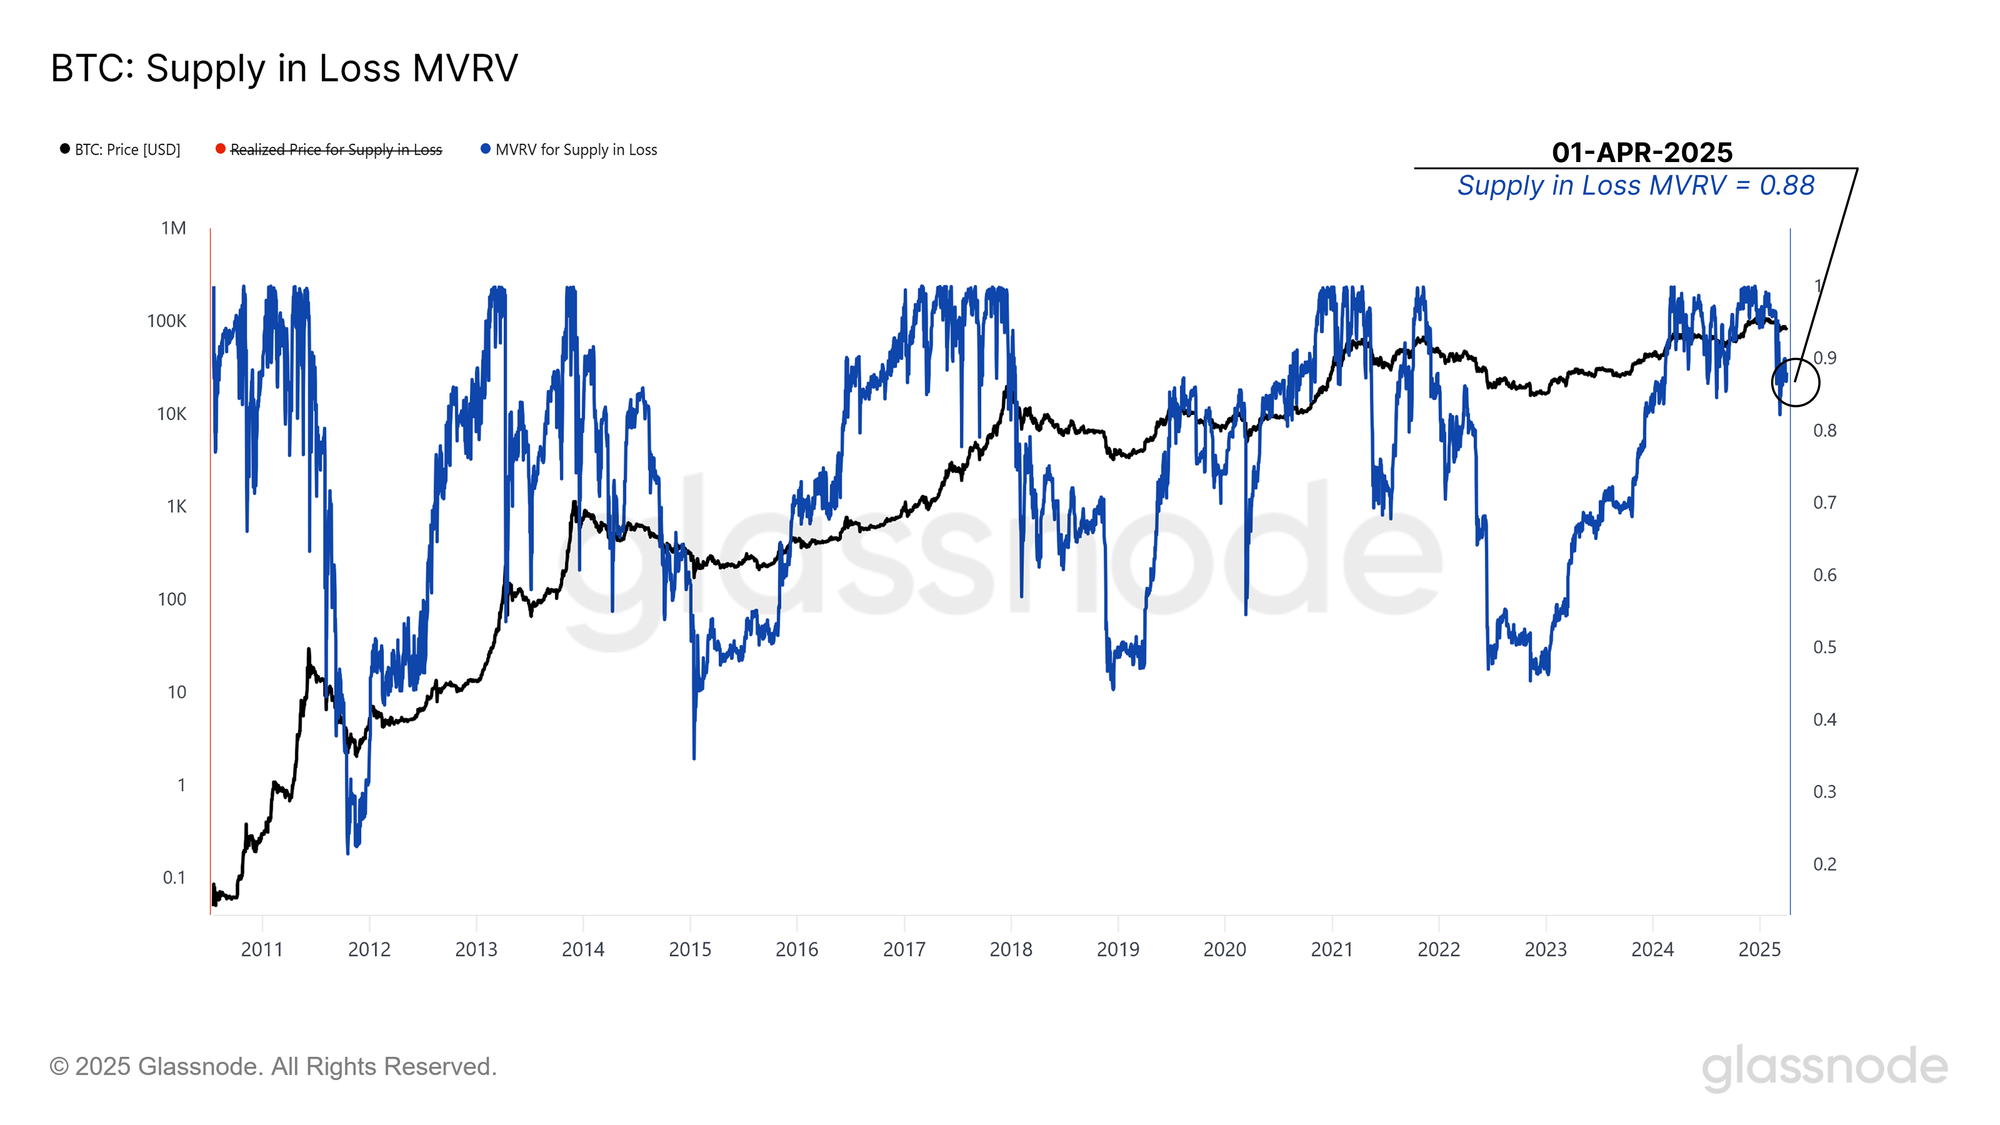
This Supply in-Loss Realized Price then serves as the denominator for constructing an MVRV ratio for these coins, creating an oscillator to compare how far underwater the average loss-holding investors are. We can then use this metric to compare across previous cycles and use this as an input for identifying how deep the investor distress is and whether there are any early signs of recovery.
The Supply in-Loss MVRV dropped sharply when the price broke below $93k and is now trading at 0.88, indicating a moderate degree of loss and stress within the market. This is one of the lowest levels of this MVRV for this cycle, although it is again not at the deeply low levels seen in prior bear markets.
Overall, there are many signs of weakness for Bitcoin investors. However, we should note that the magnitude of this weakness across several dimensions is not yet at the depth and severity of some of the more brutal downtrends Bitcoin has experienced in the past.

Rippling Away
As Bitcoin investors grapple with deepening losses, a contrasting trend emerges in more retail-driven corners of the market. One defining feature of this cycle has been the rise of institutional demand via U.S. spot ETFs, with a lot of retail participation and speculation pulled toward alternative digital assets.
For this cycle in particular, Ripple (XRP) has been a preferred asset for trade amongst retail investors, and studying its behavior can therefore serve as a proxy for measuring retail speculative demand.
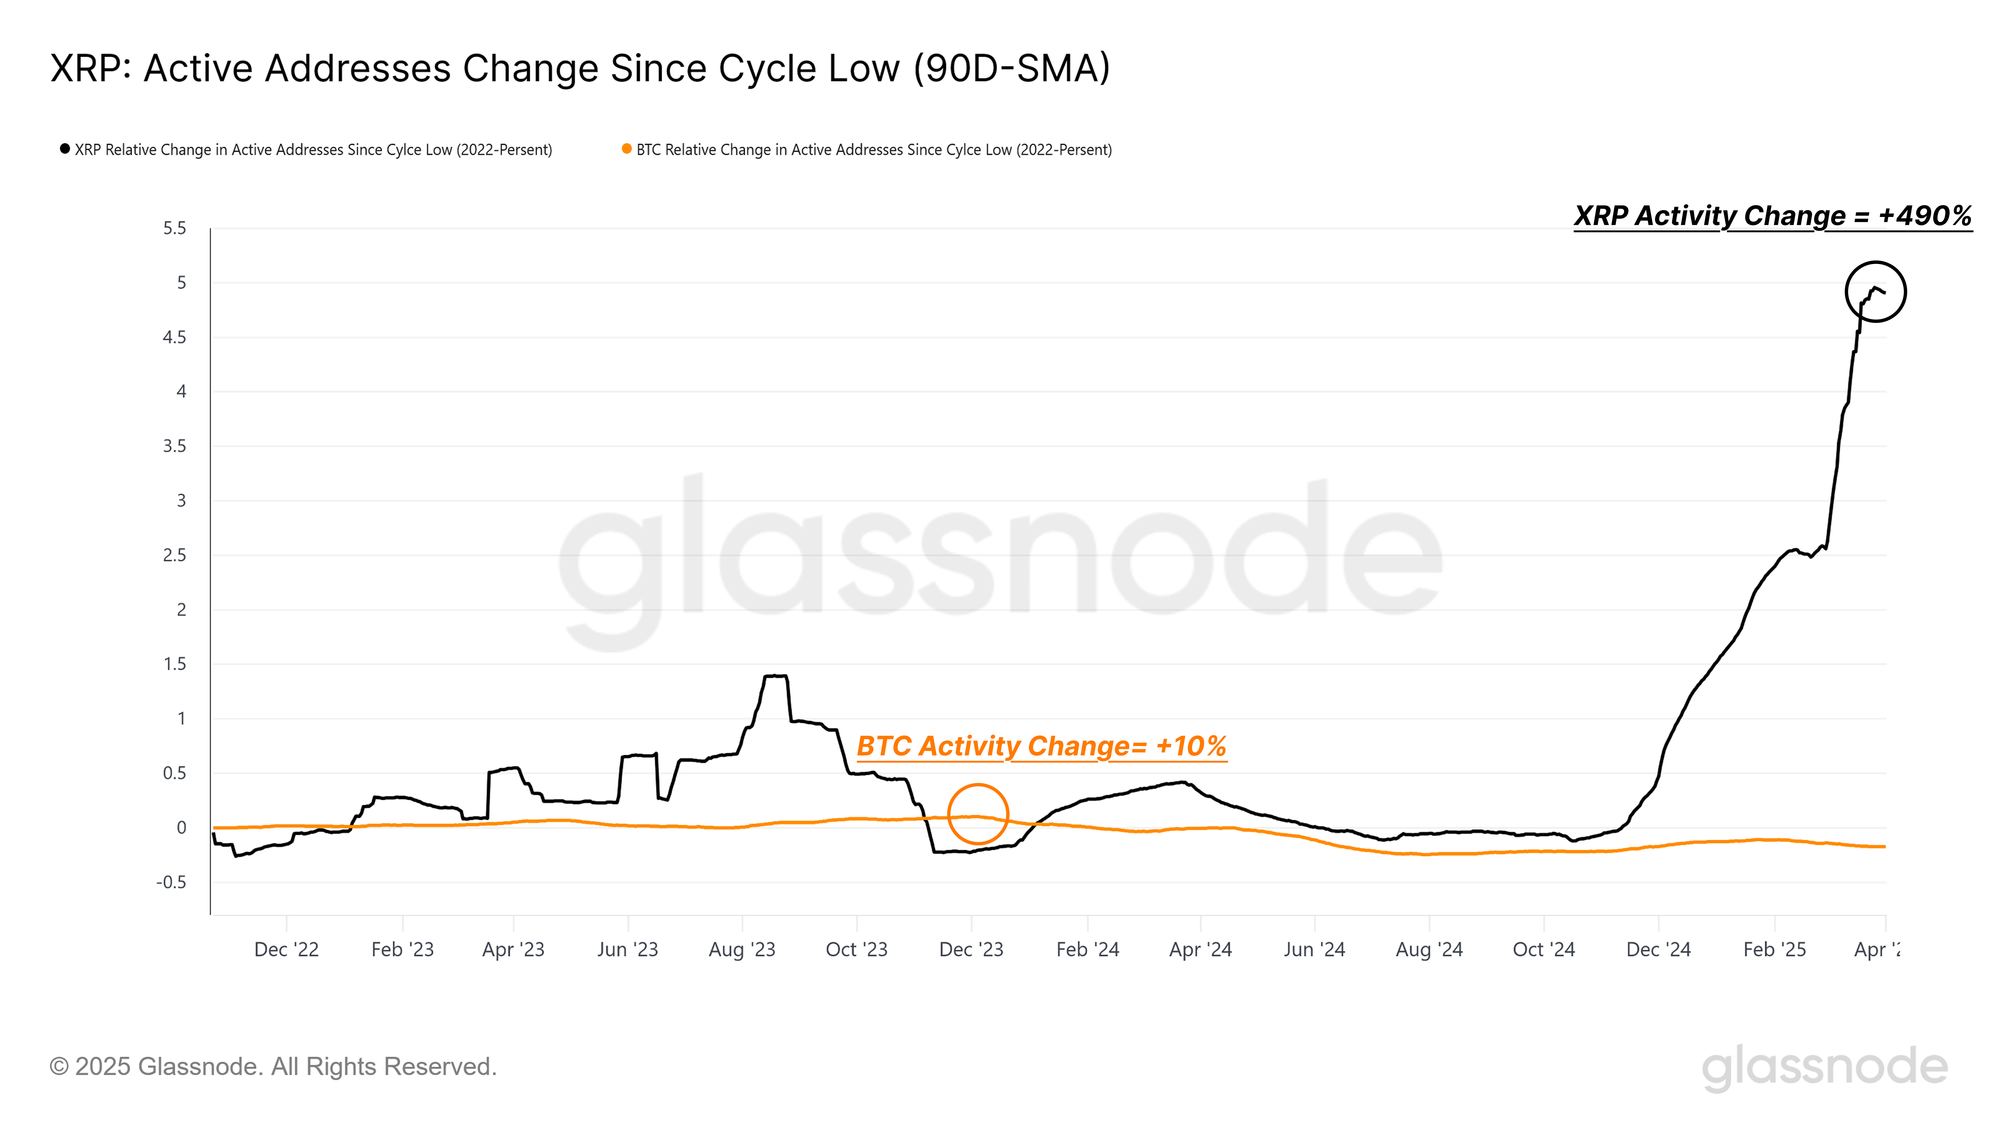
Since the 2022 cycle low, the quarterly average of daily active addresses for XRP has jumped by +490%, compared to just 10% for Bitcoin. This stark contrast suggests that retail enthusiasm has been attracted by XRP, thus providing a mirror for speculative appetite in the crypto space.
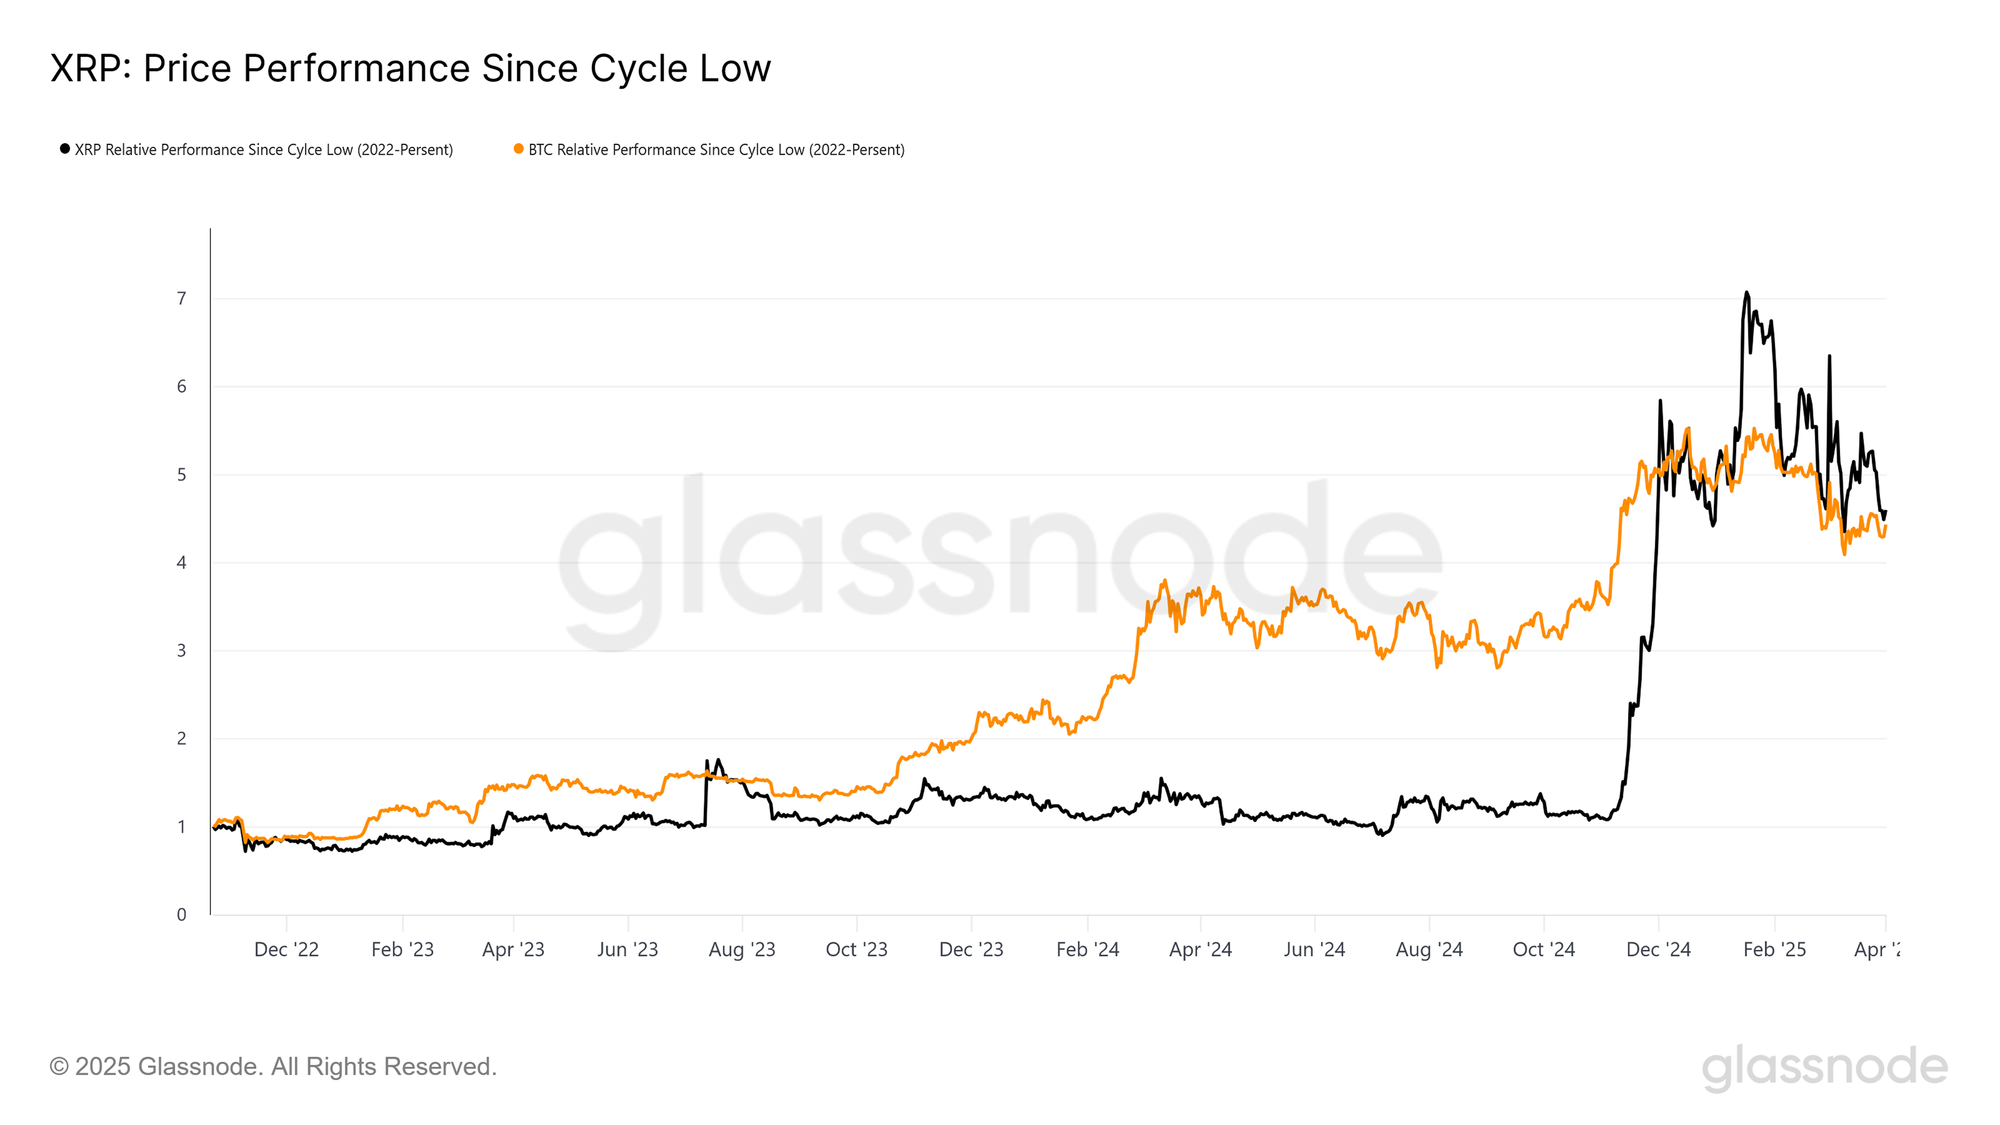
This becomes even clearer when we examine the path each asset has taken since the 2022 cycle low. While both Bitcoin and XRP have delivered a similar performance, both trading, roughly 5x to 6x off the bottom, the journey has been fundamentally different.
Bitcoin’s rally has followed a more organic and progressive trajectory, marked by steady growth and punctuated by sharp uptrends during key catalysts such as the launch of spot ETFs and developments around the U.S. elections.
In contrast, XRP traded largely sideways until December 2024 before experiencing an explosive surge higher, a price pattern more consistent with retail-driven speculation than with structured and sustained inflow of new demand.
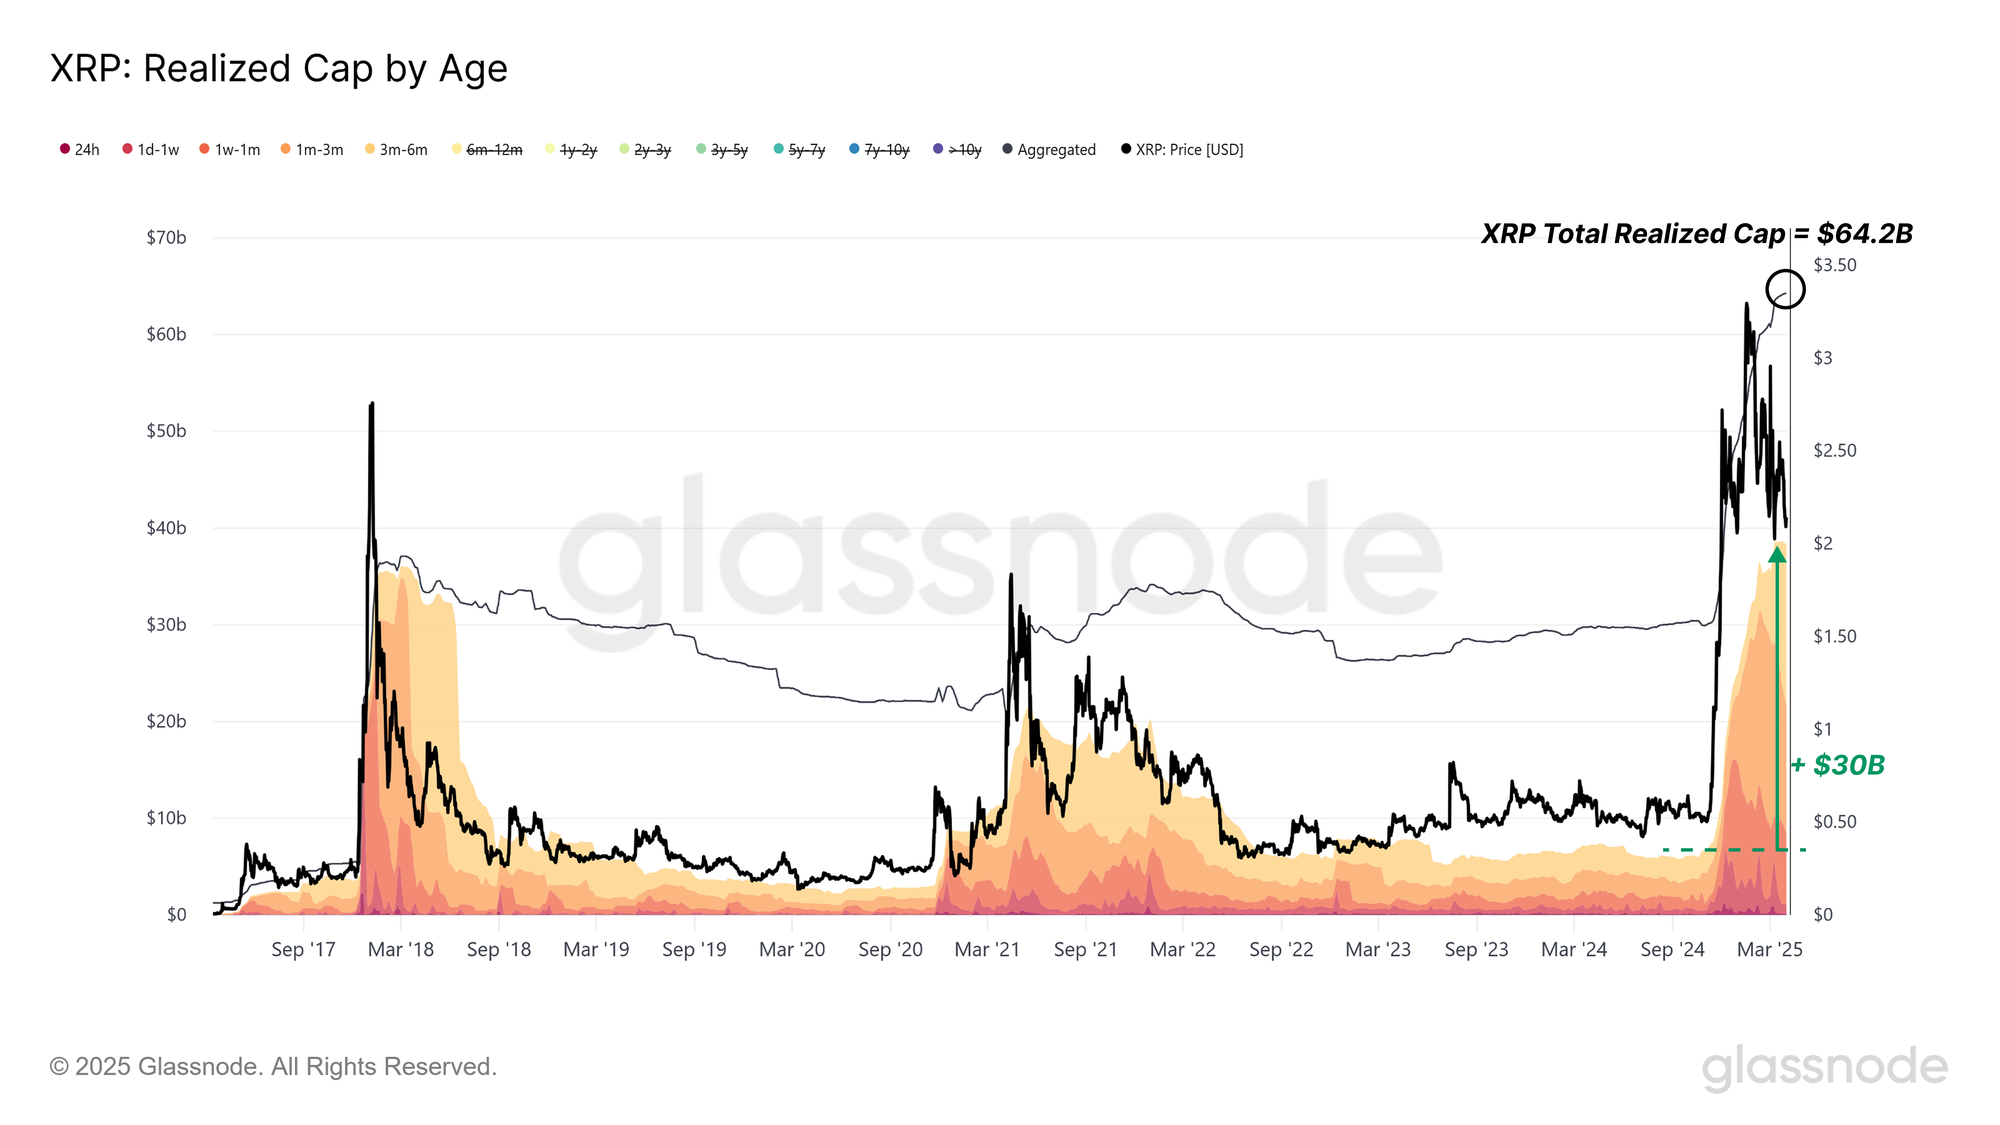
During this recent surge, XRP’s Realized Cap nearly doubled from $30.1B to $64.2B, reflecting a substantial inflow of capital. Notably, close to $30B of this increase came from investors deploying capital within the last six months, highlighting the short concentration of this retail-led rally.
However, this capital influx has started to slow down since late February 2025, signalling a potential cooling-off in speculative appetite.
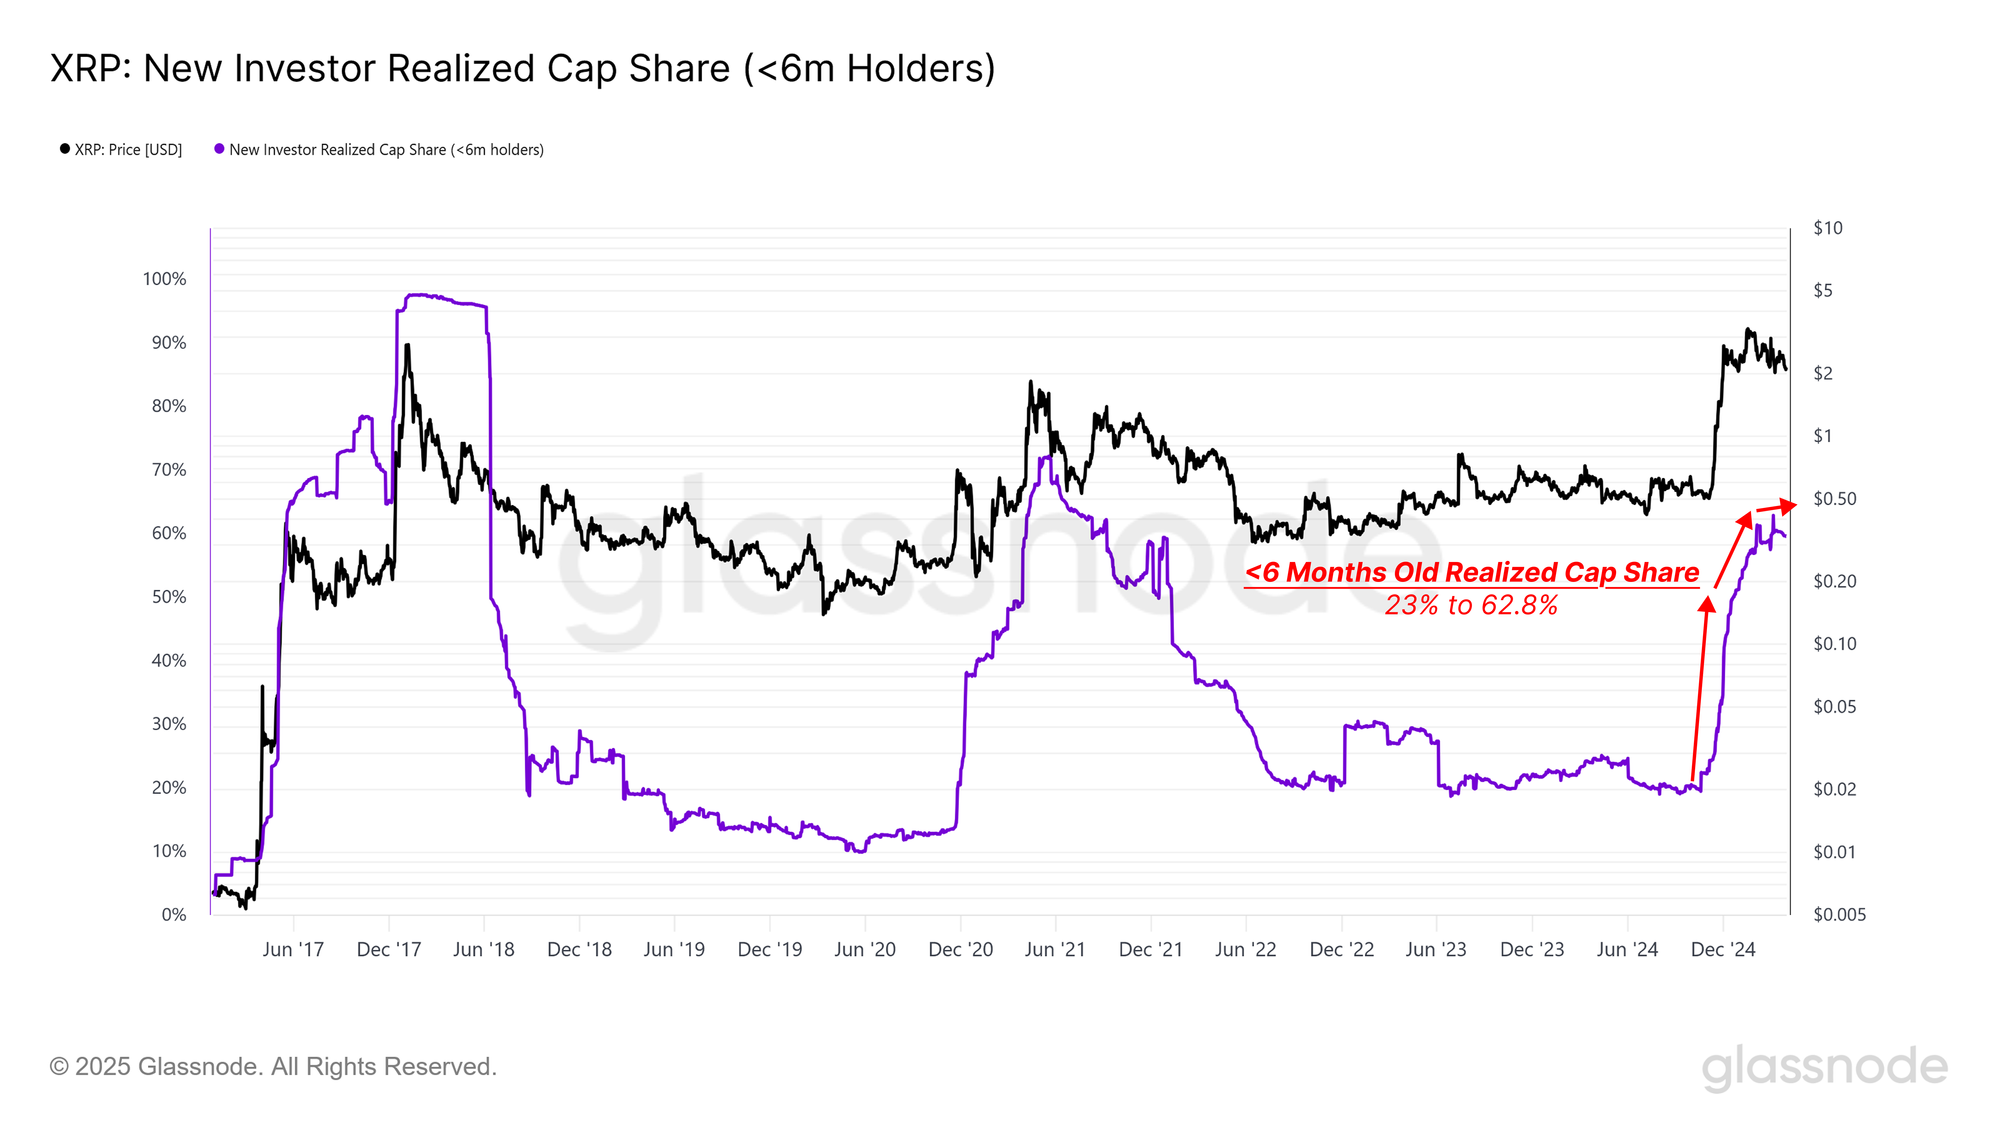
Alongside the short surge in capital flows, there’s been a rapid concentration of wealth in the hands of new investors, with the share of XRP’s realized cap, which is younger than 6 months, rising from 23% to 62.8% in just a short period of time.
When viewed together with the heavy retail participation, this sharp uplift in new holders raises caution signs, where many investors are likely to be vulnerable to downside volatility, given their now elevated cost basis.
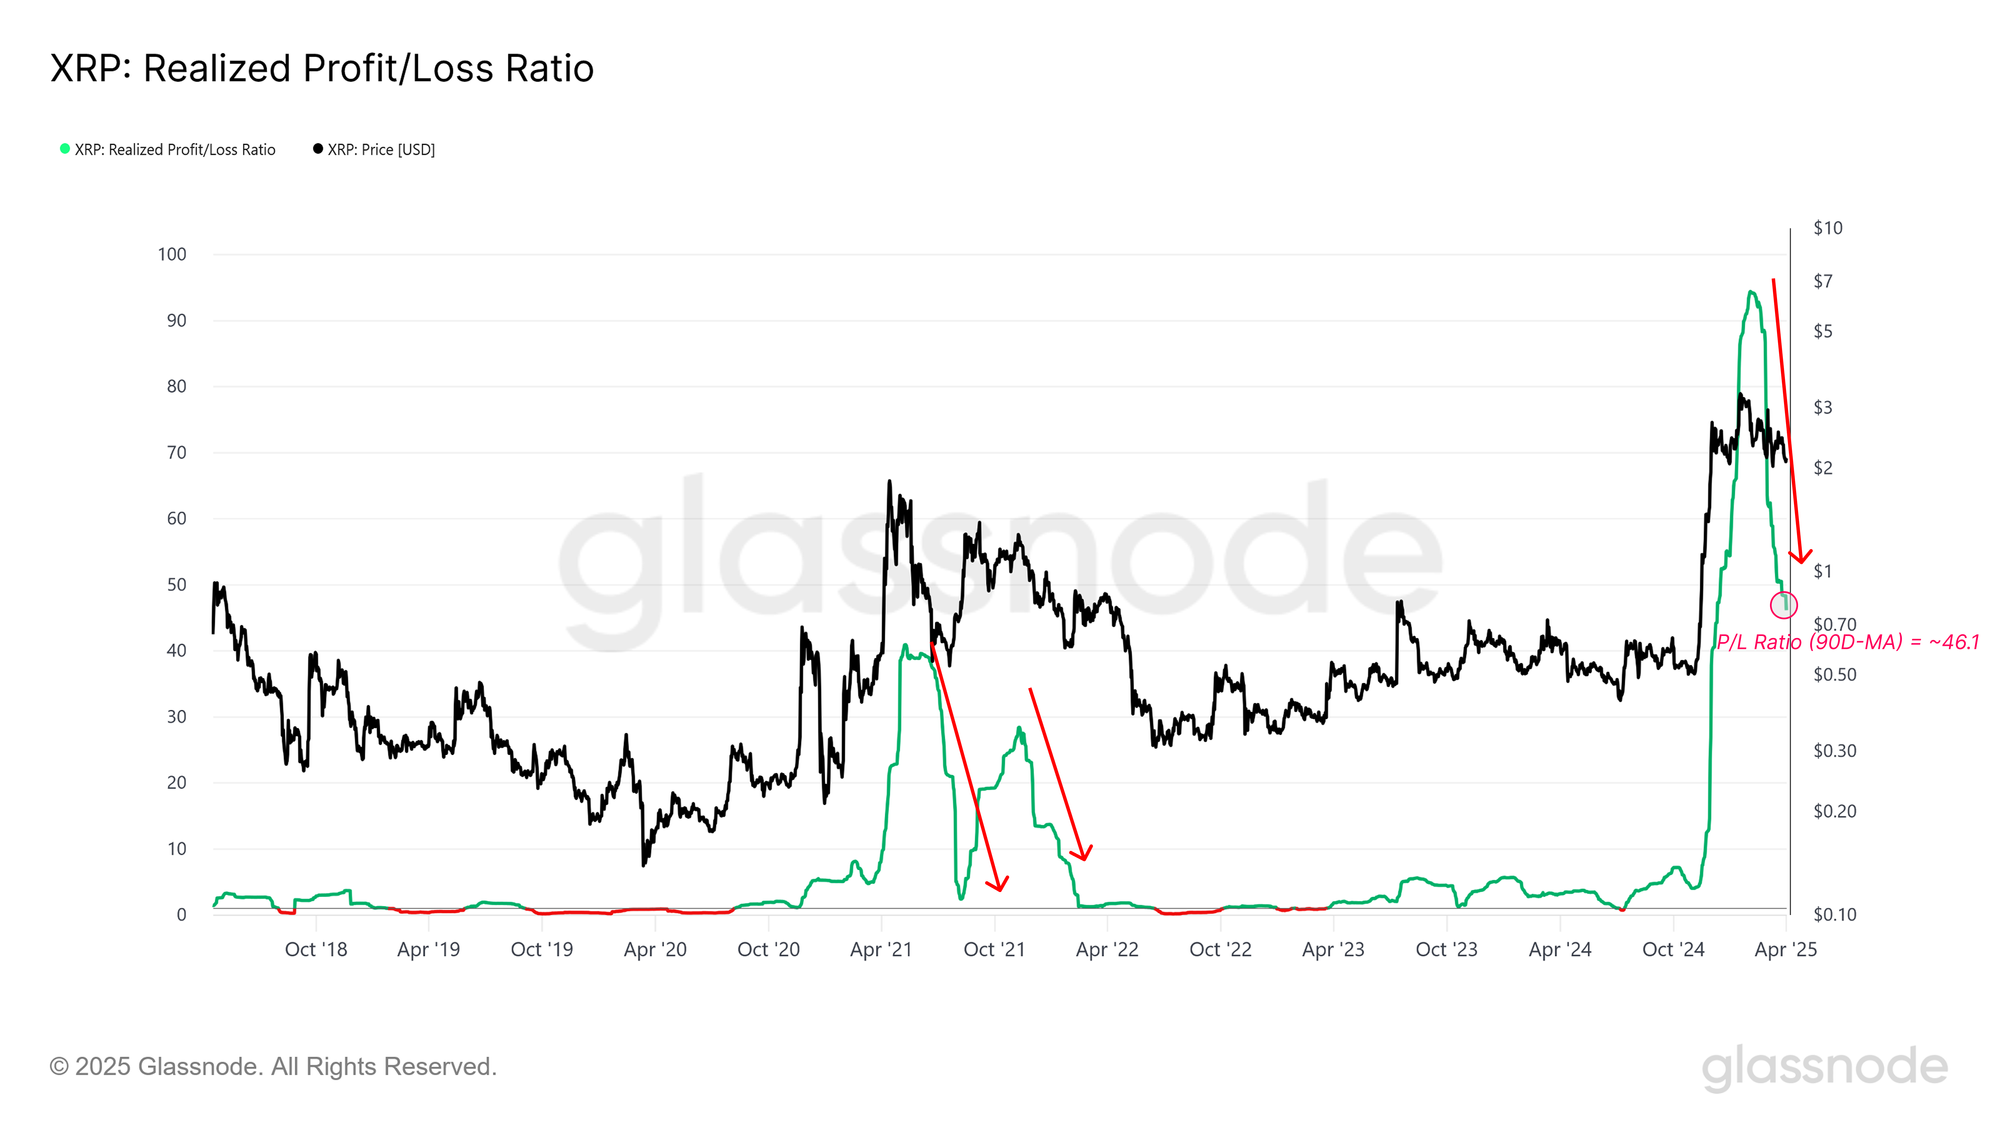
This resembles a top-heavy cost basis structure, which becomes even more concerning when we observe the Realized Loss/Profit Ratio for XRP. This metric has been in steady decline since January 2025, suggesting that investors are realizing fewer profits, and increasingly large losses.
These conditions are a common signal of waning confidence and a general move towards more fragile, higher-risk conditions. Given the retail-dominated inflows, and largely concentrated wealth in relatively new hands, this alludes to a condition where retail investor confidence may be slipping, both in XRP, but may also be extended across the broader market.
Summary and Conclusions
The Bitcoin market continues to digest the correction after the $109k ATH, with signs of increasing losses held, and locked in by investors. Although the price has stabilized above an area of demand around $76k–$80k, several on-chain momentum indicators suggest these may be relief rallies within a broader downtrend rather than the beginning of a sustainable reversal.
Analysis of XRP network trends also offers a proxy view for the magnitude of the risk appetite of retail investors. The asset has seen a dramatic uptick in address activity, capital inflows, and realized cap growth over the last 6-months. However, this enthusiasm appears to have reached a saturation point as profit-taking wanes, and losses have started to accelerate. The XRP market is showing signs of a top-heavy structure, with many investors caught on a relatively high-cost basis.
Altogether, this data reinforces a case where Bitcoin's correction is meaningful in scale but has not yet reached the severity of previous bear markets. For more speculative assets like XRP, demand may have already peaked, suggesting caution may be warranted until signs of a robust recovery start to emerge.
Disclaimer: This report does not provide any investment advice. All data is provided for information and educational purposes only. No investment decision shall be based on the information provided here and you are solely responsible for your own investment decisions.
Exchange balances presented are derived from Glassnode’s comprehensive database of address labels, which are amassed through both officially published exchange information and proprietary clustering algorithms. While we strive to ensure the utmost accuracy in representing exchange balances, it is important to note that these figures might not always encapsulate the entirety of an exchange’s reserves, particularly when exchanges refrain from disclosing their official addresses. We urge users to exercise caution and discretion when utilizing these metrics. Glassnode shall not be held responsible for any discrepancies or potential inaccuracies. Please read our Transparency Notice when using exchange data.
- Join our Telegram channel.
- For on-chain metrics, dashboards, and alerts, visit Glassnode Studio.