THETA, LIDO, KLAY and EGLD flash bullish signs as Bitcoin recaptures $23K

CointelegraphPublished on 2023-02-27Last updated on 2023-02-27

Abstract

BTC price is chasing after $24,000 again, raising the possibility of LDO, EGLD, THETA and KLAY targeting new year-to-date highs.

The cryptocurrency markets and the United States equities markets witnessed profit-booking this week as the macroeconomic data hinted toward continued rate hikes by the Federal Reserve. Bitcoin (BTC) is down more than 4% and the S&P 500 fell 2.7% to record its worst week of the year.

The CME FedWatch Tool shows a 73% probability of a 25 basis points rate hike by the Fed in the March meeting but after the hotter-than-expected inflation readings in two weeks, the probability of a 50 basis point rate hike has started to slowly gain traction.

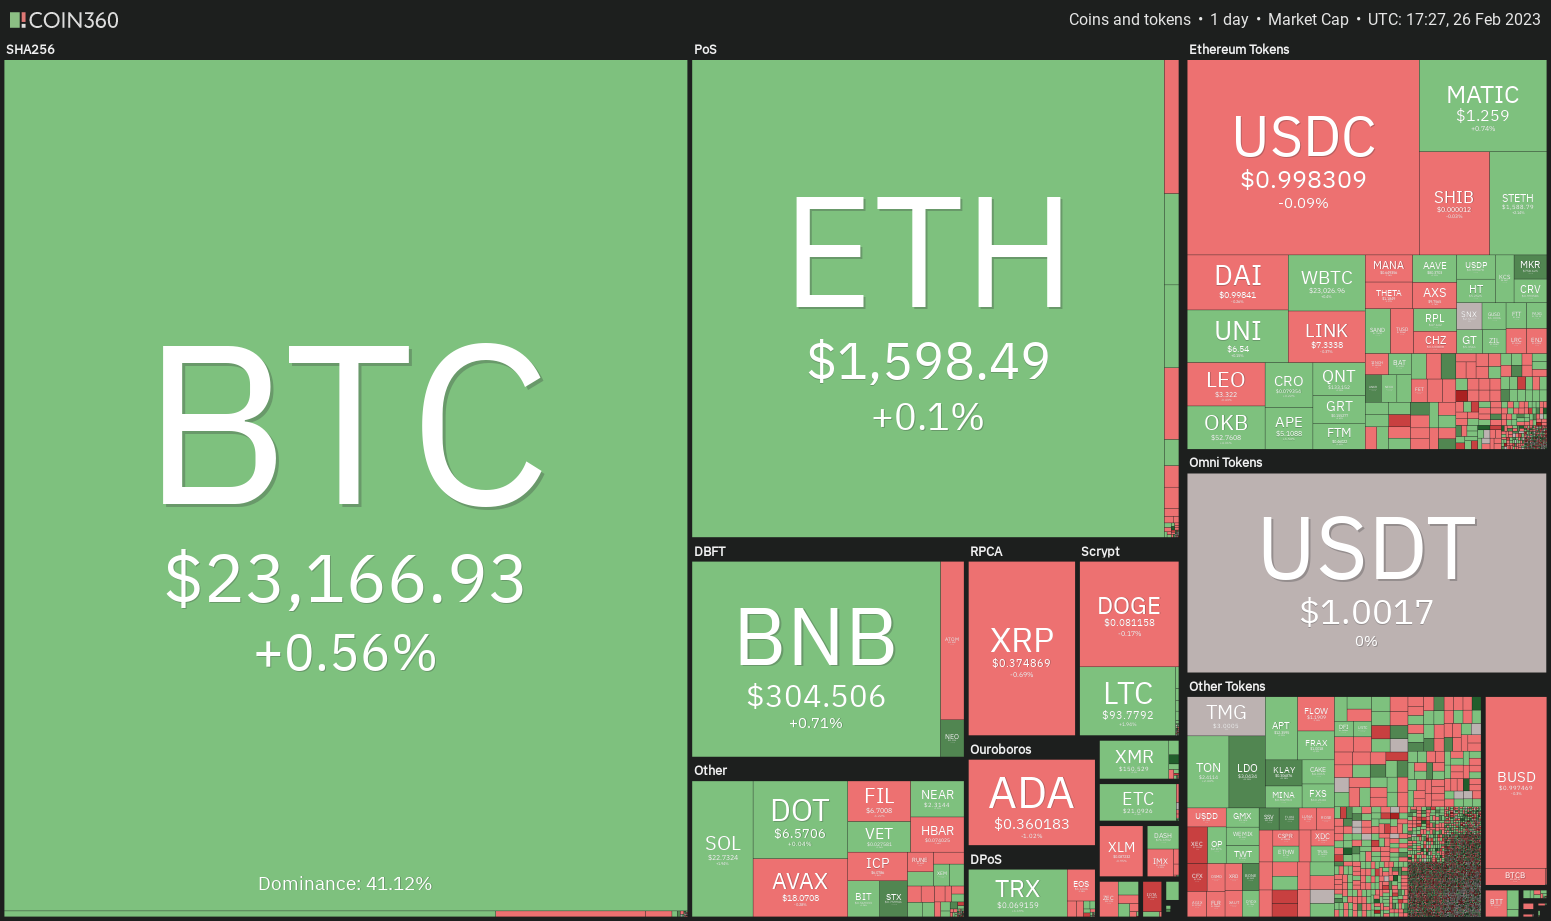
Crypto market data daily view. Source: Coin360

During periods of uncertainty, some coins enter a deeper correction while a few buck the trend and continue to outperform. Hence, it becomes important to select the right coins to trade.

A few coins that have witnessed a shallow correction or have bounced sharply off the support have been selected in this list. Let’s see their charts and determine the levels to watch out for.

BTC/USDT

Bitcoin plunged below the 20-day exponential moving average ($23,391) on Feb. 24 but the bears could not build upon this advantage and sustain the price below the strong support at $22,800.

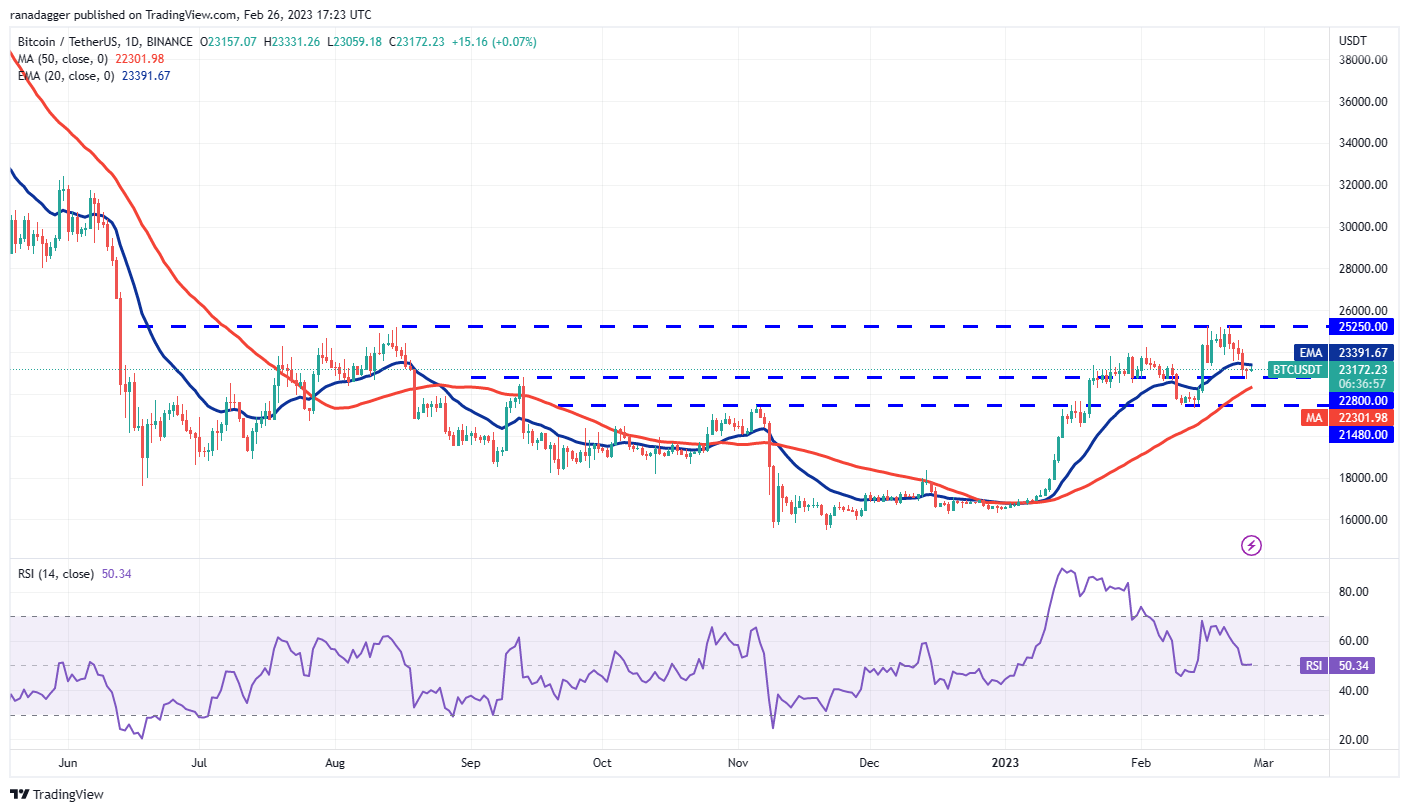
BTC/USDT daily chart. Source: TradingView

The price bounced off $22,800 on Feb. 25 and the bulls are trying to push the price above the 20-day EMA. If they manage to do that, it will indicate that the BTC/USDT pair may consolidate between $25,250 and $22,800 for a few days.

The flattening 20-day EMA and the relative strength index (RSI) near the midpoint also suggest a range-bound action in the near term.

Alternatively, if the price slips below $22,700, the selling could intensify and the pair may plummet to the next strong support at $21,480.

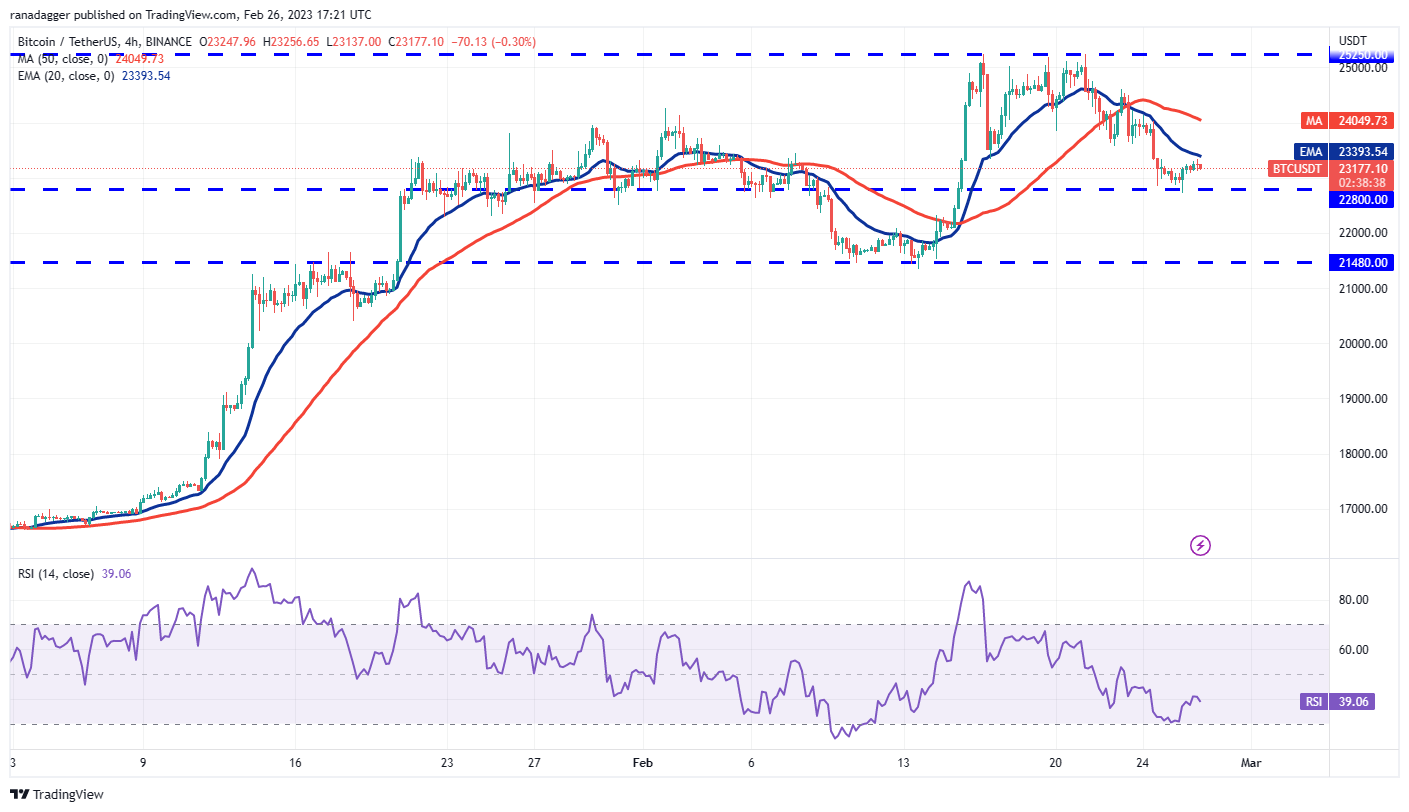
BTC/USDT 4-hour chart. Source: TradingView

The 20-EMA has turned down on the four-hour chart and the RSI is in the negative territory. This indicates an advantage to the bears. Sellers will try to protect the 20-EMA, and if the price turns down from this level, the likelihood of a break below $22,800 increases. If that happens, the selling may intensify and the pair may slide to $21,480.

On the contrary, if the price breaks above the 20-EMA, it will suggest that bulls are buying on dips. That could push the pair to the 50-simple moving average and keep the price stuck inside the range for some more time.

LDO/USDT

Lido DAO (LDO) did not sustain below the 20-day EMA ($2.75) during the recent correction, which is a positive sign. Another bullish sign is the formation of the pennant near the local highs.

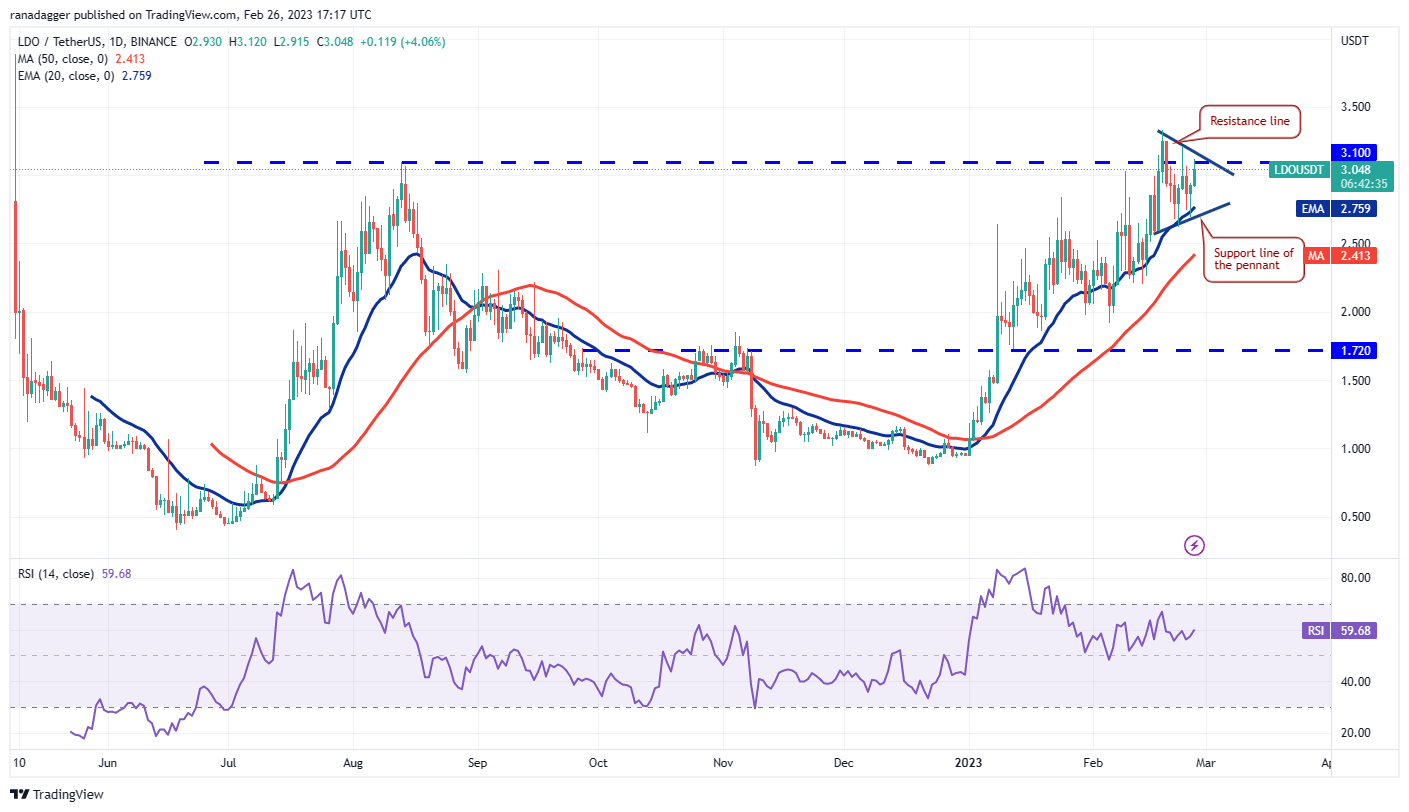
LDO/USDT daily chart. Source: TradingView

The bulls will try to propel the price above the resistance line of the pennant. If they succeed, the LDO/USDT pair could start the next leg of the up-move. The pair may first rise to $3.90 and thereafter attempt a rally to $4.24.

Conversely, if the price turns down from the resistance line, it will suggest that bears are selling on rallies. That could keep the price inside the pennant for a while longer. The bears will have to sink the price below the pennant if they want to signal a short-term trend reversal.

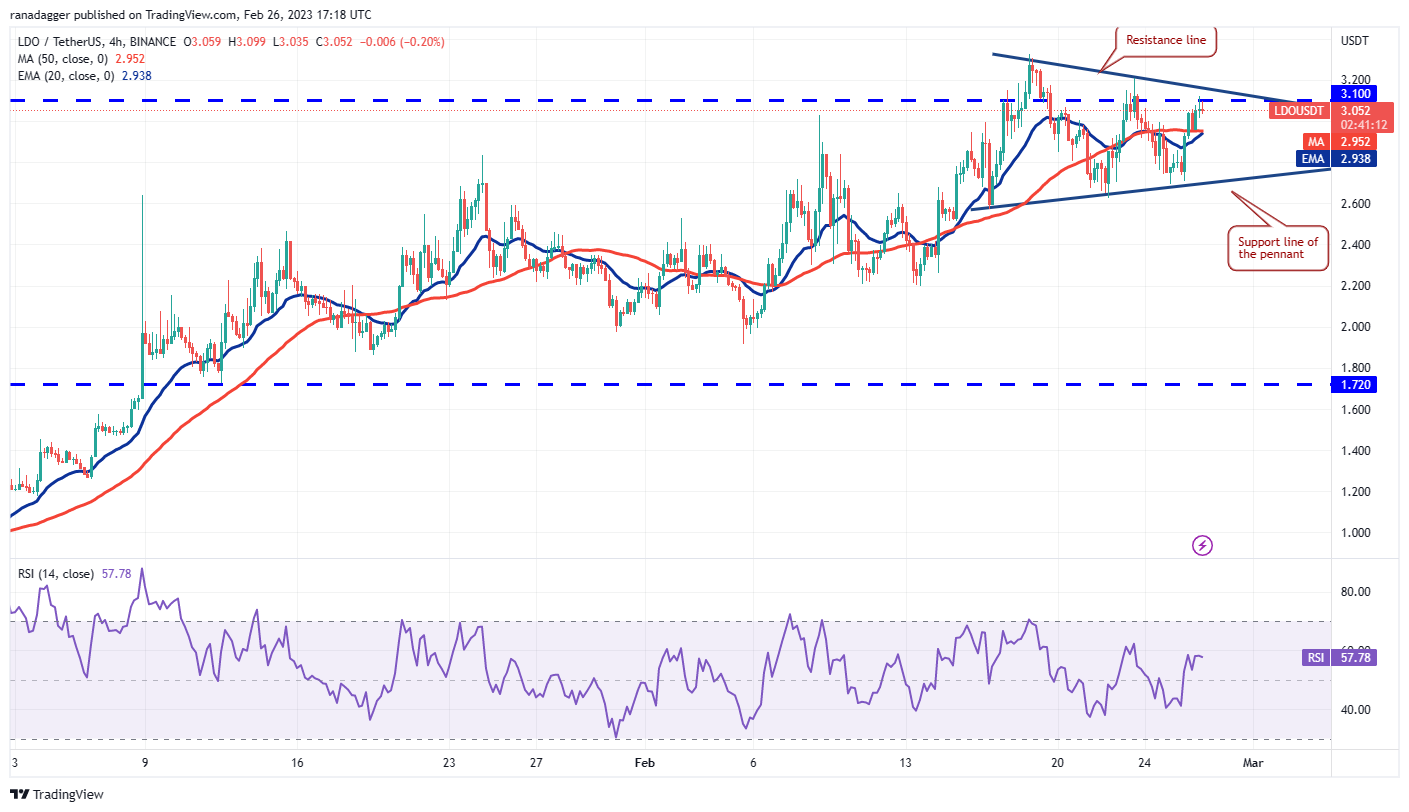
LDO/USDT 4-hour chart. Source: TradingView

The strong bounce off the support line of the pennant indicates aggressive buying on dips. Buyers will have to overcome the obstacle at the resistance line to regain control. If they do that, the pair may resume its uptrend.

However, the bears are likely to have other plans as they will try to protect the resistance line. If the price turns down from this level, the state of equilibrium may continue for some more time.

A break below the pennant could attract profit-booking by short-term traders. That may tug the price to $2.20 and later to $2.

EGLD/USDT

MultiversX turned down from the resistance line but an encouraging sign is that the bulls are trying to defend the 20-day EMA ($47).

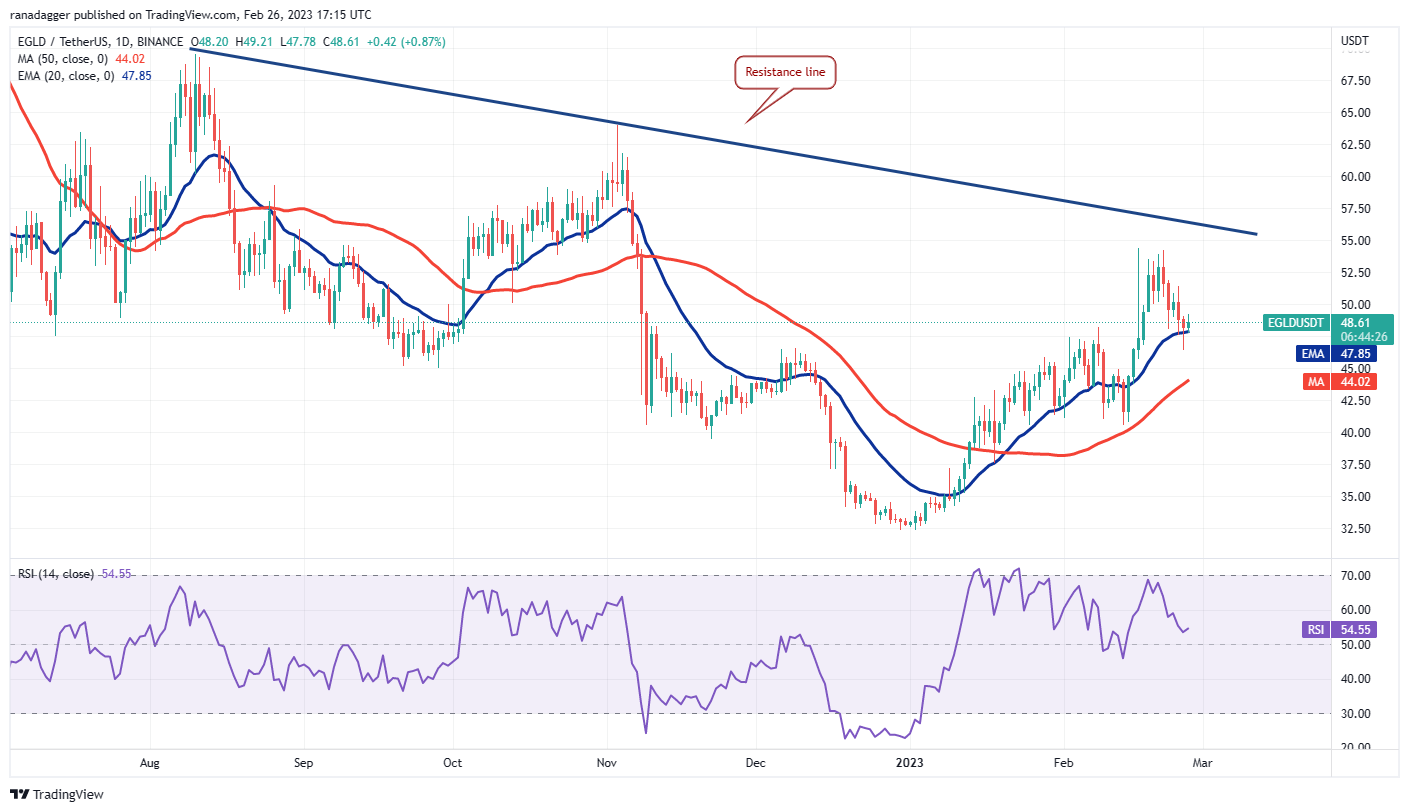
EGLD/USDT daily chart. Source: TradingView

Both moving averages are sloping up and the RSI is above 54, indicating that buyers have a slight edge. The bulls will try to push the price toward the resistance line where they are again likely to face strong opposition from the bears.

This bullish view could invalidate in the near term if the price turns down and plummets below the 20-day EMA. That will indicate selling by the bears on every minor rally. The EGLD/USDT pair could then tumble to the 50-day SMA ($44) and later to $40.

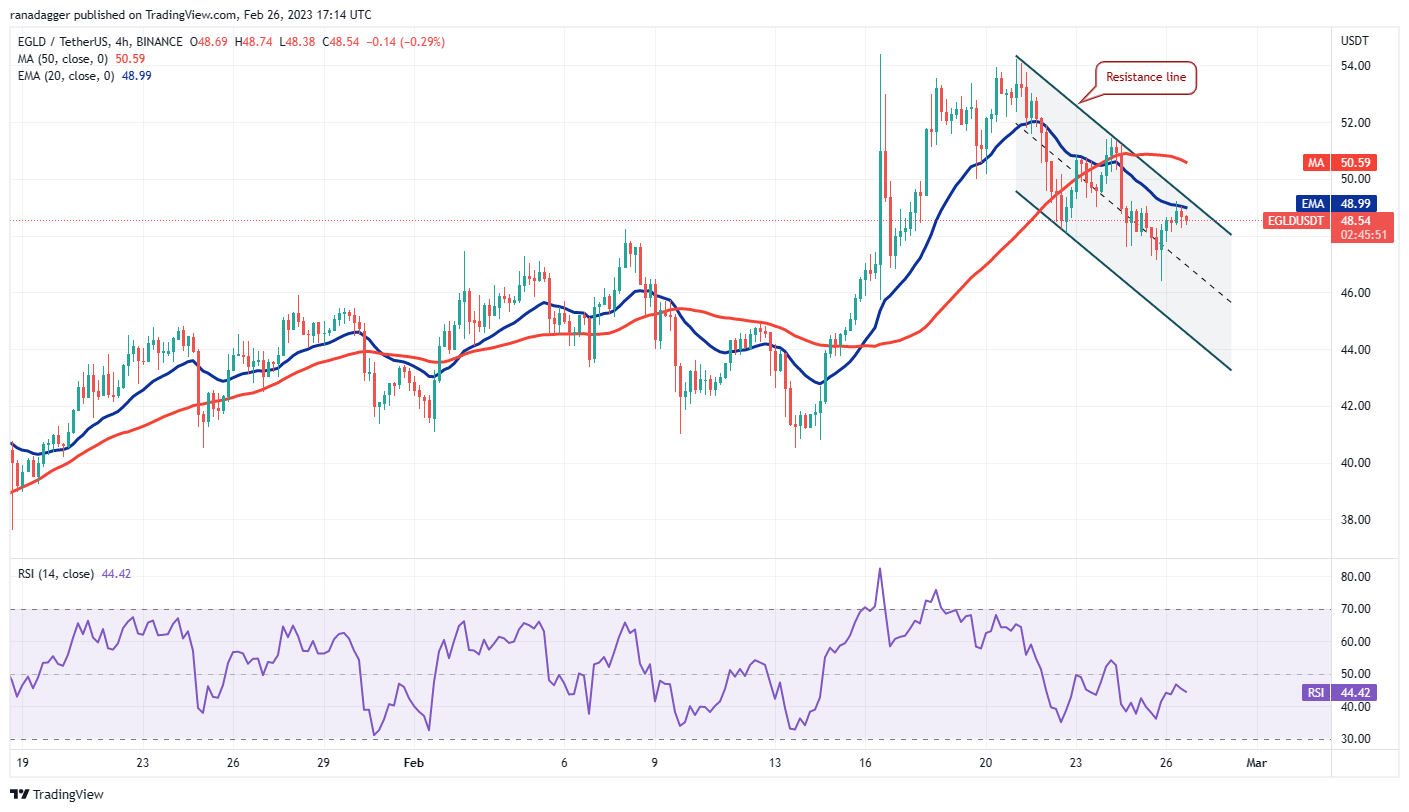
EGLD/USDT 4-hour chart. Source: TradingView

The four-hour chart shows that the price is falling inside a descending channel pattern. Buyers purchased at lower levels and have pushed the price to the resistance line of the channel. If this resistance gives way, the pair could rise to the 50-SMA and thereafter attempt a retest of the strong barrier at $54.

Contrarily, if the price turns down from the resistance line, it will suggest that the bears have not given up. That could result in a drop toward the support line of the channel.

THETA/USDT

The bulls are trying to arrest Theta Network’s pullback at the 20-day EMA ($1.15). Both moving averages are sloping up and the RSI is in the positive territory, indicating advantage to the bulls.

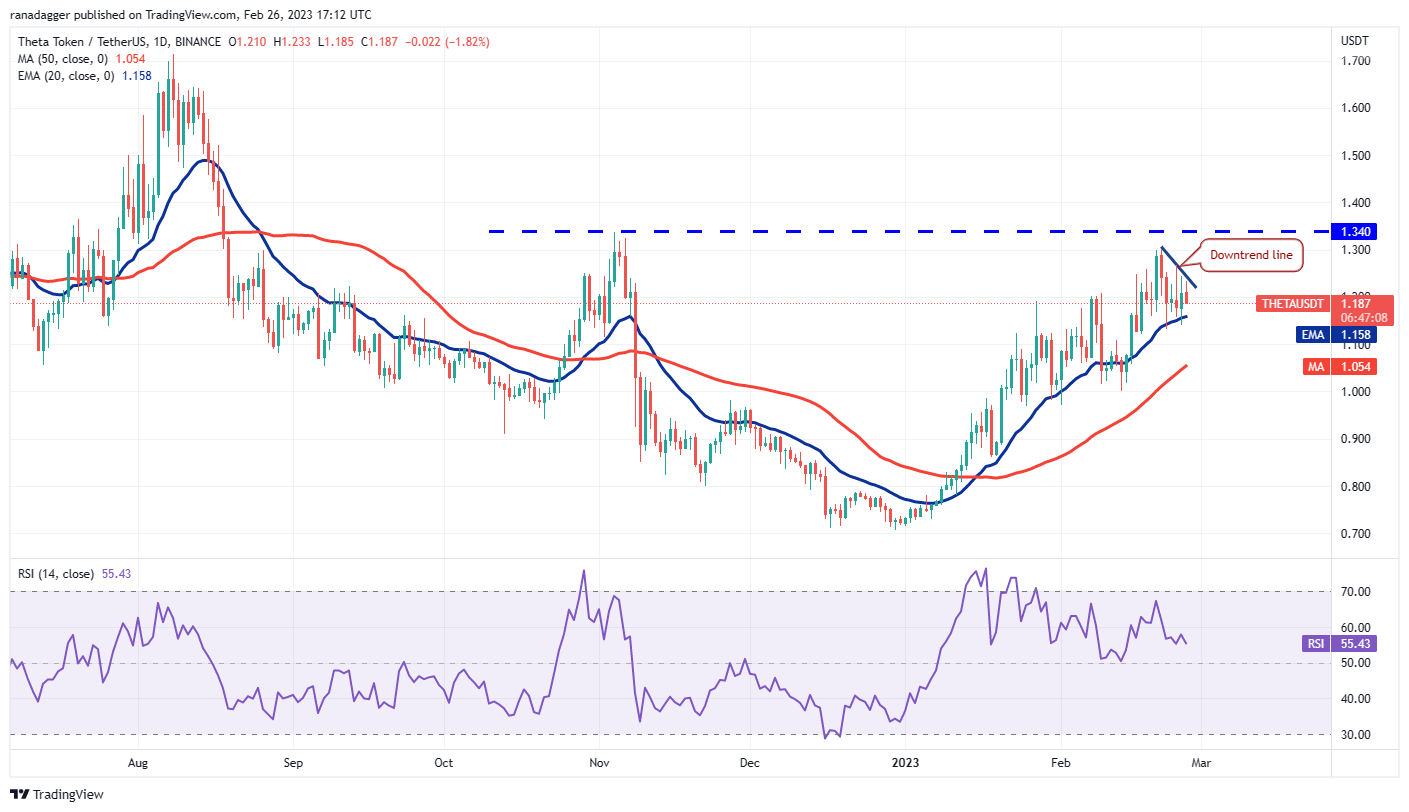
THETA/USDT daily chart. Source: TradingView

If buyers thrust the price above the downtrend line, the THETA/USDT pair could climb to the overhead resistance at $1.34. This is a formidable resistance and a break above it could open the gates for a possible surge to $1.70.

Instead, if the price turns down and plunges below the 20-day EMA, it will suggest that the short-term bulls may be rushing to the exit. That may start a deeper correction to the 50-day SMA ($1.05) and then to the psychological support at $1.

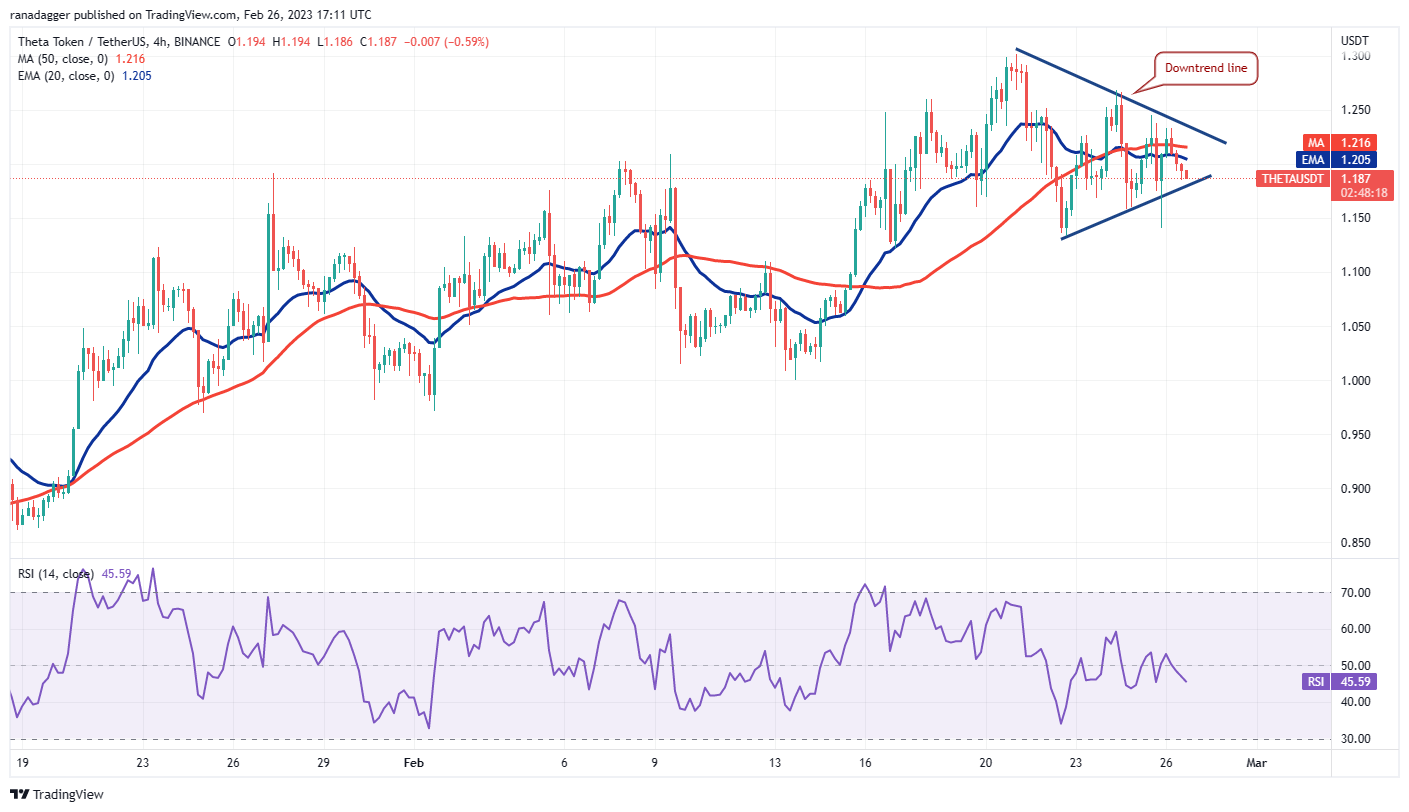
THETA/USDT 4-hour chart. Source: TradingView

The four-hour chart shows the formation of a symmetrical triangle pattern. Both moving averages have flattened out and the RSI is oscillating near the center, indicating a balance between supply and demand.

A break below the triangle could tilt the short-term advantage in favor of the bears. The pair could first fall to $1.12 and then to $1.

If bulls want to prevent the decline, they will have to quickly propel the price above the triangle. That could start a journey to $1.27 and later to $1.30.

KLAY/USDT

Klaytn (KLAY) is attempting to break out from a basing pattern. The price rebounded off the 20-day EMA ($0.26) on Feb. 25, indicating solid buying on dips.

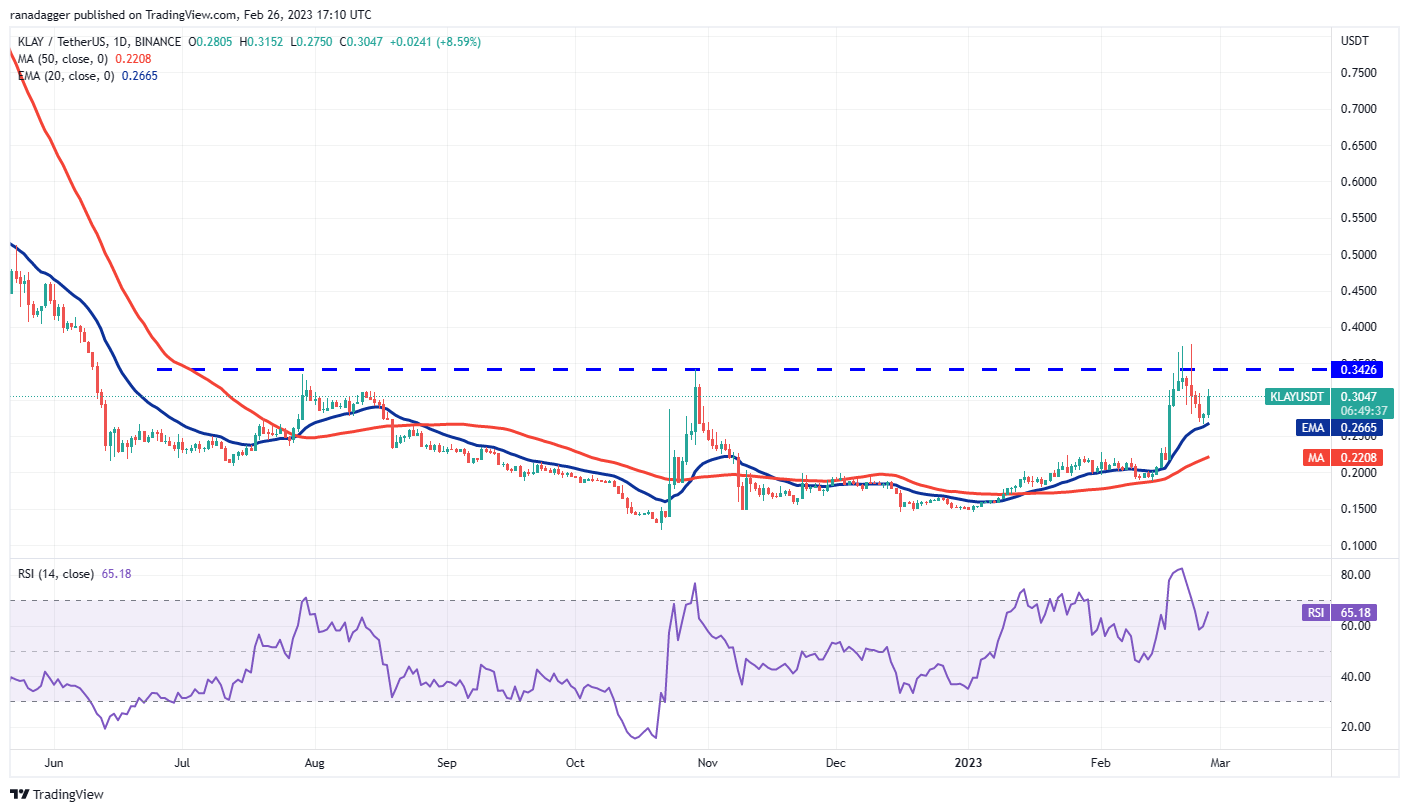
KLAY/USDT daily chart. Source: TradingView

The bulls will try to pierce the overhead resistance at $0.34. If they do that, the KLAY/USDT pair could pick up momentum and soar to the psychological resistance at $0.50. Such a move will signal a potential trend change.

If the price turns down from $0.34, it will indicate that bears are fiercely protecting the level. That could again pull the price down to the 20-day EMA. A break below this level could indicate that the pair may spend some more time in the basing pattern.

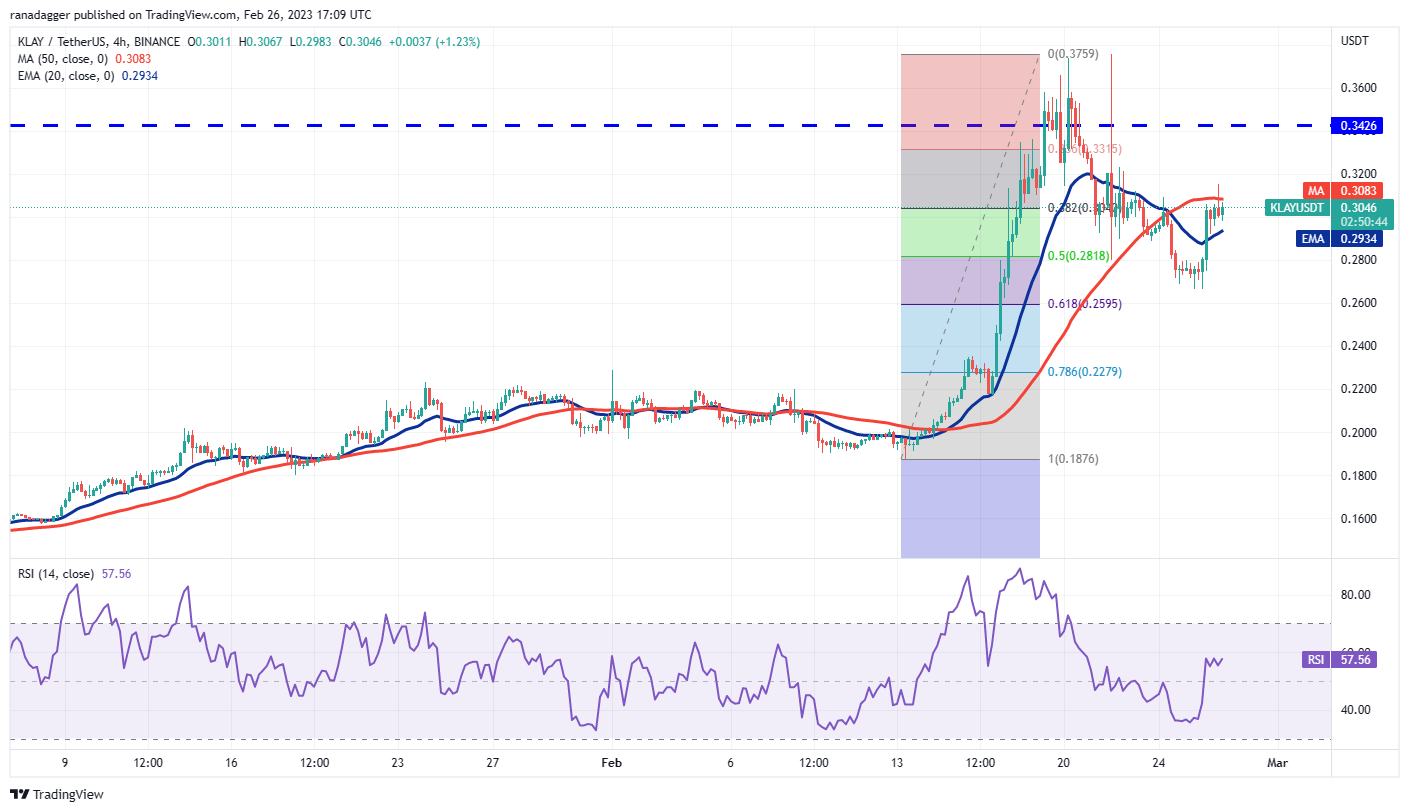
KLAY/USDT 4-hour chart. Source: TradingView

The bulls arrested the pullback near the 61.8% Fibonacci retracement of $0.26 and started a recovery. There is a minor resistance at $0.32 but if this level is crossed, the pair could attempt a rally to $0.34 and thereafter to $0.37.

On the other hand, if the price turns down from the overhead resistance, it will suggest that bears are selling on rallies. That may enhance the prospects of a break below $0.26. If that happens, the pair may slide to $0.22.

Trending Cryptos

Related Reads

Report Interpretation: J.P. Morgan Details Micron's Pre-Earnings Sentiment, Current Hardware Sector Dynamics

Morgan Stanley analyst Joshua Meyers' report (June 21, 2026) highlights key trends in the hardware and semiconductor sector ahead of Micron's earnings. The core takeaways are: 1. **Micron & Memory:** Memory remains a high-conviction long theme, driven by strong AI demand and rising ASPs. However, investor focus is shifting to the sustainability of Micron's >80% gross margins and the specifics of potential new long-term supply agreements (SCAs). 2. **Hardware Supply Chain:** AI-related demand for servers, networking, and storage remains robust, but company performance is diverging. Celestica (CLS) shows improved margin confidence, Western Digital and Seagate benefit from pricing, Fabrinet (FN) sees predictable AI optics growth, and Teradyne (TER) anticipates a new Google customer. 3. **AI Capex & WFE Forecasts:** JPMorgan increased its Wafer Fab Equipment (WFE) market growth forecasts to 28% in 2026 and 29% in 2027. AI infrastructure financing is evolving, with higher project-level debt reducing constraints on capex expansion. The report signals that while the AI-driven hardware cycle is strong, the market is entering a phase focused on execution verification (e.g., Micron's SCA details, Fabrinet's ramp with Amazon) and valuation sustainability. Key near-term signals include Micron's guidance, Arista Networks' outlook, and the pace of demand normalization post potential tariff-related pull-ins.

marsbit4h ago

Report Interpretation: J.P. Morgan Details Micron's Pre-Earnings Sentiment, Current Hardware Sector Dynamics

marsbit4h ago

Research Report Analysis: The Fed's New Chair's Debut – New Leader, But Same Script?

Report Analysis: Federal Reserve's New Chair Debut – A New Captain, But the Same Script? Morgan Stanley's chief global economist Seth B. Carpenter analyzes the first FOMC meeting under new Fed Chair Kevin Warsh in a June 21 report. Warsh deliberately avoided providing forward guidance on interest rates, aligning with his philosophy. However, market expectations for a rate hike this year were reinforced. Key signals lie elsewhere: inflation may fall more than expected, and quantitative tightening (QT) could be more aggressive than anticipated. The FOMC's "dot plot" suggests only one rate hike in 2026. Carpenter argues that if inflation undershoots forecasts, the logic for even a single hike weakens, especially as projections indicate potential rate cuts in 2027. On QT, Warsh's stance is clear. Carpenter notes that measures like halving the Treasury's account balance could shrink the Fed's balance sheet by around $500 billion with minimal market impact. Combined with adjustments to reserve interest and liquidity rules, the ultimate QT scale may exceed expectations, though its market effect might be less disruptive unless the Fed actively sells Mortgage-Backed Securities (MBS). While Warsh initiated a review of the Fed's policy framework, the 2% inflation target remains intact for now. The report concludes that the market may be overestimating the significance of reduced forward guidance and the near-term rate hike risk, while potentially underestimating the scope and manageable nature of the coming balance sheet reduction. The key debates will hinge on upcoming core PCE data, the specifics of the QT path, and the framework review's findings.

marsbit4h ago

Research Report Analysis: The Fed's New Chair's Debut – New Leader, But Same Script?

marsbit4h ago

Critical Game Week: BTC Retracement Confirmation vs. HYPE Support Battle | Guest Analysis

This weekly analysis outlines a critical juncture for BTC and HYPE markets, focusing on key price level confirmations. **BTC Analysis:** BTC is at a pivotal point after a five-wave rally from the June 5th low of $59,100. The price has broken below a short-term rising channel's lower boundary, with the current move seen as a pullback to test this breakdown. Failure to reclaim this level could lead to a retest of the $59,000-$60,000 support zone. The core scenario hinges on this channel retest outcome. * **Key Levels:** Resistance at $64,500-$65,000 (channel boundary) and $69,500-$70,500. Support at $59,000-$60,000 and $55,000. * **Strategy:** A core bearish stance is maintained (20% short from last week), with short-term plans for tactical trades. Three detailed contingency plans (A/B/C) are provided for short positions on resistance tests or breakdowns, emphasizing strict stop-loss discipline. **HYPE Analysis:** HYPE shows strong momentum but is currently in a corrective phase after hitting a new high of $76.94. The price is retesting the crucial $64-$66 support area. * **Key Levels:** Resistance near $77 and $80-$82. Support at $64-$66 and $52-$54. * **Strategy:** The short-term approach is "buy on dips, avoid chasing rallies." A long position is considered only if clear stabilization signals appear at the $64-$66 or deeper $52-$54 support zones, with tight risk controls. **General Risk Management:** A standardized trailing stop-loss protocol is emphasized: set initial stop, breakeven at +1% profit, then trail stops upward to lock in gains. *Disclaimer: All analysis is presented as a personal trading framework, not investment advice. Market conditions are complex and require dynamic adjustment.*

marsbit4h ago

Critical Game Week: BTC Retracement Confirmation vs. HYPE Support Battle | Guest Analysis

marsbit4h ago

Trading

Spot
Futures

Hot Articles

What is $BITCOIN

DIGITAL GOLD ($BITCOIN): A Comprehensive Analysis Introduction to DIGITAL GOLD ($BITCOIN) DIGITAL GOLD ($BITCOIN) is a blockchain-based project operating on the Solana network, which aims to combine the characteristics of traditional precious metals with the innovation of decentralized technologies. While it shares a name with Bitcoin, often referred to as “digital gold” due to its perception as a store of value, DIGITAL GOLD is a separate token designed to create a unique ecosystem within the Web3 landscape. Its goal is to position itself as a viable alternative digital asset, although specifics regarding its applications and functionalities are still developing. What is DIGITAL GOLD ($BITCOIN)? DIGITAL GOLD ($BITCOIN) is a cryptocurrency token explicitly designed for use on the Solana blockchain. In contrast to Bitcoin, which provides a widely recognized value storage role, this token appears to focus on broader applications and characteristics. Notable aspects include: Blockchain Infrastructure: The token is built on the Solana blockchain, known for its capacity to handle high-speed and low-cost transactions. Supply Dynamics: DIGITAL GOLD has a maximum supply capped at 100 quadrillion tokens (100P $BITCOIN), although details regarding its circulating supply are currently undisclosed. Utility: While precise functionalities are not explicitly outlined, there are indications that the token could be utilized for various applications, potentially involving decentralized applications (dApps) or asset tokenization strategies. Who is the Creator of DIGITAL GOLD ($BITCOIN)? At present, the identity of the creators and development team behind DIGITAL GOLD ($BITCOIN) remains unknown. This situation is typical among many innovative projects within the blockchain space, particularly those aligning with decentralized finance and meme coin phenomena. While such anonymity may foster a community-driven culture, it intensifies concerns about governance and accountability. Who are the Investors of DIGITAL GOLD ($BITCOIN)? The available information indicates that DIGITAL GOLD ($BITCOIN) does not have any known institutional backers or prominent venture capital investments. The project seems to operate on a peer-to-peer model focused on community support and adoption rather than traditional funding routes. Its activity and liquidity are primarily situated on decentralized exchanges (DEXs), such as PumpSwap, rather than established centralized trading platforms, further highlighting its grassroots approach. How DIGITAL GOLD ($BITCOIN) Works The operational mechanics of DIGITAL GOLD ($BITCOIN) can be elaborated on based on its blockchain design and network attributes: Consensus Mechanism: By leveraging Solana’s unique proof-of-history (PoH) combined with a proof-of-stake (PoS) model, the project ensures efficient transaction validation contributing to the network's high performance. Tokenomics: While specific deflationary mechanisms have not been extensively detailed, the vast maximum token supply implies that it may cater to microtransactions or niche use cases that are still to be defined. Interoperability: There exists the potential for integration with Solana’s broader ecosystem, including various decentralized finance (DeFi) platforms. However, the details regarding specific integrations remain unspecified. Timeline of Key Events Here is a timeline that highlights significant milestones concerning DIGITAL GOLD ($BITCOIN): 2023: The initial deployment of the token occurs on the Solana blockchain, marked by its contract address. 2024: DIGITAL GOLD gains visibility as it becomes available for trading on decentralized exchanges like PumpSwap, allowing users to trade it against SOL. 2025: The project witnesses sporadic trading activity and potential interest in community-led engagements, although no noteworthy partnerships or technical advancements have been documented as of yet. Critical Analysis Strengths Scalability: The underlying Solana infrastructure supports high transaction volumes, which could enhance the utility of $BITCOIN in various transaction scenarios. Accessibility: The potential low trading price per token could attract retail investors, facilitating wider participation due to fractional ownership opportunities. Risks Lack of Transparency: The absence of publicly known backers, developers, or an audit process may yield skepticism regarding the project's sustainability and trustworthiness. Market Volatility: The trading activity is heavily reliant on speculative behavior, which can result in significant price volatility and uncertainty for investors. Conclusion DIGITAL GOLD ($BITCOIN) emerges as an intriguing yet ambiguous project within the rapidly evolving Solana ecosystem. While it attempts to leverage the “digital gold” narrative, its departure from Bitcoin's established role as a store of value underscores the need for a clearer differentiation of its intended utility and governance structure. Future acceptance and adoption will likely depend on addressing the current opacity and defining its operational and economic strategies more explicitly. Note: This report encompasses synthesised information available as of October 2023, and developments may have transpired beyond the research period.

427 Total ViewsPublished 2025.05.13Updated 2025.05.13

What is $BITCOIN

Discussions

Welcome to the HTX Community. Here, you can stay informed about the latest platform developments and gain access to professional market insights. Users' opinions on the price of BTC (BTC) are presented below.

活动图片