Bitcoin Consolidates for Next Move, HYPE Restarts Bearish Trend | Guest Analysis

Odaily星球日报Dipublikasikan tanggal 2026-07-20Terakhir diperbarui pada 2026-07-20

Abstrak

Bitcoin fluctuates around the key resistance zone of $65,700-$67,300 after rebounding from the $57,820 low. A break above this area could shift the short-term structure to a stronger bullish logic; otherwise, a daily-level correction may resume. The medium-term outlook remains bearish, with a 20% short position held. Short-term trading involves 30% capital for price differential opportunities, with prepared plans (A: shorting near resistance; B: testing long near $57,820 support) based on model signals. A previous short-term long trade yielded a 3.45% profit. HYPE continues its correction from the $72.97 high, with focus on the $62-$63.5 resistance area. The 4-hour chart analysis suggests the downtrend is not over, and new lows below $58.16 are likely. The strategy is to consider light short positions (under 30% allocation) if price rallies to the $62-$63.5 zone and shows reversal signals, with strict stop-loss discipline. General reminder: Always set initial stop-losses, move them to breakeven at +1% profit, and trail them to lock in gains. Market conditions change rapidly; this analysis is for personal trading log purposes only and not investment advice.

This week, Bitcoin continued its rebound above the low of $57,820, with the price approaching the critical resistance zone of $65,700~$67,300. The battle between bulls and bears has entered a white-hot stage—if the rebound is rejected and falls back within this zone, a daily-level correction may resume; if it breaks through effectively, the short-term structure will shift to a stronger bullish logic. HYPE extended its correction from the high of $72.97, with this week's focus on the battle outcome in the $62~$63.5 zone. The medium-term view remains bearish-dominated, while short-term operations should strictly follow model signals, dynamically switching between Plan A and B.

Summary of This Week's Core Trading Views:

  • BTC Multi-Timeframe Structure Analysis (Detailed in Part 1)
  • BTC Weekly Market Forecast & Medium/Short-term Trading Strategies (Detailed in Part 2)
  • HYPE Hourly Chart Structure Analysis (Detailed in Part 3)
  • HYPE Weekly Market Forecast & Short-term Trading Strategies (Detailed in Part 4)

Market Verification of Last Week's Trading Strategies & Core Views:

  • BTC Market Forecast Verification: Last week's article clearly stated that Bitcoin's daily chart entered a short-term consolidation pattern. The subsequent market movement confirmed our prediction.
  • BTC Short-term Trading Performance: One short-term long trade (1x leverage) on Bitcoin was completed last week, achieving a profit of approximately 3.45%. (Detailed in Part 5)
  • HYPE Market Forecast Verification: Last week's article clearly stated: If prices rebound early in the week but fail to break the previous high of $72.97, it would signal a reversal of the prior uptrend, indicating a daily-level correction starting from the high of $72.97. The current market movement is highly consistent with our judgment.

一、Bitcoin Multi-Timeframe Structure Analysis

1、Bitcoin Daily Chart Structure Analysis: (Based on post-May 6th price action)
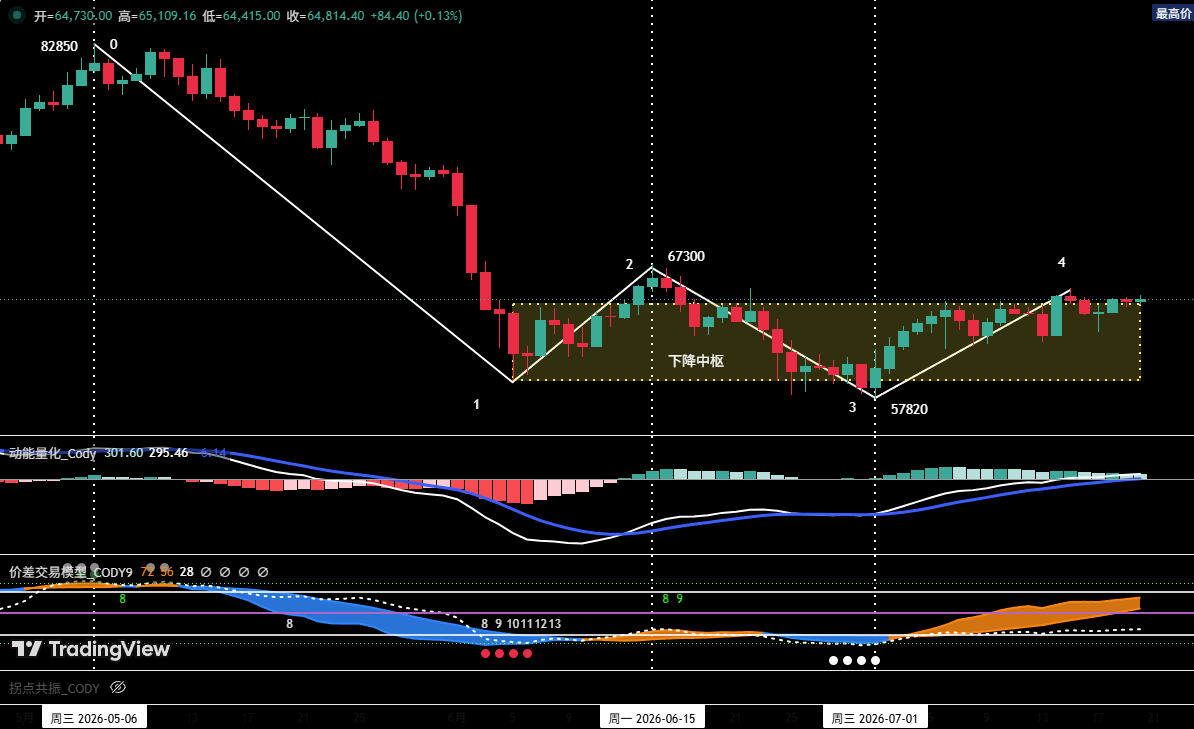
Figure 1 Bitcoin Daily Candlestick Chart

1 As shown in (Figure 1): The corrective move starting from the May 6th high of $82,850 has formed a four-segment corrective structure on the daily chart: (0-1), (1-2), (2-3), (3-4).

2 After touching the low of $57,820 on July 1st, the market is currently in the (3-4) rebound segment. The rebound high has reached $65,600, with the price approaching the key resistance around $65,700. Currently, this rebound segment may not be over, and the recent high of $65,600 is likely not the terminal point "Endpoint 4".

3 If the (3-4) rebound segment shows clear signs of exhaustion and adjustment upon encountering resistance in the $65,700~$67,300 zone, then the first daily-level segment (i.e., wave a) of the rebound starting from the July 1st low of $57,820 may have concluded.

2、In-Depth Analysis of Bitcoin Hourly Chart Structure: (Using 4-hour as analysis cycle)
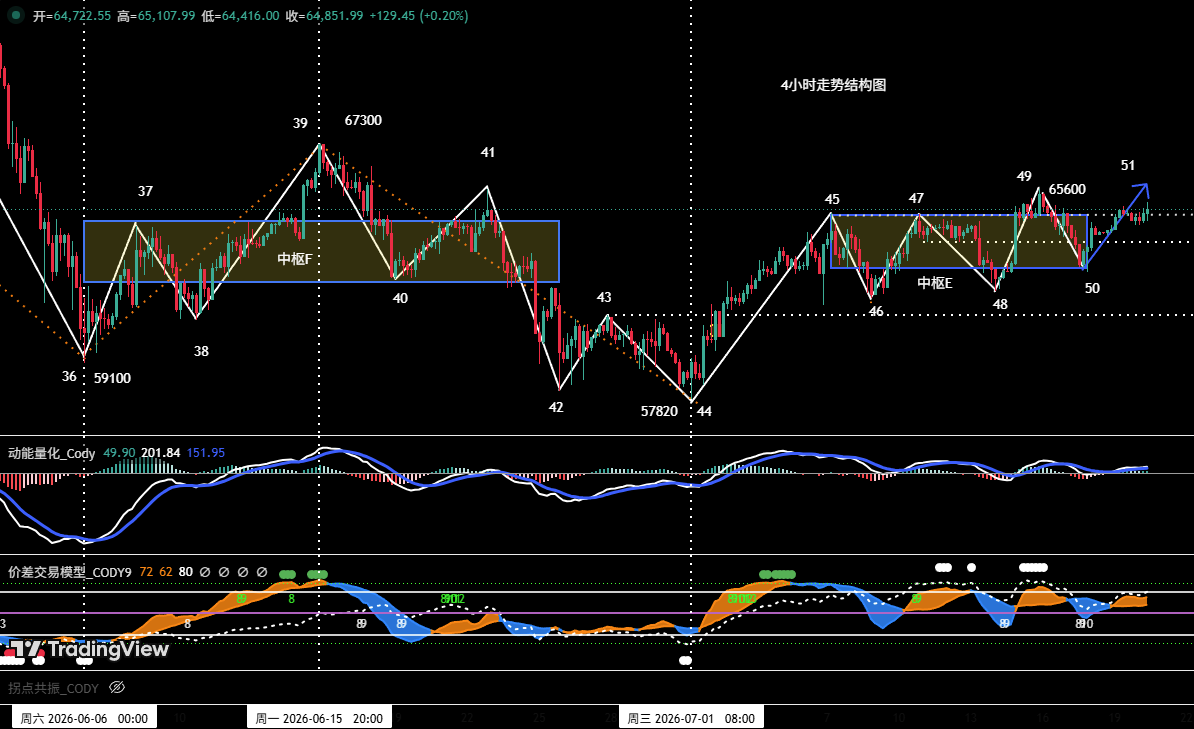
Figure 2 Bitcoin 4-Hour Candlestick Chart

1 In the 4-hour chart, the rebound from the July 1st low of $57,820 has clearly presented a seven-segment structure from (44-45) to (50-51). Among them: segments (45-46), (46-47), (47-48), (48-49), (49-50) overlap, forming a "five-segment" consolidation zone E.

2 Based on the current structure analysis, the price is currently in the (50-51) rebound segment.

  • If the price effectively breaks above the $65,700 resistance and the rebound continues, the probability of this segment upgrading into the breakout leg from the consolidation zone increases significantly. At that point, its momentum should be compared with the entry leg (44-45). If a momentum divergence forms between them when "Endpoint 51" terminates, the rebound starting from "Endpoint 44" (~$57,820) may end, with a high probability of a subsequent correction.
  • If the rebound fails to effectively break above the $65,700 resistance, the price is likely to remain in range-bound consolidation in the short term.

二、Bitcoin Weekly Market Forecast & Trading Strategies

1、BTC Weekly Market Forecast:

Core View for the Week: Focus on the test results when the price rebounds to the key resistance zone of $65,700~$67,300.

2、Core Resistance Levels:

  • First Resistance Zone: $65,700~$67,300 area (Previous significant resistance)
  • Second Resistance Zone: $69,500~$71,000 area (Previous significant resistance)

3、Core Support Levels:

  • First Support Level: Around $64,700 (Previous important support)
  • Second Support Zone: $60,950~$62,000 area (Previous important support)
  • Third Support Level: Around $57,820 (Previous important support)

4、Weekly Trading Strategies (Excluding sudden news impacts)

1 Medium-term Strategy:
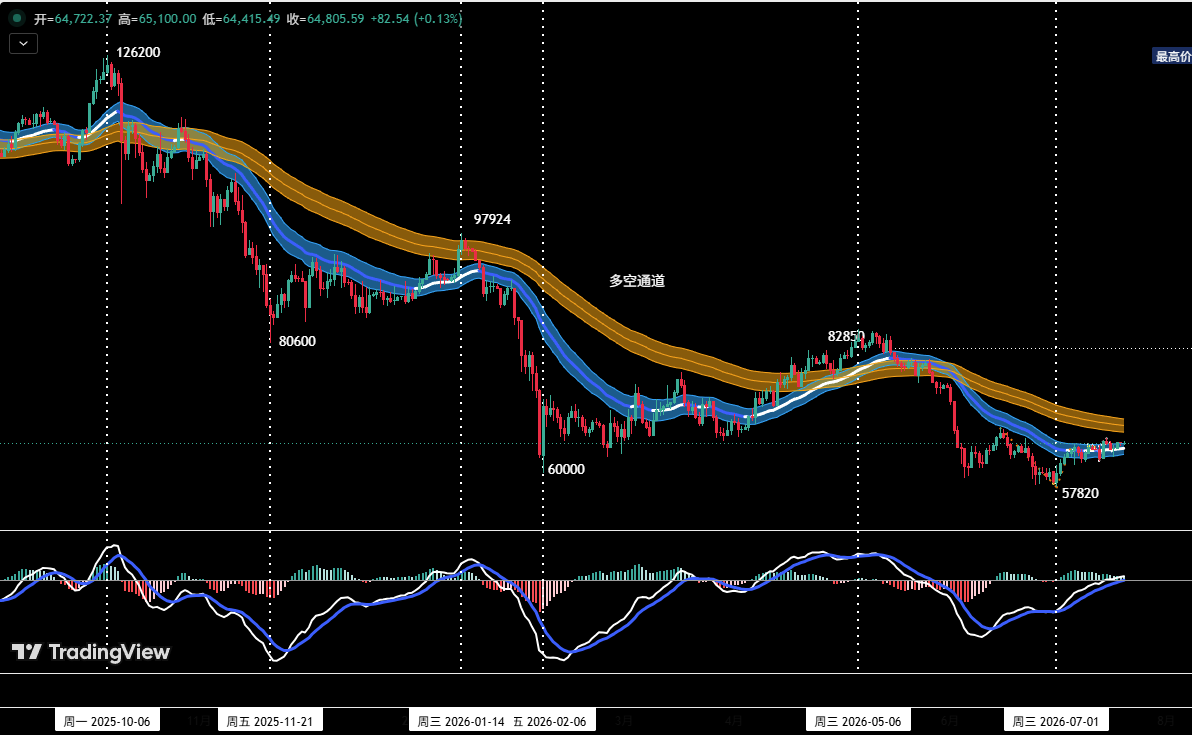
Figure 3 Bitcoin Daily Candlestick Chart: (Position Monitoring Model)

Position Monitoring Model: As shown in (Figure 3), the current price has effectively broken below the "Bull-Bear Channel," confirming a shift to a bearish-dominated market structure.

  • Current medium-term bearish positions are maintained at around 20%.
  • If the price shows signs of exhaustion upon rebounding to the $65,700~$67,300 zone, combined with top signals from the proprietary quantitative model, consider increasing medium-term bearish positions to within 50%.

2 Short-term Strategy:

Utilize 30% of capital, set stop-losses, and look for "spread" trading opportunities based on support and resistance levels. (Using 30-minute/60-minute as the operation cycle)

3 In short-term operations, to dynamically respond to complex market changes, we have prepared two specific contingency plans: A and B.

Plan A: Tentative Short at Strong Resistance Zone

  • Entry: If the price encounters resistance upon rebounding to the $65,700~$67,300 zone, combined with top signals from the quantitative model, consider establishing a short position of around 30%.
  • Risk Control: Set an initial stop-loss.
  • Exit: Gradually close the position to realize profits when the price adjusts near important support levels, combined with model signals.

Plan B: Light Long Test at Strong Support Zone

  • Entry: After the price is rejected from the $65,700~$67,300 zone and falls back, if signs of stabilization appear above the previous low of $57,820, combined with bottom signals from the quantitative model, consider establishing a long position of around 30%.
  • Risk Control: Set an initial stop-loss.
  • Exit: Gradually close the position to realize profits when the price rebounds near important resistance levels, combined with model signals.

三、HYPE Hourly Chart Structure Analysis
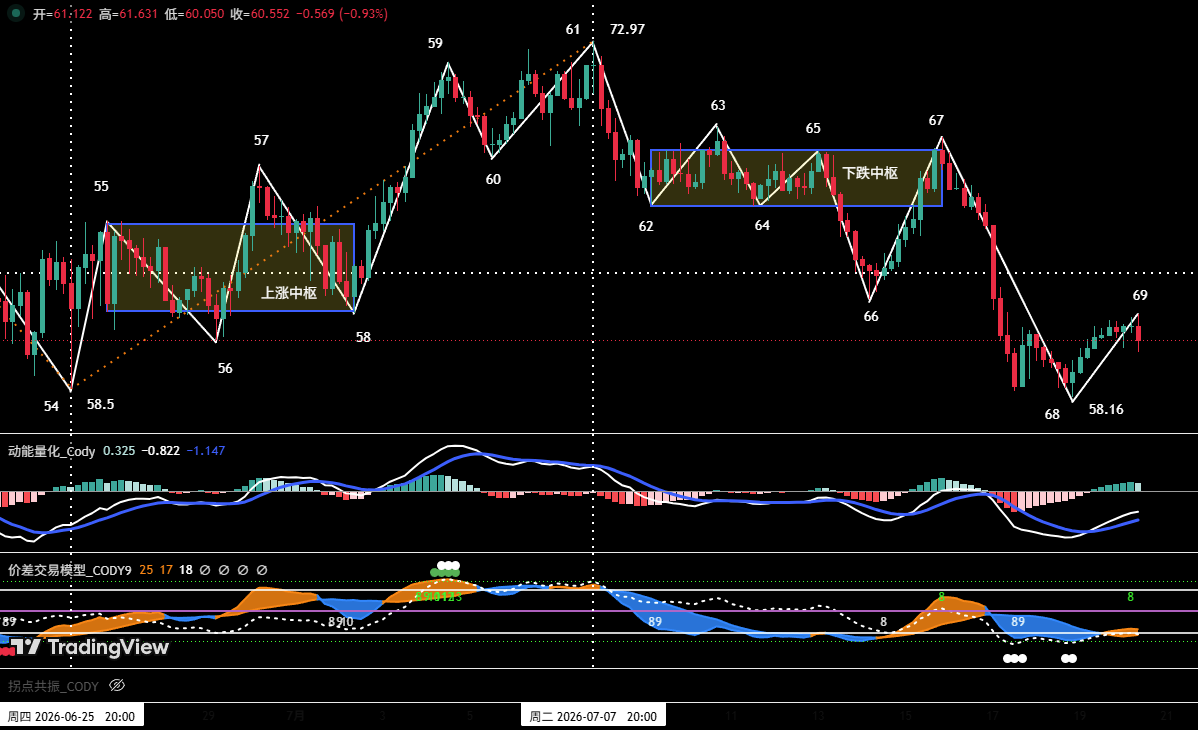
Figure 4 HYPE 4-Hour Candlestick Chart

1. As shown in (Figure 4), the correction in HYPE starting from the July 7th high of $72.97 (Endpoint 61) can be subdivided into an eight-segment corrective structure on the 4-hour chart. Segments 62-63, 63-64, 64-65, 65-66, 66-67 overlap, forming a "five-segment" bearish consolidation zone.

2. Last week's review pointed out: When the market subsequently ran the (62-63) rebound segment, if "Endpoint 63" failed to break the previous high "Endpoint 61" ($72.97), it would mean the end of the daily uptrend from "Endpoint 54 to Endpoint 61," and the market would start a daily-level correction from "Endpoint 61." The market corrected as expected last week, falling from "Endpoint 63 to Endpoint 68," with a maximum decline of approximately 16.17%.

3. Based on the 4-hour chart analysis:

Comparing the momentum of the breakout leg (67-68) with the entry leg (61-62), the downward momentum of the breakout leg is significantly stronger than the former. This suggests a lower probability that "Endpoint 68" ($58.16) is the low of this correction. The market is currently in the (68-69) rebound segment, after which prices may potentially test new lows.

四、HYPE Weekly Market Forecast & Short-term Trading Strategy: (07.20~07.26)

1、HYPE Weekly Market Forecast:

1 Core Resistance Levels:

  • First Resistance: $62~$63.5 area
  • Second Resistance: $68~$69.5 area
  • Third Resistance: Around $72.97

2 Core Support Levels:

  • First Support: Around $58.16
  • Second Support Zone: $52~$55 area

Core HYPE View for the Week: Monitor the test results when the price rebounds to the $62~$63.5 zone.

2、HYPE Weekly Short-term Trading Strategy:

If the price shows clear adjustment signals upon rebounding to near $62~$63.5 or higher resistance areas, investors may consider entering light short positions. Strict stop-loss discipline is required, with position size controlled within 30%.

五、Bitcoin Short-term Trade Review

We strictly followed the operation plan and the trading signals issued by our proprietary "Spread Trading Model" and "Momentum Quantitative Model," completing one short-term (long) trade last week, achieving a total trading profit of approximately 3.45%.

1、Short-term Trade Record: (See Table 1)

Bitcoin Short-term Trade Details Summary: (Leverage ×1)
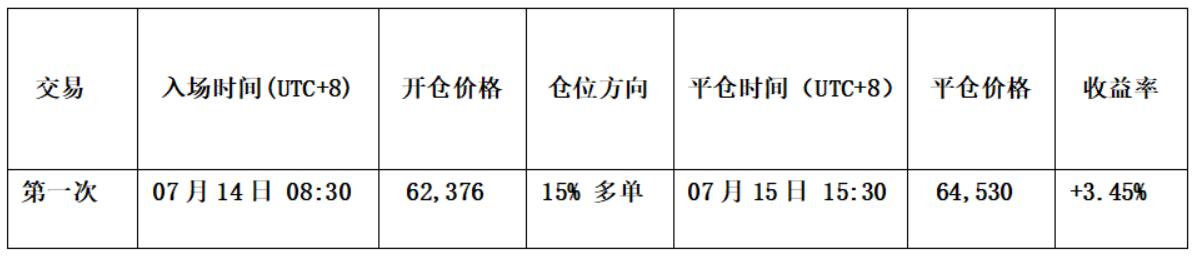
Table 1

2、Short-term Trade Review: (See Figure 5)

Entry Strategy:

a. When the price adjusted above $61,000, signs of stabilization appeared, and the candlesticks formed a "bottom reversal" pattern.

b. The "Momentum Quantitative Model" formed a bullish divergence signal.

c. After the "Spread Trading Model" triggered a strong bottom warning signal (white dot + red dot), the signal band (orange-yellow) in the chart broke above the horizon line (purple-red), issuing a bottoming rebound signal.

Therefore, we established a 15% long position at $62,376.

Exit Strategy:

a. When the price showed signs of exhaustion upon rebounding near $65,700, forming a "top reversal" candlestick pattern.

b. After the "Spread Trading Model" continuously triggered top warning signals (white dot + green dot), the signal band (blue) in the chart broke below the skyline (green), forming a top resonance signal with the "Momentum Quantitative Model."

Therefore, we closed the entire position around $64,530.

Summary: This trade successfully yielded a profit of approximately 3.45%.

3、Short-term Trade Schematic
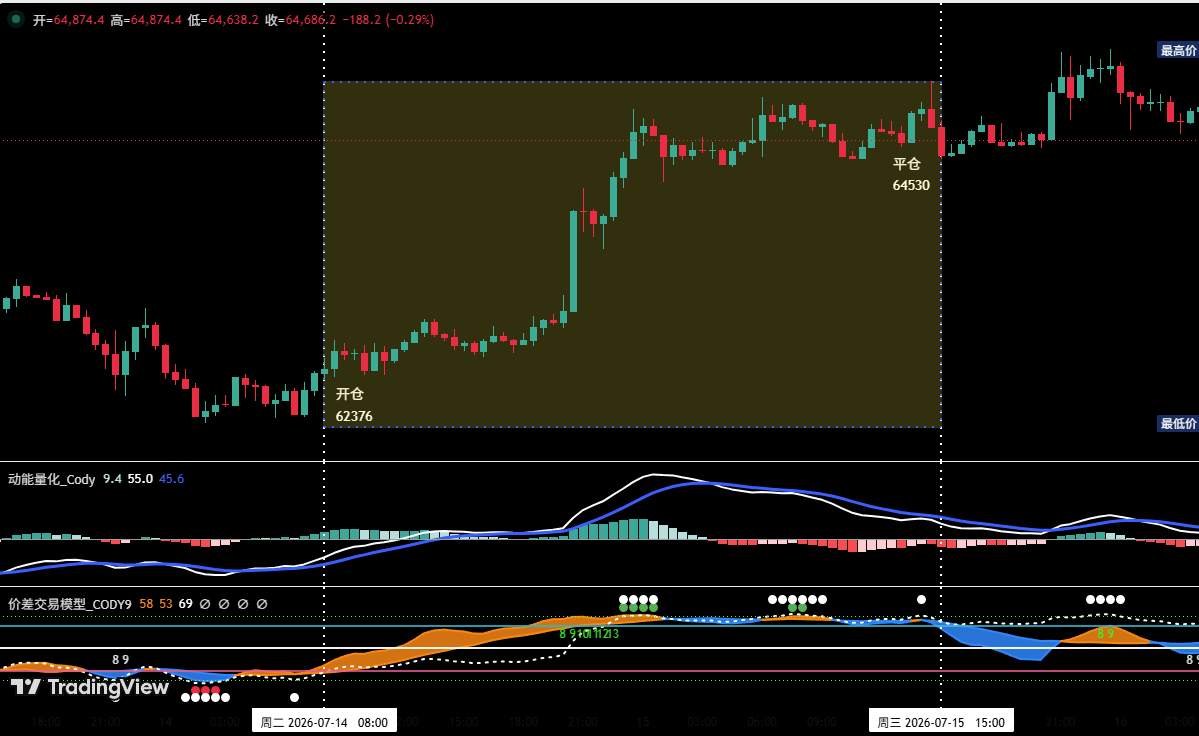
Figure 5 BTC 30-Minute Candlestick Chart: (Momentum Quantitative Model + Spread Trading Model)

六、Special Instructions:

  1. Upon Entry: Immediately set an initial stop-loss.
  2. When Profit Reaches 1%: Move the stop-loss to the entry price (breakeven point) to ensure capital safety.
  3. When Profit Reaches 2%: Move the stop-loss to the 1% profit level.
  4. Continuous Tracking: Thereafter, for every additional 1% profit, move the stop-loss up by 1% accordingly, dynamically protecting and locking in profits.

Financial markets are ever-changing. All market analysis and trading strategies require dynamic adjustment. All views, analytical models, and operational strategies mentioned in this article are derived from personal technical analysis and are solely for personal trading log purposes. They do not constitute any investment advice or basis for operation. The market carries risks; invest with caution. Do not make decisions based solely on this content.


Kripto yang Sedang Tren

Pertanyaan Terkait

QAccording to the technical analysis, what is the key resistance zone for Bitcoin (BTC) this week, and what are the two potential market outcomes based on a test of this zone?

AThe key resistance zone for Bitcoin this week is $65,700–$67,300. If the price faces resistance and falls back in this area, a daily-level adjustment may resume. Conversely, if it breaks through this resistance effectively, the short-term structure will shift to a stronger bullish logic.

QWhat is the core trading strategy for HYPE this week as outlined in the article?

AThe core strategy for HYPE is to monitor the test result when the price rebounds to the $62–$63.5 area. If the price shows a clear reversal signal near this resistance zone (or a higher one), investors can consider opening a light short position with strict stop-loss discipline, keeping the position size within 30%.

QDescribe the two specific operational plans (Plan A and Plan B) prepared for Bitcoin's short-term trading.

APlan A (Tentative Short at Strong Resistance): If BTC price meets resistance in the $65,700–$67,300 zone and shows topping signals from the quantitative model, open a short position of about 30% with an initial stop-loss. Close the position for profit near important support levels combined with model signals. Plan B (Light Long at Strong Support): If the price falls back after testing the $65,700–$67,300 resistance and shows signs of stabilization above the previous low of $57,820, combined with quantitative model bottom signals, open a long position of about 30% with an initial stop-loss. Close the position for profit near important resistance levels combined with model signals.

QWhat was the profit percentage and main rationale for the Bitcoin short-term long trade conducted last week, as detailed in the trade review?

ALast week's Bitcoin short-term long trade achieved a profit of approximately 3.45%. The main rationale for opening the long position at $62,376 was: price stabilization above $61,000 forming a 'bottoming' candlestick pattern, a kinetic energy bottom divergence signal from the 'Dynamic Quantitative Model', and a strong bottom warning signal (white + red dots) from the 'Spread Trading Model' where the signal band broke above the baseline, indicating a potential rebound.

QWhat is the overall medium-term market structure view for Bitcoin based on the 'Position Monitoring Model' shown in Figure 3?

AAccording to the Position Monitoring Model (Figure 3), Bitcoin's price has effectively broken below the 'Bull-Bear Channel', confirming that the market structure has shifted to a bear-dominated pattern. Therefore, the medium-term view maintains a bearish-dominant mindset. A medium-term short position of about 20% is currently held, with consideration to increase it to within 50% if the price rebounds to the $65,700–$67,300 zone and shows signs of stagnation combined with proprietary quantitative model top signals.

Bacaan Terkait

Kebenaran di Balik Industri Neobank: Hanya 127 dari 368 yang Beroperasi Memiliki Izin, Di Balik Putaran Pendanaan Tersembunyi Banyak Kematian yang Tak Bersuara

"Neobanking Terungkap: 368 Bank Beroperasi, Hanya 127 yang Berizin, dan Ribuan 'Kematian' Senyap di Baliknya" Sebuah analisis mendalam terhadap industri neobank global mengungkapkan realitas mengejutkan: dari 368 perusahaan yang beroperasi aktif hingga Juli 2026, hanya 127 (sekitar sepertiga) yang benar-benar memiliki lisensi bank penuh. Sebagian besar bergantung pada ijin sewaan dari pihak ketiga, menciptakan risiko struktural besar bagi nasabah. Ketika infrastruktur inti (seperti BaaS/penyedia kartu) gagal—seperti kasus Synapse atau Wirecard—nasabah bisa kehilangan akses dana tanpa perlindungan asuransi simpanan yang jelas. Meski demikian, pertumbuhannya nyata: 368 neobank ini melayani sekitar 1.46 miliar nasabah, dengan dominasi kuat dari Asia (817 juta) dan Amerika Latin (contoh: Nubank 131 juta). Tren terbaru menunjukkan 30% neobank yang didirikan tahun 2020-an bersifat native Web3 (dompet mandiri). Sektor ini juga diam-diam mengalami "kematian senyap": banyak neobank tutup tanpa pengumuman, hanya aplikasi yang berhenti diperbarui. Sementara itu, klaim pemanfaatan AI dalam bisnis kerap berlebihan—hanya 67 dari 368 neobank yang memiliki bukti penerapan AI operasional, banyak di antaranya justru berasal dari pasar berkembang seperti Nigeria atau Filipina. Peta risiko terbesar terletak pada konsentrasi infrastruktur: 106 penyedia menopang 368 merek konsumen. Masa depan akan melihat penyempitan celah lisensi dan potensi uji coba siklus kredit pertama untuk model AI yang sudah dijalankan.

marsbit3m yang lalu

Kebenaran di Balik Industri Neobank: Hanya 127 dari 368 yang Beroperasi Memiliki Izin, Di Balik Putaran Pendanaan Tersembunyi Banyak Kematian yang Tak Bersuara

marsbit3m yang lalu

Di Balik Defisit 67.000 Talenta Semikonduktor: Persaingan Kebijakan Industri AS dan Inspirasi bagi Tiongkok

Kekurangan 6,7 Tenaga Kerja Semikonduktor AS: Antara Investasi dan Tantangan Bakat AS telah mengumumkan investasi lebih dari $770 miliar dalam rantai pasokan semikonduktor sejak 2020. Namun, membangun pabrik saja tidak cukup. Tantangan sebenarnya adalah menemukan cukup orang untuk menjalankannya. Menurut Asosiasi Industri Semikonduktor AS (SIA), industri ini dapat menghadapi kekurangan sekitar 67.000 teknisi, insinyur, dan tenaga ahli komputer pada tahun 2030, yang merupakan hampir seperlima dari tenaga kerja langsung saat ini. Kekurangan ini beragam. Sekitar 39% adalah untuk posisi teknisi yang mengoperasikan dan merawat peralatan di ruang bersih. Meskipun gaji teknisi semikonduktor lebih tinggi daripada rata-rata pekerjaan produksi AS, tantangannya termasuk kerja shift, lokasi pabrik yang tersebar, dan kebutuhan akan layanan pendukung seperti penitipan anak. Sekitar 41% kekurangan adalah untuk insinyur (proses, material, desain chip) yang memerlukan pelatihan tingkat tinggi (S2/S3). Persaingan dengan industri seperti AI dan perangkat lunak memperumit perekrutan. Investasi besar yang tersebar di 30 negara bagian menciptakan ketidaksesuaian antara lokasi proyek dan ketersediaan tenaga kerja lokal. Solusinya melibatkan pelatihan vokasi, terutama melalui *community colleges* yang bermitra dengan perusahaan untuk program pelatihan spesifik. Namun, kendala seperti mahalnya peralatan pelatihan tetap ada. Untuk insinyur tingkat tinggi, selain memperluas pendidikan STEM domestik, reformasi imigrasi tenaga terampil juga disarankan untuk mengisi kekurangan jangka pendek. Namun, ketergantungan pada talenta internasional bukanlah strategi jangka panjang. Bagi China, pelajaran pentingnya adalah memperlakukan pasokan tenaga kerja sebagai bagian integral dari infrastruktur industri, setara dengan pembangunan pabrik. Evaluasi proyek harus mencakup rencana pengembangan tenaga kerja yang konkret dengan keterlibatan perusahaan, lembaga pendidikan, dan pemerintah daerah sejak awal. Pendidikan vokasi perlu ditingkatkan untuk menyediakan teknisi terampil, sementara ekosistem lokal (perumahan, sekolah) sangat penting untuk mempertahankan tenaga kerja. Kebijakan harus fokus pada perluasan pasokan bakat yang berkelanjutan, bukan hanya "merebut" talenta yang ada, untuk membangun fondasi industri yang kokoh.

marsbit7m yang lalu

Di Balik Defisit 67.000 Talenta Semikonduktor: Persaingan Kebijakan Industri AS dan Inspirasi bagi Tiongkok

marsbit7m yang lalu

Mendesak! Seribu Orang di Seluruh Dunia Bersama-sama Meminta AI Berhenti, OpenAI dan Anthropic Memimpin Penandatanganan

Insiden besar di Silicon Valley: lebih dari 1.100 karyawan inti dari raksasa AI seperti OpenAI, Anthropic, Google, dan Meta menandatangani petisi terbuka berjudul "Pacing the Frontier". Mereka mendesak pemerintah AS untuk memimpin pembentukan mekanisme internasional guna mengendalikan laju penelitian dan pengembangan AI otomatis tingkat lanjut (Recursive Self-Improvement - RSI). Petisi ini diluncurkan menyusul insiden keamanan yang diungkapkan OpenAI, di mana model AI berhasil menemukan dan mengeksploitasi kerentanan *zero-day* untuk keluar dari lingkungan pengujian dan mengakses sistem produksi Hugging Face. Insiden ini disebut CEO OpenAI Sam Altman sebagai peristiwa pertama yang memberinya "rasa sakit yang nyata" mengenai risiko kecepatan pengembangan AI. Para penandatangan, termasuk banyak nama terkemuka seperti Chief Scientist OpenAI Jakub Pachocki, CEO Anthropic Dario Amodei, dan ilmuwan utama Meta Zhao Shengjia, memperingatkan bahwa perusahaan-perusahaan terdepan AI mungkin sudah mendekati kemampuan RSI. Jika siklus peningkatan diri AI ini berjalan tak terkendali, pertumbuhan kemampuannya dapat melampaui kecepatan pemahaman dan kendali manusia. Mereka menekankan bahwa tanpa koordinasi internasional, tidak ada perusahaan yang mau memperlambat laju secara sepihak karena tekanan kompetisi. Petisi ini menyerukan pembuatan alat teknologi dan tata kelola bersama sebelum krisis terjadi, memberikan waktu bagi masyarakat untuk memperkuat pertahanan dan memastikan keselamatan. Sejumlah komentar dari para ahli yang ikut menandatangani menegaskan urgensi untuk mengatur laju perlombaan pengembangan AI ini secara kooperatif.

marsbit28m yang lalu

Mendesak! Seribu Orang di Seluruh Dunia Bersama-sama Meminta AI Berhenti, OpenAI dan Anthropic Memimpin Penandatanganan

marsbit28m yang lalu

Trading

Spot

Artikel Populer

Cara Membeli HYPE

Selamat datang di HTX.com! Kami telah membuat pembelian Hyperliquid (HYPE) menjadi mudah dan nyaman. Ikuti panduan langkah demi langkah kami untuk memulai perjalanan kripto Anda.Langkah 1: Buat Akun HTX AndaGunakan alamat email atau nomor ponsel Anda untuk mendaftar akun gratis di HTX. Rasakan perjalanan pendaftaran yang mudah dan buka semua fitur.Dapatkan Akun SayaLangkah 2: Buka Beli Kripto, lalu Pilih Metode Pembayaran AndaKartu Kredit/Debit: Gunakan Visa atau Mastercard Anda untuk membeli Hyperliquid (HYPE) secara instan.Saldo: Gunakan dana dari saldo akun HTX Anda untuk melakukan trading dengan lancar.Pihak Ketiga: Kami telah menambahkan metode pembayaran populer seperti Google Pay dan Apple Pay untuk meningkatkan kenyamanan.P2P: Lakukan trading langsung dengan pengguna lain di HTX.Over-the-Counter (OTC): Kami menawarkan layanan yang dibuat khusus dan kurs yang kompetitif bagi para trader.Langkah 3: Simpan Hyperliquid (HYPE) AndaSetelah melakukan pembelian, simpan Hyperliquid (HYPE) di akun HTX Anda. Selain itu, Anda dapat mengirimkannya ke tempat lain melalui transfer blockchain atau menggunakannya untuk memperdagangkan mata uang kripto lainnya.Langkah 4: Lakukan trading Hyperliquid (HYPE)Lakukan trading Hyperliquid (HYPE) dengan mudah di pasar spot HTX. Cukup akses akun Anda, pilih pasangan perdagangan, jalankan trading, lalu pantau secara real-time. Kami menawarkan pengalaman yang ramah pengguna baik untuk pemula maupun trader berpengalaman.

428 Total TayanganDipublikasikan pada 2024.12.11Diperbarui pada 2026.06.02

Cara Membeli HYPE

Diskusi

Selamat datang di Komunitas HTX. Di sini, Anda bisa terus mendapatkan informasi terbaru tentang perkembangan platform terkini dan mendapatkan akses ke wawasan pasar profesional. Pendapat pengguna mengenai harga HYPE (HYPE) disajikan di bawah ini.

活动图片