Why Do Memes Only Cut You? An Article That Explains Their True Growth Mechanism

比推Dipublikasikan tanggal 2026-01-21Terakhir diperbarui pada 2026-01-21

Abstrak

The article "Why Do Meme Coins Only 'Cut' You? Clarifying Their True Growth Mechanism" offers a fresh, analytical perspective on meme coin dynamics, framing their growth not as irrational speculation but as a mathematically explainable phenomenon. The core argument is that a meme coin’s market capitalization isn't just driven by price increases (Z-axis), but is fundamentally supported and "propped up" by two underlying factors: narrative density (X-axis) and the network of传播 nodes (Y-axis). Together, these form the base radius of a "Wealth Cone." A meme with only height (price) but no base (narrative and community) is like a thin needle—easily toppled. A strong, expanding base is necessary to support sustainable, exponential growth. The proposed XYZ three-dimensional growth spiral model explains the interaction: * **X-axis (Narrative Density):** The meme's core idea, cultural resonance, originality, and the richness of community-created content. * **Y-axis (Propagation Network):** The transmission pipelines, from major influencers (e.g., Elon Musk) to KOLs and finally to retail investors. * **Z-axis (Capital Flow):** The monetization of attention, measured by market cap, trading volume, and crucially, liquidity depth. The lifecycle of a successful meme is a reflexive, spiral ascent through stages: **Ignition** (a Y-axis spike from a KOL callout lifts the Z-axis), **Spin** (price growth attracts more discussion, enriching the narrative), and **Ascension** (an expande...

Author: danny

Original Title:

Why Do the Memes You Buy Only Fall? — Deconstructing the Growth Spiral and Volume of Memes Using First Principles


In the eyes of most people, Meme coins are irrational狂欢, a fool's赌场. But from a mathematical perspective, the birth of every ten-thousand-fold myth is not accidental; it is actually a middle school spatial geometry evolution word problem.

This article proposes a颠覆性的 perspective: The market value of Meme coins is not "grown" but "propped up." The value of Memes can be calculated!

We are accustomed to focusing on the fluctuations of the Z-axis (price height), but we overlook that what determines life and death is the base radius constructed by the X (narrative density) and Y (propagation nodes) axes. A Meme with only height and no base is just a very thin "needle" that topples with the wind; only by continuously expanding the consensus radius can it support a stable, geometrically growing wealth cone under the gravity of capital.

Note: This article is a popular science article on "financial physics," not a rigorous econometric paper, and is only intended to provide a new perspective for viewing Memes.

1. The Beginning of the Theory: The Three-Dimensional Coordinate System of Memes

In the current cryptocurrency market, Meme coins are often seen as irrational狂欢. But is that really the case?

If we strip away the noise of emotions, KOL shilling, and community bandwagoning, we will find that the birth and death of every phenomenal Meme follows a strict mathematical logic.

The essence of Meme coins is the tokenization of the attention economy. Their market value is not determined by traditional discounted cash flow (DCF) but is jointly constructed by the breadth of the narrative, community resonance, and the explosive power of funds.

For better discussion, we define these factors as the XYZ three-dimensional growth spiral model.

These three axes are not just independent variables; there is a strong reflexivity between them—that is, a change in one variable reinforces another, forming a positive feedback loop.

Let's explain these parameters:

X-axis: Narrative Density and Cultural Memes

Definition: The "genes" of a Meme. Includes the core梗 (e.g., Doge), origin story (e.g., CZ's pet name), cultural symbols (e.g., Pepe the Frog), and the richness of community二次创作.

Key metrics: Narrative originality, replicability, emotional resonance.

Y-axis: Propagation Potential and Node Network

Definition: The transmission pipeline of information. From top-tier nodes (CZ, Elon Musk) to secondary nodes (Alpha Callers, KOLs), and then to end nodes (ordinary retail investors).

Key metrics: Node weight, propagation coverage, shilling frequency.

Z-axis: Fund Flow and Liquidity Carrier

Definition: The monetization result of attention. Includes on-chain fund inflows, liquidity depth—i.e., the沉淀的价值 or the total amount of sell orders that can be承接.

Key metrics: Market capitalization, trading volume, turnover rate, and liquidity (the most important metric).

2. Diagram of the Growth Curve of XYZ Axis Interaction

If we plot these three axes in three-dimensional space, the growth trajectory of a successful Meme will generally show a spiral upward trend: (as shown in the figure below)
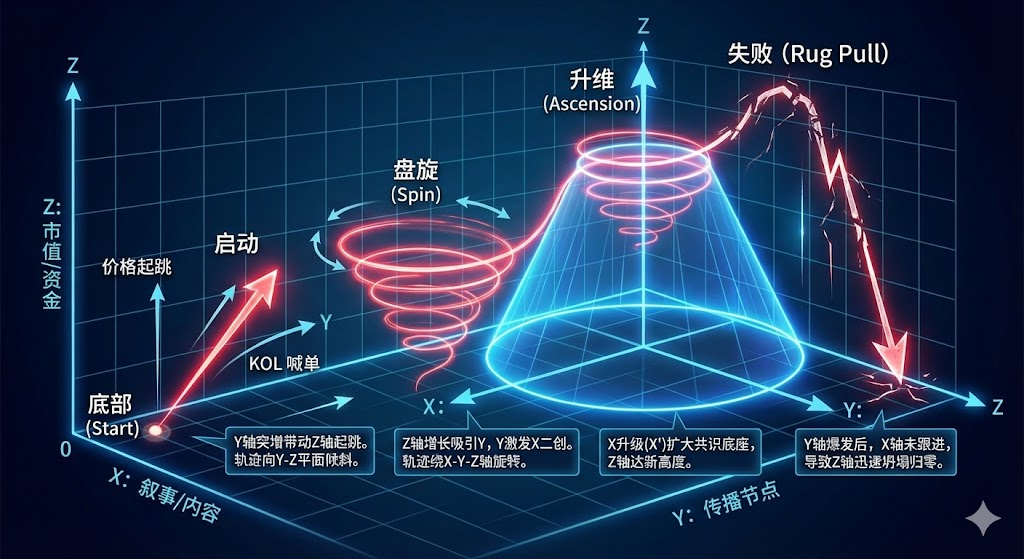
Bottom (Start): X, Y, Z are all close to zero.

Ignition: The Y-axis surges (KOL shilling), driving the Z-axis (price) to jump. The trajectory line tilts toward the Y-Z plane.

Spin: The growth of the Z-axis attracts more Y (more people discussing), and Y stimulates X's二次创作 (enriching content). The trajectory line begins to rotate around the X-Y-Z axes.

Ascension: As X is upgraded (X'), the base area of the cone expands (broader consensus range), and the Z-axis (market capitalization) reaches a new height.

Failed Meme (Rug Pull): Usually表现为 the Y-axis爆发后, the Z-axis briefly rises, but the X-axis fails to follow up with an upgrade (narrative scarcity), causing the Z-axis to quickly collapse to zero. The trajectory line shows an inverted V-shaped fall.

3. Evolution of the Growth Curve: The Spiral Ascension of Four Stages

From the previous section, we know that the lifecycle of a Meme is not linear but a vortex that continuously expands around the Z-axis (fund flow). In this section, we will analyze it based on the four development stages of Memes.

The figure below shows its standard evolution path: (I was also shocked at how cool AI drew it?!)


Original link:https://www.bitpush.news/articles/7604686

Pertanyaan Terkait

QWhat is the core perspective proposed in the article regarding the growth of Meme coins?

AThe article proposes that Meme coin market capitalization is not simply 'rising' but is 'propped up' by a mathematical model involving narrative density (X-axis) and propagation nodes (Y-axis), which together form the base supporting the value (Z-axis).

QHow does the article define the X-axis in its Meme growth model?

AThe X-axis is defined as 'Narrative Density and Cultural Memes,' which includes the core meme, origin story, cultural symbols, and the richness of community-created content.

QAccording to the article, what is the role of the Y-axis in the Meme coin growth spiral?

AThe Y-axis represents 'Propagation Potential and Node Network,' which refers to the information transmission pipelines, from top nodes like influencers to secondary and end nodes like ordinary retail investors.

QWhat does the Z-axis represent in the XYZ model for Meme coins?

AThe Z-axis represents 'Capital Flow and Liquidity Carrier,' which is the monetization result of attention, including on-chain capital inflow, liquidity depth, and the total value that can absorb selling pressure.

QWhat is the key difference between a successful Meme and a failed one (Rug Pull) according to the model?

AA successful Meme undergoes a spiral ascent where narrative (X) and propagation (Y) expand to support the value (Z). A failed Meme (Rug Pull) sees a brief spike in Y and Z, but a lack of narrative development (X) causes the value to collapse back to zero.

Bacaan Terkait

Dari Emas ke Bitcoin: Pasokan Tetap + Demam Lembaga, Akankah Menghasilkan Pergerakan Harga 'Eksplosif' yang Serupa?

Dari Emas ke Bitcoin: Pasokan Tetap + Demam Institusi, Akankah Ulangi Skenario Kenaikan Harga 'Eksplosif'? Analis memprediksi ETF Bitcoin dapat mengikuti pola historis ETF emas dalam perjalanan harganya, menawarkan roadmap potensial untuk investasi jangka panjang. Sejak peluncuran ETF emas pada 2004, harganya melambung dengan kapitalisasi pasar mendekati $28 triliun. Mirip dengan emas, Bitcoin adalah alat penyimpan nilai non-produktif yang harganya digerakkan oleh sentimen investor. ETF spot Bitcoin, disetujui awal 2024, dengan cepat menjadi salah satu ETF dengan pertumbuhan tercepat, menarik lembaga Wall Street. Namun, volatilitas tetap tinggi. Misalnya, dana IBIT BlackRock telah menjual hampir 100.000 Bitcoin untuk memenuhi penebusan, mencerminkan dampak signifikan dari arus modal institusional. Pola historis ETF emas menunjukkan fase kenaikan tajam, penurunan yang menyakitkan, dan pemulihan yang membutuhkan kesabaran, dengan setiap siklus menciptakan level tertinggi baru. Analis melihat "kemiripan spiritual" antara keduanya: kedua aset memiliki pasokan yang hampir tetap, di mana lonjakan permintaan dapat memicu kenaikan harga eksplosif, tetapi permintaan ini seringkali berubah-ubah seperti gelombang. Keyakinan jangka panjang tetap kuat. Minat institusi yang terus berlanjut, melalui aliran masuk ETF yang stabil dan adopsi perusahaan, dilihat sebagai penyangga utama yang membantu mengurangi tekanan jual. Jika Bitcoin dapat mencapai sebagian kecil dari kapitalisasi pasar emas sebagai penyimpan nilai, potensi apresiasinya masih sangat besar. Namun, perjalanan ini dipastikan akan diwarnai volatilitas tinggi. Bagi investor, kuncinya adalah rasionalitas, diversifikasi, dan fokus pada tren jangka panjang.

Foresight News3m yang lalu

Dari Emas ke Bitcoin: Pasokan Tetap + Demam Lembaga, Akankah Menghasilkan Pergerakan Harga 'Eksplosif' yang Serupa?

Foresight News3m yang lalu

Mengapa Agensi Belanja AI Sulit Populer?

AI berbelanja sebagai wakil belum dapat diterima luas karena menghadapi beberapa tantangan mendasar. Pertama, berbelanja terdiri dari dua tindakan inti: pencarian informasi dan penilaian nilai. Mesin dapat menangani pencarian informasi, tetapi penilaian nilai melibatkan preferensi subjektif manusia yang sulit didelegasikan sepenuhnya. Penilaian nilai sendiri memiliki dua lapisan: evaluasi berdasarkan kriteria yang ditetapkan, dan yang lebih penting, **pendefinisian kebutuhan itu sendiri**—menentukan kriteria, bobot, dan batasan. Preferensi manusia bersifat konstruktif dan berubah, bukan statis, sehingga memerlukan komunikasi iteratif dengan AI. Kedua, batasan sesungguhnya bukan pada standarisasi barang, tetapi apakah proses memilih itu sendiri merupakan **tugas rutin atau kesenangan**. Untuk barang seperti perlengkapan kantor (tugas rutin), AI dapat sepenuhnya otomatis. Namun, untuk barang seperti anggur atau pakaian (kesenangan), proses memilih adalah bagian dari pengalaman konsumsi. Di sini, peran AI idealnya adalah penyaring informasi, menyajikan beberapa pilihan terbaik kepada manusia untuk keputusan akhir. Ketiga, ada dilema interaksi: AI yang bertanya terlalu banyak dapat mengganggu dan mendistorsi pilihan; mengandalkan riwayat belanja dapat membatasi eksplorasi baru; dan keputusan sepenuhnya manual itu melelahkan. Solusi tengah adalah **interaksi pengenalan**, di mana AI menunjukkan beberapa opsi dan pengguna langsung memilih. Narasi "memberi dompet kepada AI" yang menekankan pembayaran otomatis pun keliru. Pembayaran hanyalah bagian termudah. Solusi pembayaran terkini (seperti dari Stripe, Mastercard, Google, Visa) memisahkan **otorisasi pengguna** dari **eksekusi pembayaran terbatas AI**, tanpa perlu menyerahkan dana sepenuhnya. Dompet AI otonom lebih cocok untuk skenario **B2B atau M2M** (mis., pembelian perusahaan standar, penyelesaian antar-mesin), bukan belanja konsumen personal. **Kendala sebenarnya** bukan pada pembayaran, melainkan pada: (1) **Kurangnya sumber data tepercaya** (ulasan palsu, barang palsu) yang menjadi dasar keputusan AI, dan (2) **Hak manusia untuk mendefinisikan kebutuhan tidak dapat diotomatisasi**. Mendelegasikan definisi ini kepada AI berarti kehilangan preferensi asli. Kesimpulannya, untuk barang yang dinikmati, **pilihan itu sendiri adalah produk**. Platform harus mengoptimalkan data terstruktur untuk AI sambil mempertahankan keunggulan inti: memfasilitasi eksplorasi konsumen baru dan pengalaman memilih yang menyenangkan. AI harus menjadi asisten pencarian informasi yang aman dan terkendali, sementara manusia tetap memegang kendali atas standar penilaian dan kesenangan memilih akhir.

Foresight News1j yang lalu

Mengapa Agensi Belanja AI Sulit Populer?

Foresight News1j yang lalu

Setelah 9 Bulan Short, Beralih Lengkap ke Long, Trader Terkenal Buka Posisi Bitcoin di Sekitar 64k, Sentimen Bullish vs Bearish Terbelah di Pasar Kripto

Seorang trader kripto terkenal, Doctor Profit, yang berhasil memprediksi penurunan harga Bitcoin dari puncak $126.000 pada Oktober 2025, mengumumkan telah menutup semua posisi short-nya dan mulai membeli Bitcoin spot di kisaran $64.000. Ia berpendapat siklus bear market empat tahunan mungkin berakhir lebih cepat karena perubahan struktural seperti regulasi CLARITY Act dan masuknya modal institusi besar melalui tokenisasi aset. Di sisi lain, analis on-chain gumsays mencatat sinyal divergensi bullish mingguan pada Bitcoin telah berlangsung 147 hari, mendekati durasi 161 hari sebelum pembalikan kuat di siklus 2022. Namun, peneliti siklus Jake Pahor memberikan pandangan berbeda. Berdasarkan analisis data historis 5.279 hari, ia menyebutkan tiga kondisi umum pembentukan dasar bear market — durasi sekitar 12 bulan, sentimen ekstrem 'ketakutan' berkepanjangan (skor risiko di bawah 20), dan harga jatuh di bawah harga realisasi — belum terpenuhi sama sekali dalam siklus saat ini. Harga realisasi Bitcoin saat ini sekitar $53.000. Pasar tampak terpecah antara mereka yang mulai 'membangun posisi lebih awal' (seperti Doctor Profit) dan yang memilih 'menunggu sinyal konfirmasi lebih kuat' (seperti strategi Jake Pahor). Bitcoin saat ini diperdagangkan sekitar $64.800, tepat di atas moving average 200-minggu sekitar $63.000, dengan indeks Fear & Greed di level 25 (Extreme Fear).

marsbit1j yang lalu

Setelah 9 Bulan Short, Beralih Lengkap ke Long, Trader Terkenal Buka Posisi Bitcoin di Sekitar 64k, Sentimen Bullish vs Bearish Terbelah di Pasar Kripto

marsbit1j yang lalu

Kisah Seorang Trader Senior: Bagaimana Cara Memanfaatkan Ekspektasi Pasar yang Salah?

**Ringkasan: Bagaimana Mendapatkan Keuntungan dari Ekspektasi Pasar yang Salah?** Artikel ini berbagi pengalaman seorang trader senior dalam mengambil keuntungan dari kesalahan ekspektasi pasar, dengan studi kasus transaksi short Nasdaq (NQ) yang sukses. Kasus terjadi setelah data CPI AS yang lebih lemah dari ekspektasi. Pasar bereaksi dengan euforia, mendorong Nasdaq (NQ) naik ke 30060, karena mengira suku bunga akan turun secara luas. Namun, trader ini mengamati bahwa meskipun suku bunga jangka pendek (short-end) rileks, **suku bunga riil 30 tahun justru mencapai level tertinggi baru dalam 20 tahun**. Ini menunjukkan mekanisme transmisi pasar telah berubah: data lemah tidak lagi serta-merta menurunkan biaya modal jangka panjang. Narasi pasar yang salah adalah: **CPI lemah → kebijakan moneter melonggar → penurunan biaya modal jangka panjang → ekspansi valuasi saham teknologi (NQ).** Rantai ini patah di antara "kebijakan" dan "biaya modal jangka panjang". Suku bunga panjang yang tinggi menjadi variabel veto yang menolak konfirmasi optimisme pasar. Trader merumuskan metodologi sistematis untuk mengeksploitasi kesalahan ekspektasi semacam ini: 1. **Identifikasi Rantai Sebab-Akibat Tersirat** pasar. 2. **Temukan Variabel Veto** yang dapat membatalkan narasi tersebut. 3. **Amati Penolakan Konfirmasi** dari variabel veto tersebut. 4. **Tunggu Harga Tetap Bergerak** sesuai skenario lama meski fondasi sudah berubah. 5. **Pilih Ekspresi Aset** yang paling sensitif terhadap kesalahan tersebut (dalam kasus ini: short NQ, bukan S&P 500). 6. **Definisikan Syarat Keluar** untuk kondisi "terbukti salah" dan "logika sudah terealisasi". Kesimpulan kunci: Peluang alpha tidak selalu berasal dari perbedaan informasi, tetapi sering dari **perbedaan fungsi reaksi**. Ketika kondisi makro berubah tetapi pasar terus bereaksi dengan pola lama berdasarkan kebiasaan, disitulah peluang muncul. Pertanyaan paling penting adalah: **Rantai sebab-akibat apa yang menjadi sandaran reaksi pertama pasar hari ini, dan apakah rantai itu masih valid?**

marsbit1j yang lalu

Kisah Seorang Trader Senior: Bagaimana Cara Memanfaatkan Ekspektasi Pasar yang Salah?

marsbit1j yang lalu

Trading

Spot
活动图片