Unlocking the 'Golden Key' in Prediction Markets Through 27.73 Million Transaction Data: 690 K-Line Strategies Struggle to Profit

marsbitDipublikasikan tanggal 2026-02-20Terakhir diperbarui pada 2026-02-20

Abstrak

The article investigates whether a profitable "golden key" strategy exists in prediction markets, using an analysis of 27.73 million transactions over 3,082 fifteen-minute BTC prediction markets. The study debunks several common approaches: Technical analysis based solely on price action, tested across 690 combinations of entry/exit points, stop-loss, and take-profit levels, yielded no positive expected value. Even high-win-rate strategies, like buying at 90% and selling at 99%, resulted in negative expectations due to poor risk-reward ratios. Similarly, arbitrage strategies aiming to profit from YES+NO prices below 1 were also unprofitable after accounting for real-world constraints. The research identifies two potentially viable strategies: 1. **Momentum-based trading**: A brief ~30-second window exists after sharp BTC price moves (>$150-$200) where prediction market token prices lag, allowing manual traders to capitalize on this inefficiency before algorithms adjust. 2. **Fair value model**: A model calculating a token's theoretical win probability based on BTC's volatility and time to expiry revealed that markets are inefficient. Profitable opportunities arise only when tokens trade at a significant discount (>10 cents) to their fair value. Buying at a premium, even with high win probability, leads to negative expected returns. The conclusion advises traders to abandon pure price-based technical analysis, focus on the underlying asset (BTC), respect probability valu...

Author: Frank, PANews

How difficult is it to find a profitable "golden key" in prediction markets?

On social media, you often see many people claiming to have discovered a secret to smart money's profitability, but in reality, they provide no substantive information. What people can see is only the growing profit curve of these funds, not the underlying logic.

So, how can one build a personalized trading strategy suitable for prediction markets?

PANews took the BTC 15-minute prediction market as an example, analyzing nearly 27.73 million transactions and 3,082 window periods over the past month, arriving at some conclusions that may defy conventional wisdom. In a previous article, we already conducted a macro-level analysis of this market. This time, we will delve deeper to find that potentially existing "golden key."

Shattered Illusion: The Complete Failure of K-Line Technical Analysis

Have you ever considered a strategy that treats prediction markets like stocks or cryptocurrencies, analyzing entry and exit points purely based on price movements, combined with position management, stop-loss, and take-profit elements, to create a trading strategy entirely detached from BTC's行情, focusing solely on the price changes in prediction markets?

In traditional crypto markets, this approach is known as the "technical analysis" school. In theory, this should work equally well in prediction markets. Therefore, PANews also conducted simulations in this direction and developed a custom prediction market backtesting system. This system can input factors such as entry points, take-profit points, stop-loss points, entry timing, and exclusion of干扰 prices to calculate the actual profit-loss ratio, win rate, and other elements of the strategy from over 3,000 markets in the past 30 days.

Initially, with incomplete data (Polymarket's historical data only provides 3,500 entries per market), the backtest results could easily find profitable answers. For example, entering at 60%, selling at 90%, stopping loss at 40%, and setting a certain window period for trading.

However, the actual test results were vastly different. Under real execution, the profit curve of this strategy slowly declined like a钝刀割肉 (dull knife cutting flesh). So, we tried to补全 the data as much as possible. After trying various methods, we finally obtained the complete price information data for all markets. This time, the results finally began to align with reality.

In real data testing, PANews simulated 690 combinations of factors including price, take-profit/stop-loss, entry timing, interference exclusion, and slippage. The final result was that not a single strategy could achieve a positive expected return.
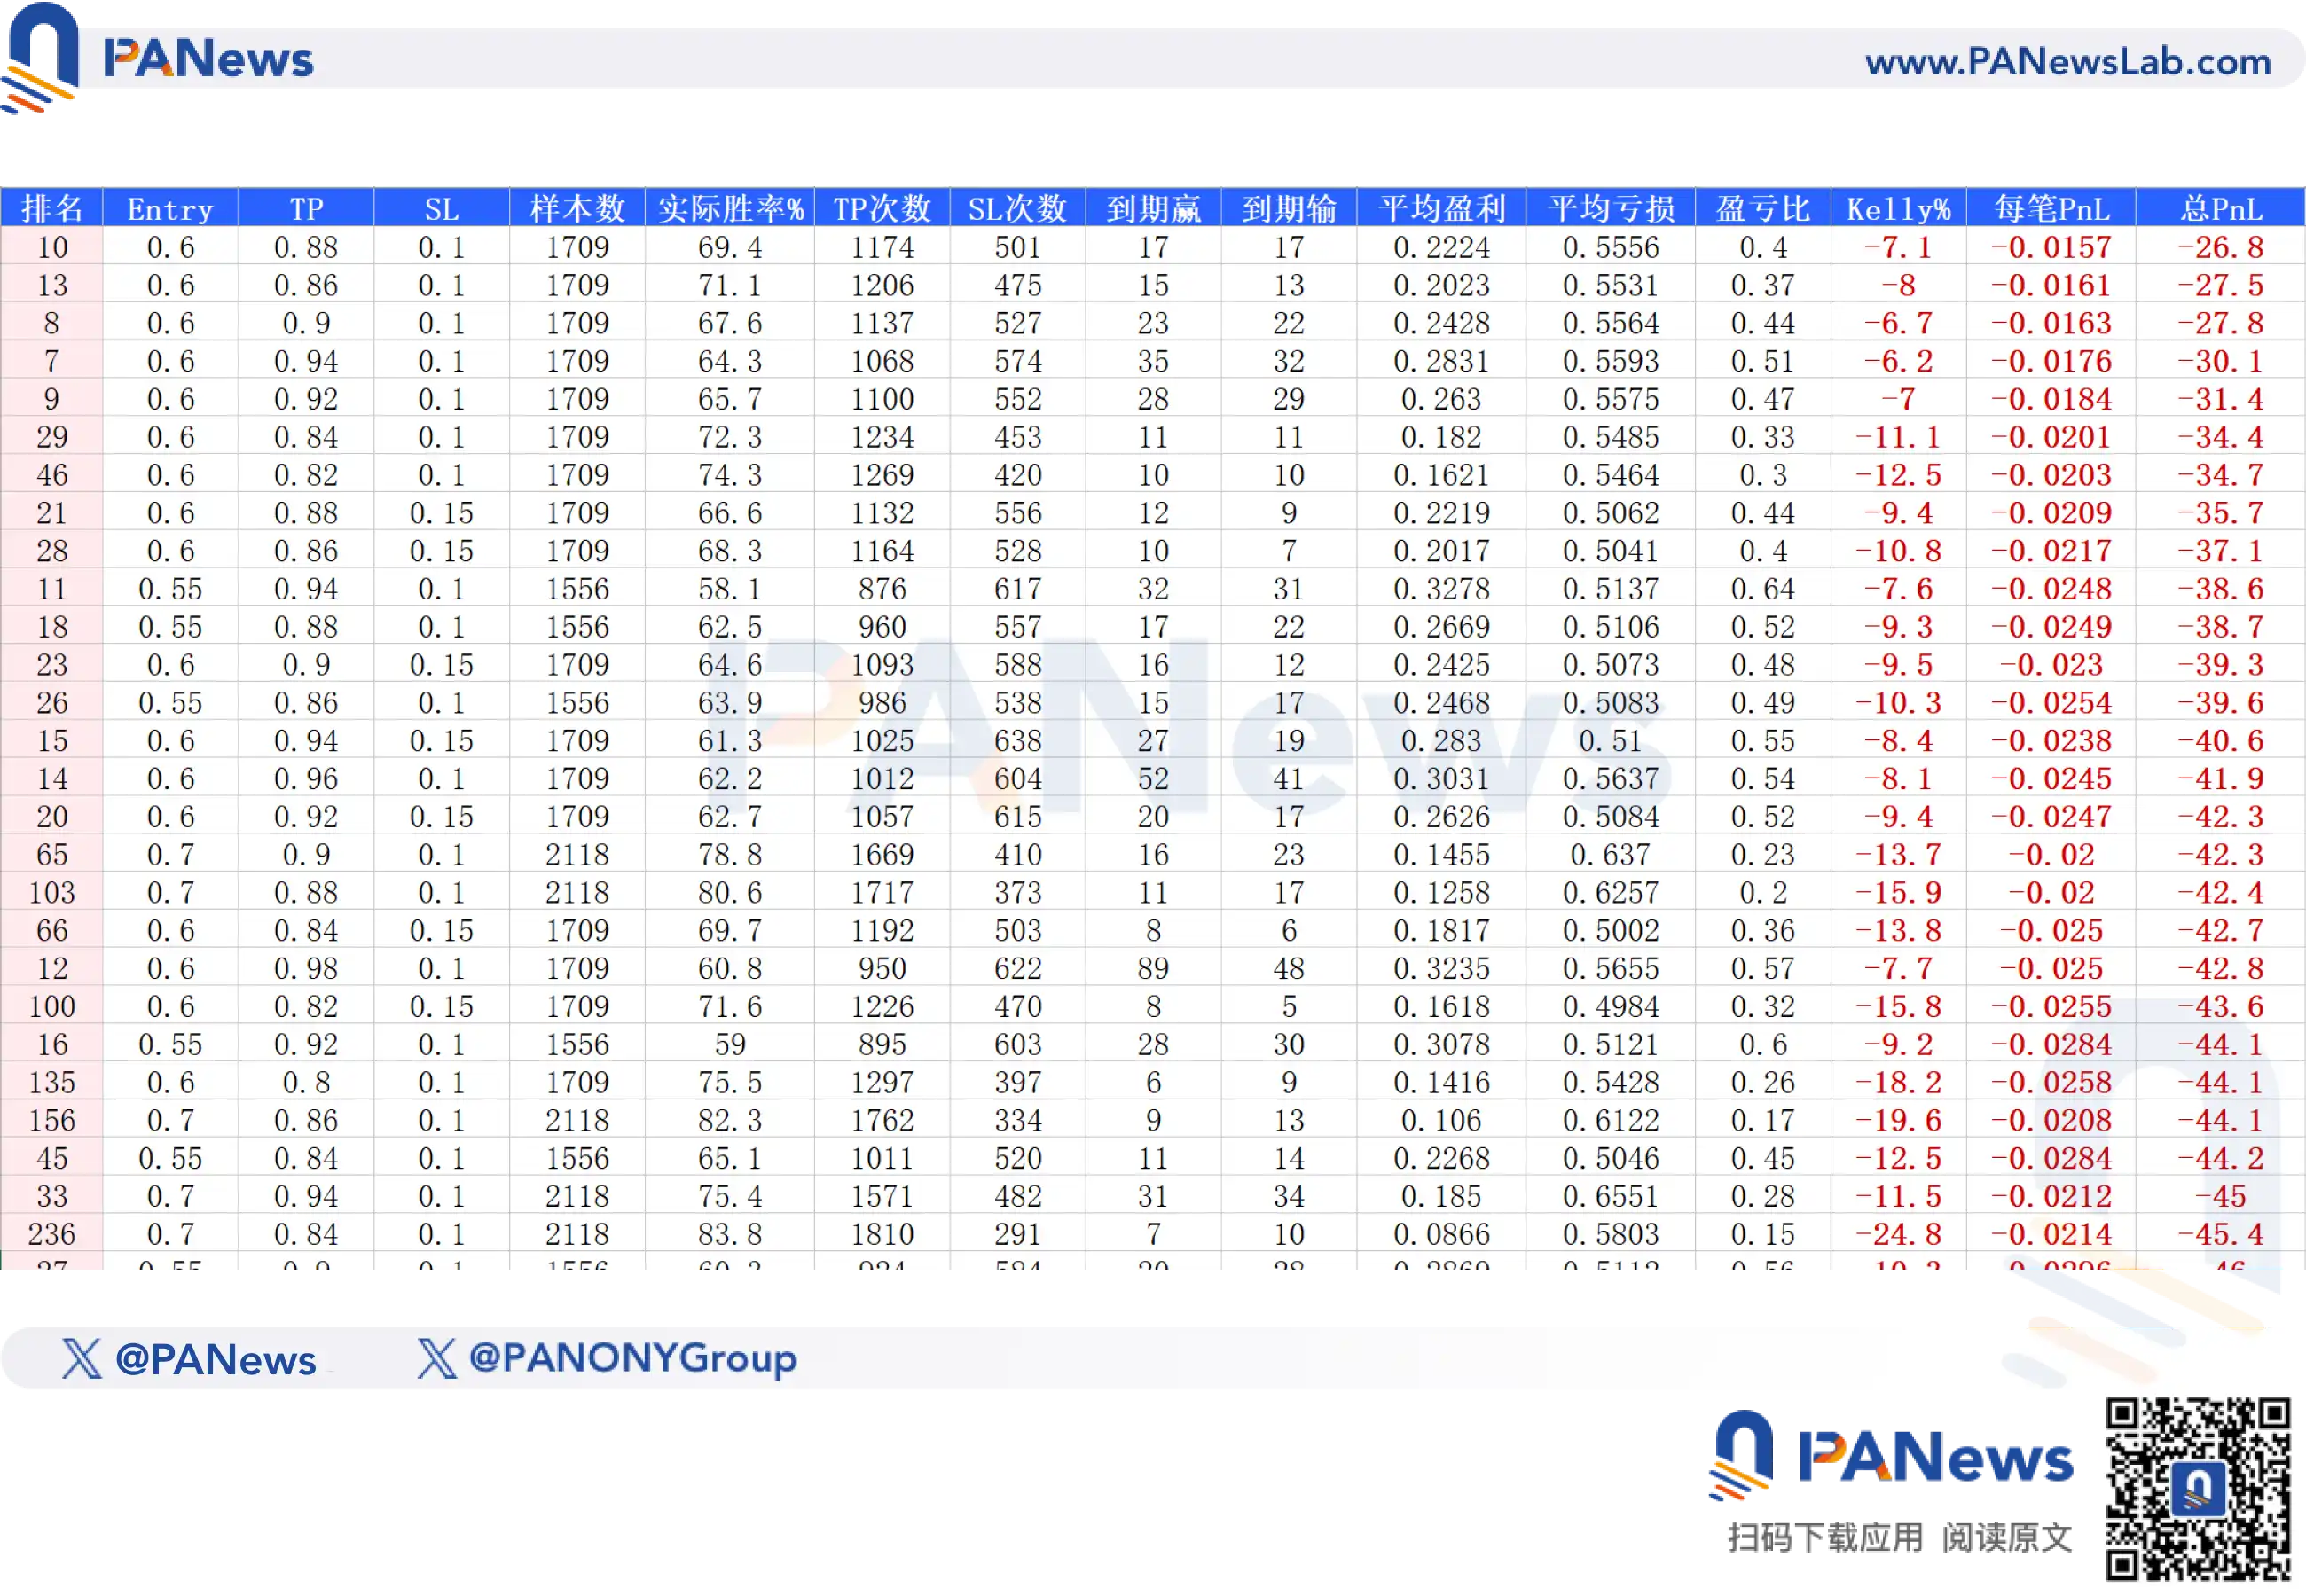
Even the highest possible return had an expected value of -26.8. This result indicates that in prediction markets, any purely mathematical prediction that excludes the event itself has almost no possibility of profitability.

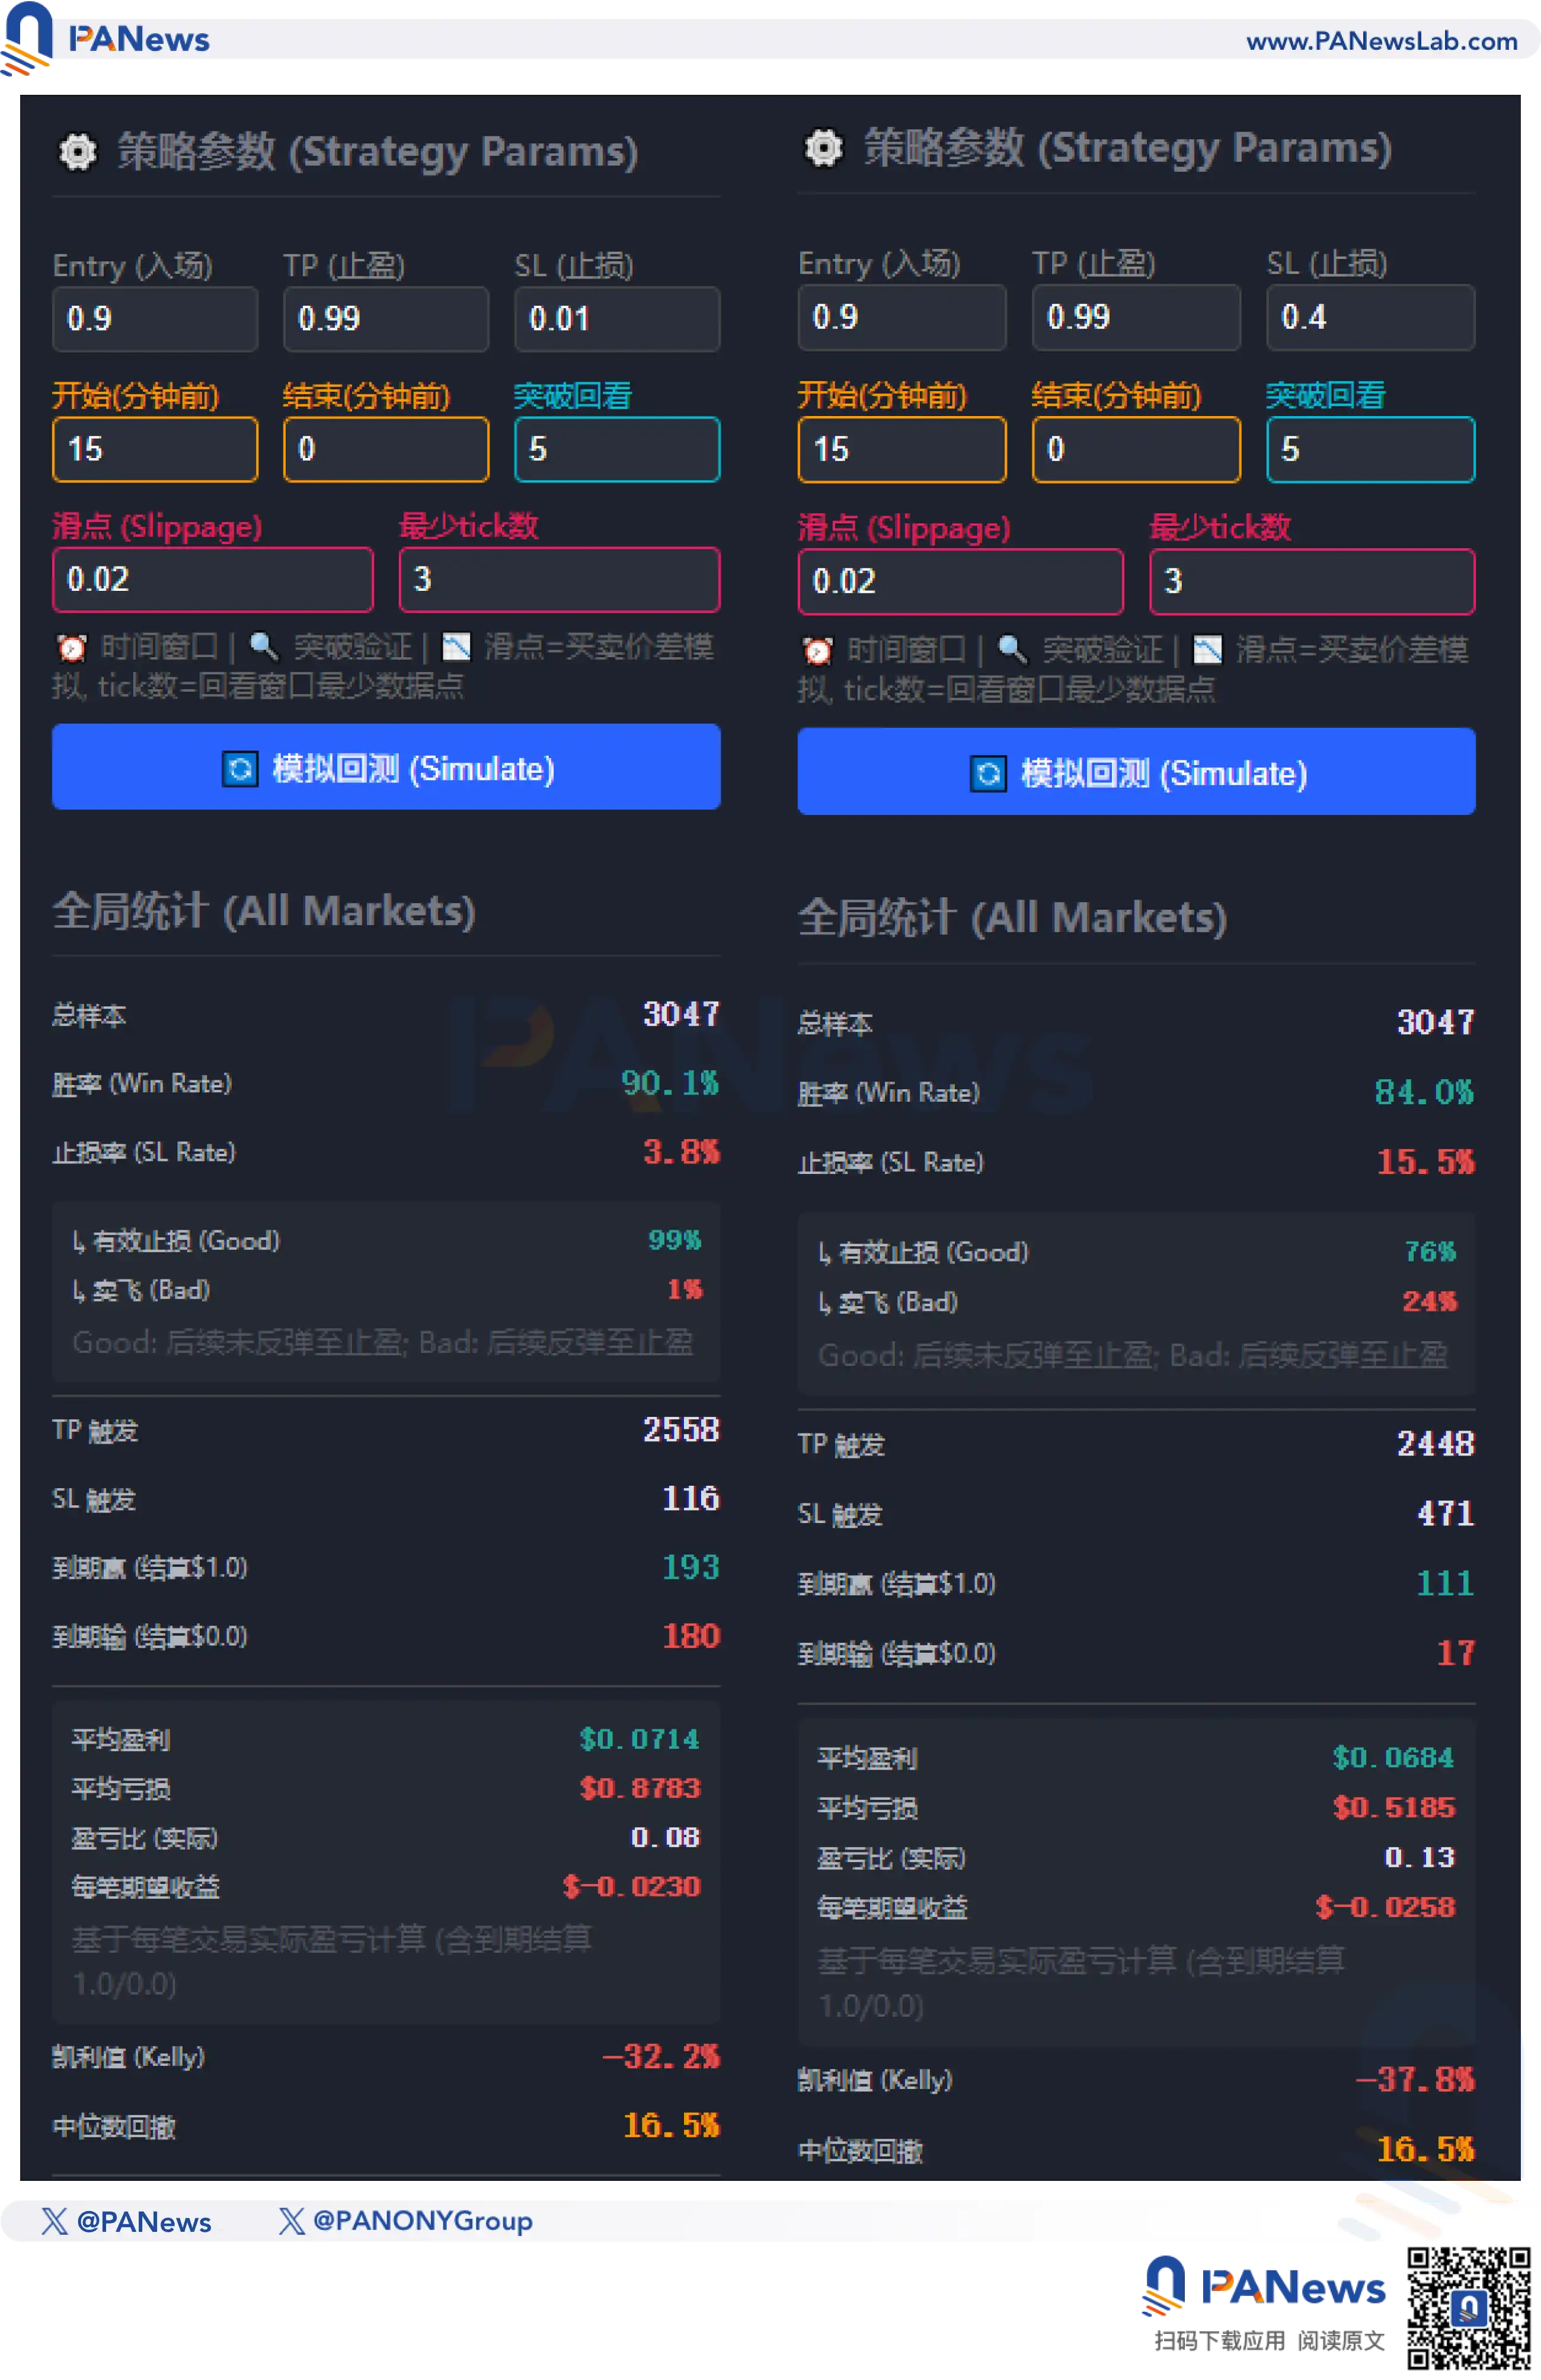
For example, the much-discussed "end-of-market strategy" on social media involves buying at 90% and selling at 99%. It seems this strategy would have a very high win rate and be profitable in the long run. From the actual test results, this strategy indeed has a high win rate of 90.1%, achieving take-profit in 2,558 out of 3,047 simulations. However, the terrifying part is that under this strategy, the actual profit-loss ratio is only 0.08, and the final expectation given by the Kelly criterion is -32.2%, making it not worth adopting.

Some might say, would adding a stop-loss improve the profit-loss ratio? But the残酷的现实 (harsh reality) is that while the profit-loss ratio might improve, the win rate correspondingly decreases. For example, setting a stop-loss at 40% reduces the win rate to 84%. Combined with the still low profit-loss ratio, the final Kelly expectation is -37.8%, still a loss.
Conversely, the strategy closest to profitability was buying for a reversal—buying at 1%, betting that the market would reverse and ultimately win. In the simulation, this approach had a win rate of about 1.1%, higher than the price probability, and an extremely high profit-loss ratio of 94, resulting in an expected return of 0.0004. However, this前提 (precondition) assumes no slippage or transaction fees. Once fees are considered, it instantly becomes a negative expectation.

In summary, our research in this area found that in prediction markets, relying solely on technical analysis from financial trading cannot achieve profitability.

The Trap of "Two-Way Arbitrage"

So, besides this approach, there's another mainstream view: two-way arbitrage. The idea is that if the total cost of YES + NO is less than 1, you can profit regardless of the outcome. Again, this is an idea that is丰满 (plump) in theory but骨感 (bony) in reality.

n

First, if you opt for cross-platform arbitrage, there are already many bots doing this. Ordinary users simply cannot compete with bots for the meager liquidity.

So, to achieve this effect, another方案 (scenario) is, for example, in the same market, buying when the YES price drops to 40% and the NO price also drops to 40%, which could theoretically create a 20% arbitrage space.
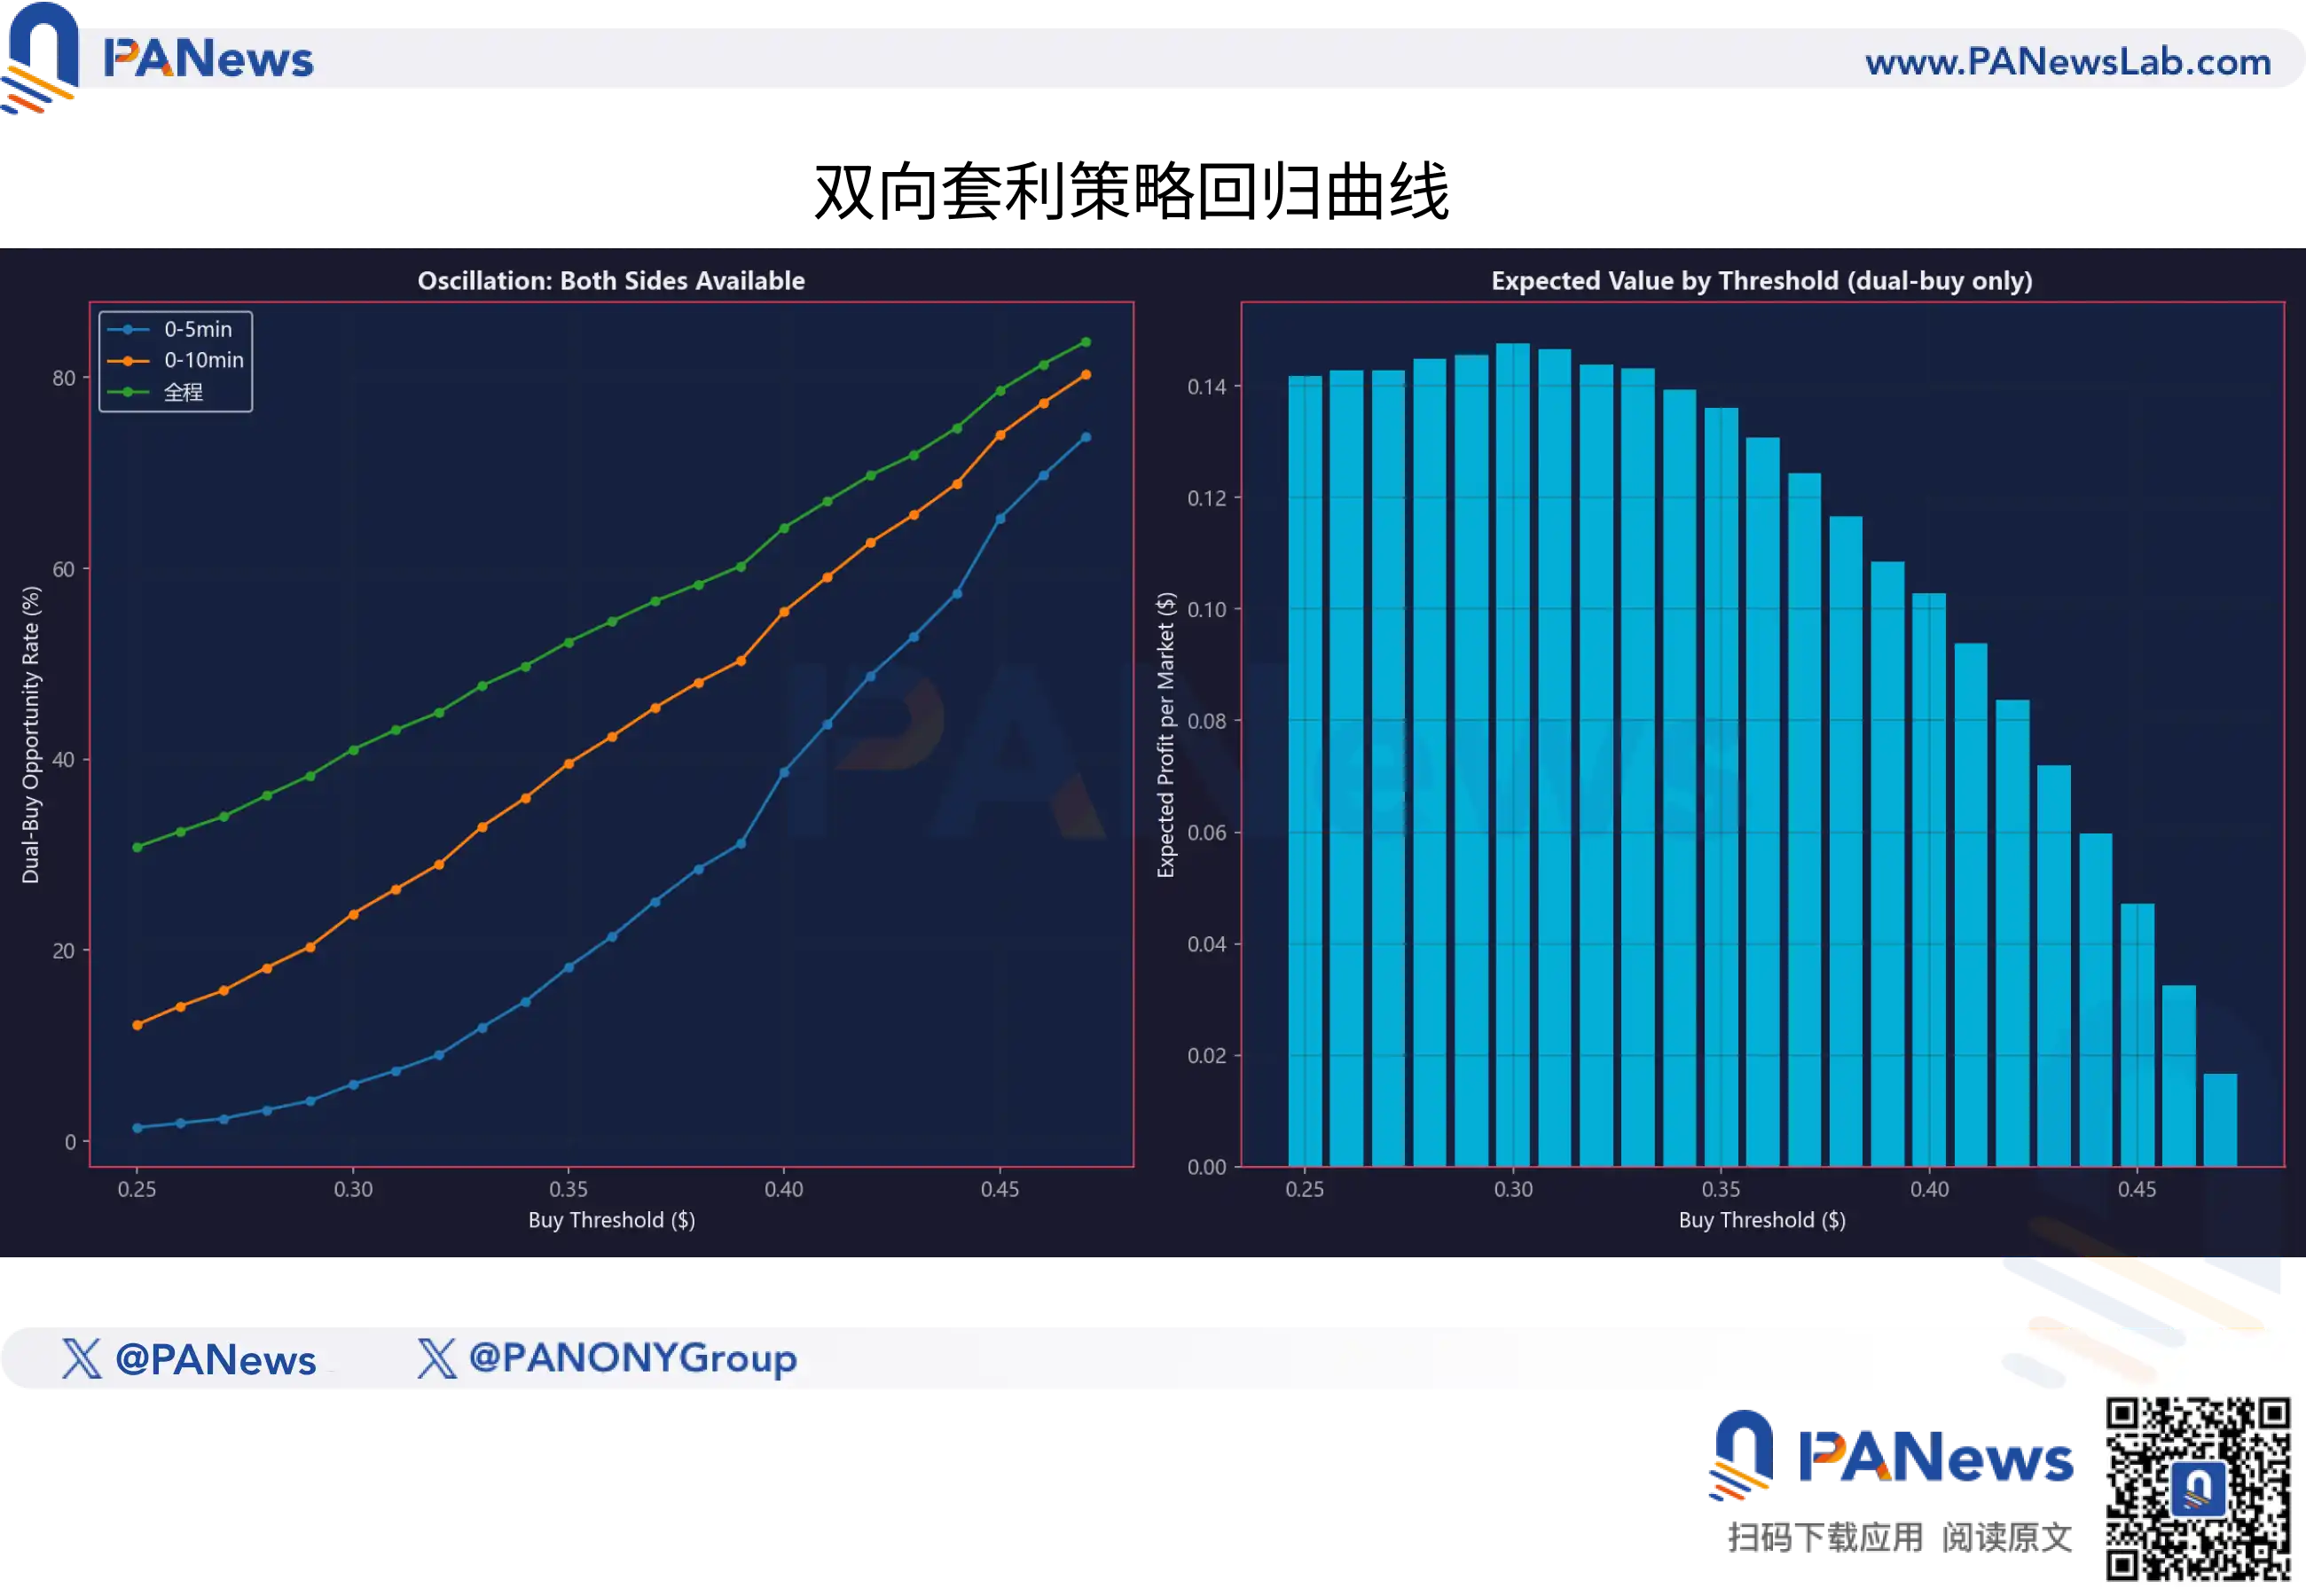
But the final data results tell a different story. Although this strategy has a 64.3% win rate, its excessively low profit-loss ratio still leads to a negative expectation.

This "two-way strategy" looks beautiful on paper but is很容易翻车 (very easy to fail) in practice. Moreover, categorically, this strategy also falls under pure theoretical assumptions detached from the actual event changes.

Fair Value and Deviation Models are the "Golden Key"

So, what kind of strategy can truly achieve profitability?

The answer lies in the "time差" (difference) between the BTC spot price and the prediction market token price.

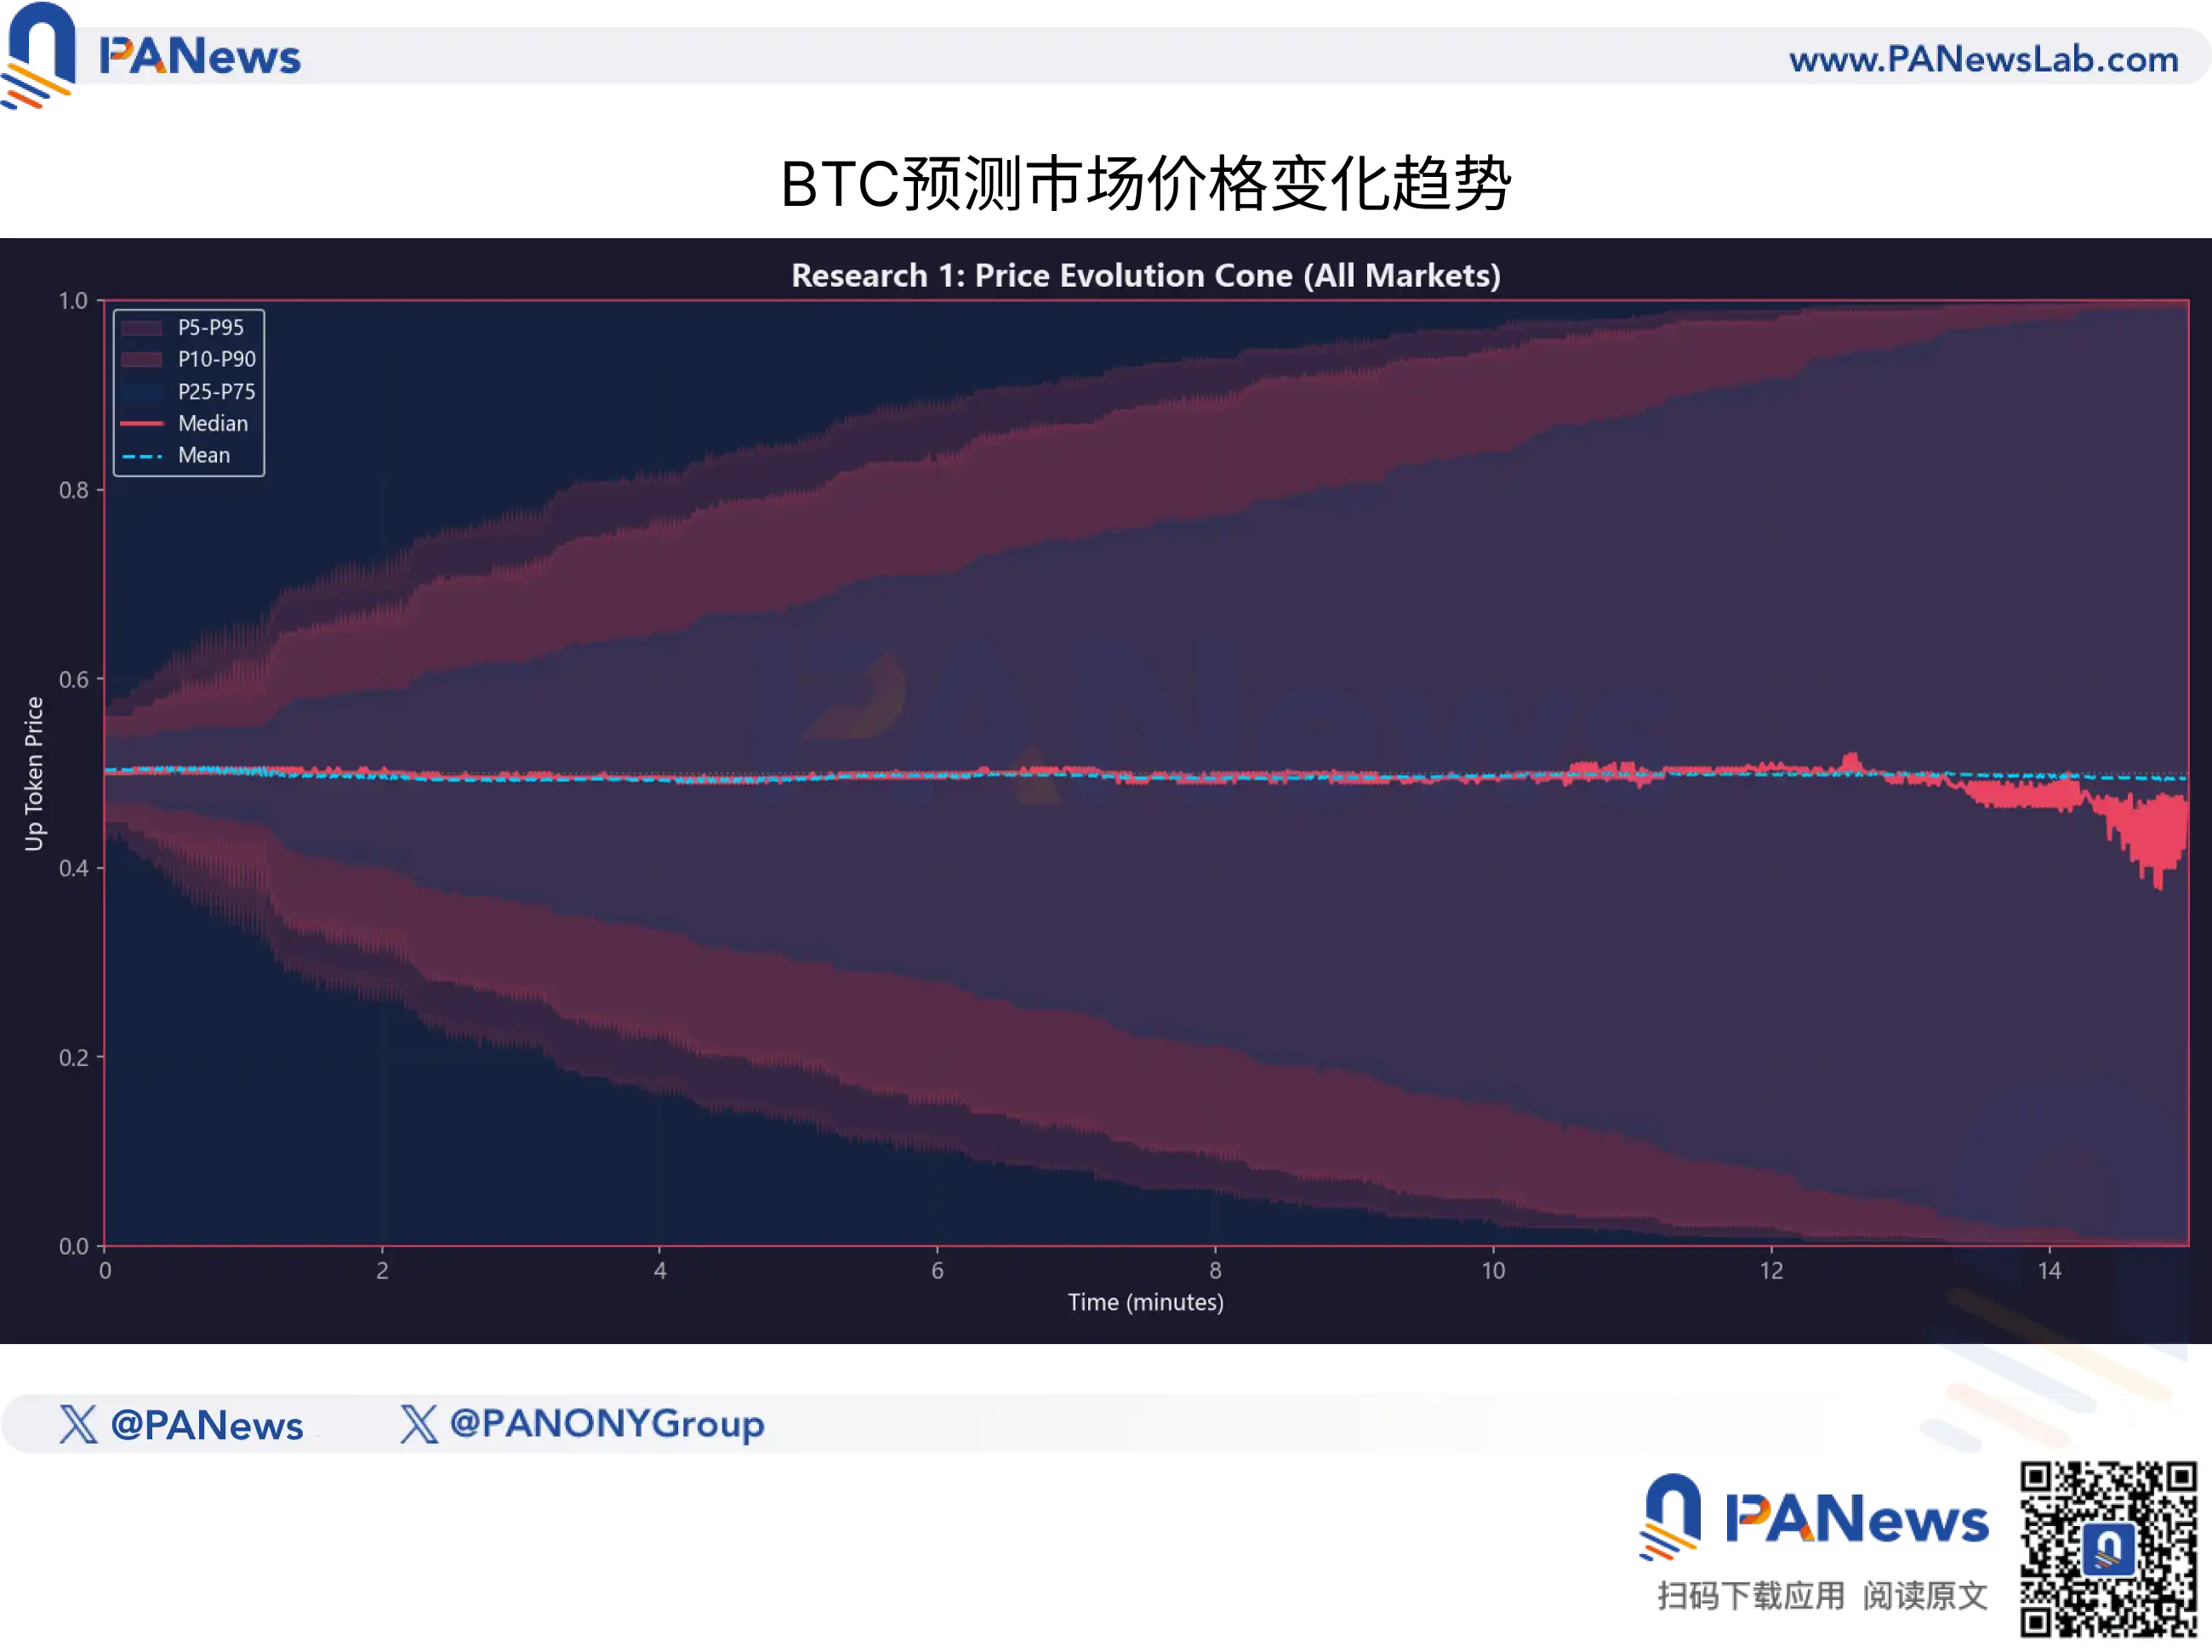
PANews discovered that the liquidity providers and market maker algorithms in prediction markets are not perfect. When BTC experiences sharp movements within a short time (e.g., 1-3 minutes), such as a sudden price jump exceeding $150 or $200, the price of prediction market tokens does not instantly "teleport" to the theoretical price.

Data shows that this "efficiency gap" in pricing takes an average of about 30 seconds to decay from its maximum value (approx. 0.10) to half (approx. 0.05).

Thirty seconds is an eternity for high-frequency trading, but for manual traders, it's a fleeting "golden window."

This means the prediction market is not a completely efficient market. It's more like a sluggish giant that often reacts half a beat slower after BTC's baton has already been waved.

However, this doesn't mean that fast hands can easily pick up money. Our data further shows that this "delay arbitrage" space is being rapidly compressed. In the微小波动区间 (tiny fluctuation range) where BTC moves less than $50, after deducting Gas fees and slippage, most so-called "arbitrage opportunities" are actually traps with negative expectations.

Besides momentum trading relying on speed, PANews' research also revealed another盈利逻辑 (profit logic) based on "value investing."

In prediction markets, "price" does not equal "value." To quantify this, PANews built a "Fair Value Model" based on 920,000 historical snapshots. This model does not rely on market sentiment but calculates the theoretical probability of winning for the current token based on BTC's current volatility state and the remaining time to settlement.

By comparing the theoretical fair value with the actual market price, we discovered the nonlinear characteristics of pricing efficiency in prediction markets.

1. The Magic of Time

Many retail traders intuitively believe that price should regress linearly over time. But data shows that deterministic convergence is accelerated.

For example, under the same BTC volatility conditions, the price correction speed in the last 3-5 minutes of a match is much faster than in the first 5 minutes. However, the market often underestimates this convergence speed, leading to frequent situations where token prices are significantly lower than their fair value during the mid-to-late stages of a match (remaining 7-10 minutes interval).

2. Only "Deep Discounts" Are Worth Buying

This is the most important risk control conclusion from this research.

Backtesting different levels of deviation index (Fair Value - Actual Price) found:

When the market price is higher than the fair value (i.e., buying at a premium), regardless of BTC's trend, the long-term expected value (EV) is negative across the board.

Only when the deviation index > 0.10, meaning the actual price is at least 10 cents lower than the fair value, does the trade have a robust positive mathematical expectation.
This means that for smart money, a price of $0.70 does not mean "a 70% probability of winning"; it is merely a quote. Only when the model calculates the underlying true win probability to be as high as 85% does $0.70 become a "bargain" worth betting on.

This also explains why many retail traders容易亏损 (easily lose money) in prediction markets—because your actual transaction price is likely bought at a level higher than the market's fair value.

For ordinary participants, this research is a sobering dissuasion and an advanced guide. It tells us:

Abandon K-Line Superstition: Do not try to find patterns in the price charts of prediction tokens; it's a mirage.

Focus on the Underlying Asset: Watch BTC's movements, not the prediction market盘口 (ticker).

Respect the Odds: Even with a 90% win rate, if the price is too expensive (premium), it is still a注定亏损的买卖 (sure-loss trade).

In this algorithm-dominated jungle, if ordinary retail traders cannot establish a mathematical coordinate system for "fair value" and lack the technical ability to capture the "30-second lag," then every click of "Buy" might just be a donation to the liquidity pool.


Pertanyaan Terkait

QWhat was the main finding of PANews' analysis of 27.73 million transactions in the prediction market?

AThe analysis found that purely mathematical predictions, excluding event-based factors, are almost impossible to profit from. None of the 690 K-line strategy combinations tested yielded a positive expected return.

QWhy did the 'tail strategy' (buying at 90% and selling at 99%) ultimately result in a loss despite its high win rate?

AAlthough the tail strategy had a high win rate of 90.1%, its profit-to-loss ratio was extremely low at only 0.08. This combination resulted in a negative Kelly criterion expectation of -32.2%, making it an unprofitable strategy.

QWhat is the 'golden key' or profitable strategy identified in the research for prediction markets?

AThe profitable strategy is based on the 'time difference' or inefficiency between the BTC spot price and the prediction market token price. A 'fair value model' that identifies when the token price is significantly discounted (by at least 10 cents) from its calculated fair value offers a positive mathematical expectation.

QWhat is a major pitfall of the 'two-way arbitrage' strategy in prediction markets?

AThe two-way arbitrage strategy, which involves buying when the sum of YES and NO prices is below 1, often results in a negative expected return due to a low profit-to-loss ratio, even if the win rate is high (e.g., 64.3%). It is difficult to execute profitably against automated bots.

QWhat crucial risk management conclusion does the article provide for participants in prediction markets?

AThe most important conclusion is that only 'deep discounts' are worth buying. A trade only has a robust positive expectation when the deviation index (fair value - actual price) is greater than 0.10, meaning the actual price is at least 10 cents lower than the fair value. Buying at a premium consistently leads to negative expectations.

Bacaan Terkait

Kisah Seorang Trader Senior: Bagaimana Cara Memanfaatkan Ekspektasi Pasar yang Salah?

**Ringkasan: Bagaimana Mendapatkan Keuntungan dari Ekspektasi Pasar yang Salah?** Artikel ini berbagi pengalaman seorang trader senior dalam mengambil keuntungan dari kesalahan ekspektasi pasar, dengan studi kasus transaksi short Nasdaq (NQ) yang sukses. Kasus terjadi setelah data CPI AS yang lebih lemah dari ekspektasi. Pasar bereaksi dengan euforia, mendorong Nasdaq (NQ) naik ke 30060, karena mengira suku bunga akan turun secara luas. Namun, trader ini mengamati bahwa meskipun suku bunga jangka pendek (short-end) rileks, **suku bunga riil 30 tahun justru mencapai level tertinggi baru dalam 20 tahun**. Ini menunjukkan mekanisme transmisi pasar telah berubah: data lemah tidak lagi serta-merta menurunkan biaya modal jangka panjang. Narasi pasar yang salah adalah: **CPI lemah → kebijakan moneter melonggar → penurunan biaya modal jangka panjang → ekspansi valuasi saham teknologi (NQ).** Rantai ini patah di antara "kebijakan" dan "biaya modal jangka panjang". Suku bunga panjang yang tinggi menjadi variabel veto yang menolak konfirmasi optimisme pasar. Trader merumuskan metodologi sistematis untuk mengeksploitasi kesalahan ekspektasi semacam ini: 1. **Identifikasi Rantai Sebab-Akibat Tersirat** pasar. 2. **Temukan Variabel Veto** yang dapat membatalkan narasi tersebut. 3. **Amati Penolakan Konfirmasi** dari variabel veto tersebut. 4. **Tunggu Harga Tetap Bergerak** sesuai skenario lama meski fondasi sudah berubah. 5. **Pilih Ekspresi Aset** yang paling sensitif terhadap kesalahan tersebut (dalam kasus ini: short NQ, bukan S&P 500). 6. **Definisikan Syarat Keluar** untuk kondisi "terbukti salah" dan "logika sudah terealisasi". Kesimpulan kunci: Peluang alpha tidak selalu berasal dari perbedaan informasi, tetapi sering dari **perbedaan fungsi reaksi**. Ketika kondisi makro berubah tetapi pasar terus bereaksi dengan pola lama berdasarkan kebiasaan, disitulah peluang muncul. Pertanyaan paling penting adalah: **Rantai sebab-akibat apa yang menjadi sandaran reaksi pertama pasar hari ini, dan apakah rantai itu masih valid?**

marsbit20m yang lalu

Kisah Seorang Trader Senior: Bagaimana Cara Memanfaatkan Ekspektasi Pasar yang Salah?

marsbit20m yang lalu

Opini: Hubungan Hedging Antara Obligasi AS dan Pasar Saham Telah Gagal, BTC Sebagai Aset Berisiko Menghadapi Tekanan Ganda

**Ringkasan:** Selama 20 tahun terakhir, hubungan lindung nilai tradisional antara saham AS dan obligasi pemerintah AS (treasury) telah runtuh. Biasanya, ketika saham turun, obligasi naik, dan sebaliknya. Namun, sejak sekitar 2020, keduanya bergerak turun secara bersamaan, menghilangkan "peredam kejut" dalam portofolio investasi. Bitcoin, sebagai aset berisiko tinggi, kini menanggung tekanan ganda dari dinamika ini. Analisis menunjukkan bahwa pergeseran ini didorong oleh volatilitas inflasi yang menjadi faktor dominan di pasar, berbeda dengan periode sebelumnya di mana risiko pertumbuhan ekonomi yang lebih menonjol. Investor kini menghindari risiko durasi (sensitif terhadap suku bunga) dengan menjual obligasi jangka panjang dan beralih ke uang tunai, surat utang jangka pendek, atau dolar AS yang kuat. Ini menjelaskan mengapa Bitcoin, emas, dan obligasi jangka panjang bisa jatuh bersamaan. Bitcoin sangat sensitif terhadap kondisi makro: ia cenderung naik ketika imbal hasil riil turun, dolar melemah, dan kondisi keuangan mengendur. Ketika imbal hasil obligasi tanpa risiko (seperti treasury) naik, biaya peluang untuk memegang aset seperti Bitcoin yang tidak memberikan bunga menjadi lebih tinggi. Selain itu, penurunan saham mengurangi selera risiko investor secara keseluruhan. Logika jangka panjang Bitcoin sebagai aset dengan pasokan tetap justru diperkuat oleh kondisi fiskal yang menciptakan imbal hasil tinggi pada obligasi (seperti defisit yang membesar). Namun, dalam jangka pendek, kondisi yang sama ini justru membebani harganya. Pemulihan hubungan lindung nilai tradisional memerlukan meredanya volatilitas inflasi, sehingga risiko pertumbuhan kembali menjadi pendorong utama pasar dan Fed memiliki ruang untuk melonggarkan kebijakan. Sampai saat itu, Bitcoin dan aset berisiko lainnya beroperasi tanpa "lantai" pelindung yang biasanya disediakan oleh obligasi.

marsbit22m yang lalu

Opini: Hubungan Hedging Antara Obligasi AS dan Pasar Saham Telah Gagal, BTC Sebagai Aset Berisiko Menghadapi Tekanan Ganda

marsbit22m yang lalu

Bear Market Paling Lembut? Pelaku Jual BTC Mundur, ARK dan Bitwise Sama-sama Optimis

Artikel ini membahas kondisi pasar Bitcoin (BTC) yang saat ini berfluktuasi di sekitar $75.000, dengan indeks ketakutan berada di level 35. Laporan dari berbagai analis dan lembaga memberikan pandangan beragam: ARK Invest mencatat penurunan BTC sekitar 14% di Q2 2026, dengan indikator teknis masih bearish. Namun, peningkatan persediaan dari pemegang jangka panjang dianggap sebagai sinyal potensial habisnya tekanan jual. Bitwise menyebut penurunan saat ini sebagai "bear market paling moderat" secara struktural, dengan para investor institusi melihatnya sebagai peluang akumulasi. Mereka mencatat bahwa dasar setiap siklus Bitcoin terus naik, mencerminkan matangnya aset ini. Data dari Polymarket menunjukkan probabilitas BTC jatuh di bawah $50.000 tahun ini adalah 33%. Analisis teknis dari Bit menunjukkan bahwa titik terendah gelombang C mungkin telah terbentuk, dengan area support kunci antara $59.000 dan $70.000. Namun, analis glassnode memperingatkan risiko pembentukan puncak jangka pendek jika BTC gagal menembus $66.000 secara efektif. Di sisi lain, trader Doctor Profit melaporkan telah menutup semua posisi short crypto-nya dan mulai membeli BTC spot lagi di level $64.000, menjadikannya alokasi jangka panjang pertama sejak September 2025. Ia berpendapat bahwa perilaku kawanan (herd behavior) di pasar, di mana banyak investor menunggu harga turun lebih dalam, justru bisa membuat dasar pasar terbentuk lebih awal dari perkiraan umum. Secara keseluruhan, nada dari banyak lembaga mulai berubah menjadi lebih optimis jangka panjang, meskipun ketidakpastian makro dan risiko penurunan lebih lanjut masih diakui.

Foresight News2j yang lalu

Bear Market Paling Lembut? Pelaku Jual BTC Mundur, ARK dan Bitwise Sama-sama Optimis

Foresight News2j yang lalu

Trading

Spot
活动图片