December 17: BTC, ETH, SOL, PTB, IR Market Analysis

金色财经Publicado a 2025-12-17Actualizado a 2025-12-17

Resumen

On December 17, the market analysis covers BTC, ETH, SOL, PTB, and IR amid mixed economic signals. Non-farm data showed both positive and negative impacts, with Wall Street focused on January data for potential rate cuts. BTC remains weak on the 4-hour chart with no clear support. It broke below the trendline with a bearish MACD cross, suggesting further downside. Key support levels are identified at 77,250–78,800 for initial entry, and 74,600–75,000 if 77,000 is breached. ETH is in a correction phase, with MACD nearing zero and potential for accelerated decline. Key supports are at 2,228 and 2,112, with 2,752–2,680 as a possible short-term rebound zone. SOL is trading between Bollinger Bands with supports at 114–102. A break below 100 could lead to a drop toward 86–85. PTB is considered highly risky due to extreme volatility and low trading reliability, often resulting in significant losses. IR has a total supply of 1 billion tokens with initial circulation of 20.5% at a price of $0.1. While it has strong backing and previous protocol revenue, current metrics show decline. Tokenomics are unclear, and cautious approach is advised. Overall, the market suggests waiting for clearer signals post-BoJ decision on the 19th, with strategic entries at key support levels.

Last night, one piece of non-farm payroll data was positive while another was negative, effectively canceling each other out. Wall Street is currently focused on January's data, as it relates to whether there will be a rate cut in January. After the non-farm data was released last night, the prediction market saw a slight increase in expectations for a January rate cut, but the magnitude was not significant.

Bitcoin has continued to weaken and adjust over the past 4 hours, with no clear signals of a halt in the decline or support being found. We will wait until the 19th, after the Bank of Japan's rate hike, to see the market's reaction.

BTC

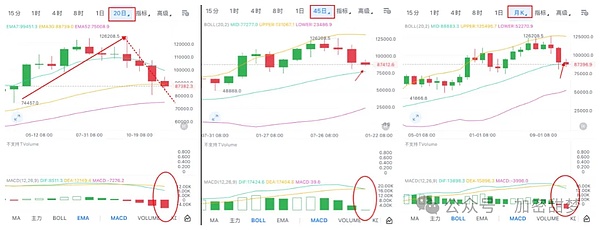
From a daily chart perspective, BTC has broken below the trend line, and the MACD has formed a death cross, indicating potential for further decline. The daily chart still shows a bearish pattern, so it is advisable to go short at resistance levels.

The monthly Bollinger Band mid-line at 88,800 was breached this week and has now turned into resistance. Therefore, we are now looking at the 45-day Bollinger Band mid-line, which corresponds to 77,250. This month, consider entering a small long position in the range of 78,800–77,250.

The 20-day chart shows a rounding top formation, with downward momentum strengthening. Its support points are the Bollinger lower band at 80,250 and the EMA52 (around 75,000). If the price breaks below 77,000, the key accumulation range for this decline will be 75,000–74,600.
ETH

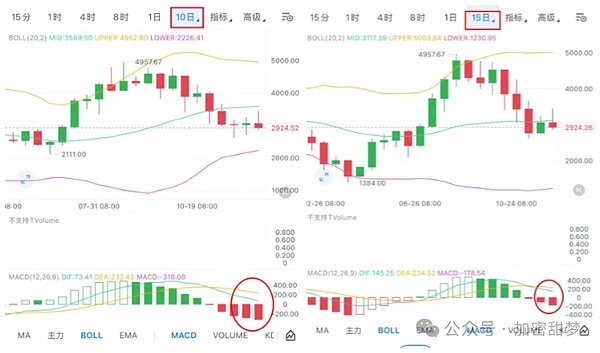
Currently in a 10–15 day correction phase within a monthly adjustment cycle. The 10-day correction is not yet over, and the MACD fast line is about to hit zero, which could accelerate the decline when it reaches the zero axis. The EMA7/30/52 have all been broken, with only the Bollinger lower band at 2,228 providing short-term support.

The 20-day chart has formed a death cross and is now on a 5-day losing streak, with the price slightly below the mid-band and far from the lower band. The primary support is the EMA52 (2,752). If this breaks, the low could test the June low of 2,112 (indicating a proportional correction and the end of the right-side adjustment). The monthly mid-band has been broken, but the lower band at 1,620 is too far to be effective. The effective support is the EMA52 (2,508).

The阶段性 bottom range for this phase: 2,222–2,112. The range of 2,752–2,680 offers some support and could serve as a short-term accumulation zone if there are no major negative catalysts causing an extreme drop.
SOL

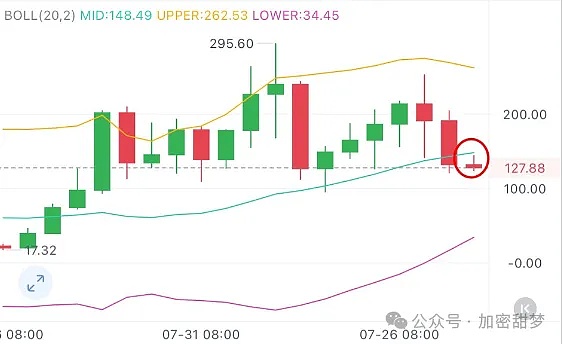
Currently trading between the 10, 15, 20-day and monthly Bollinger mid and lower bands. Their lower bands are all in the range of 114–102, which can serve as one reference for accumulation.

All the 10, 15, 20-day EMA7-30 have been broken, offering no support.

The monthly EMA52 is at 109.5. Therefore, the accumulation range before the 100 level is broken is 114–102.

Considering extreme scenarios where a sharp spike might briefly break below 100, the levels after a false break of 100 would be 96.25–95.65. A break below 95 would be considered a real break, and the price could then fall to around 86.25–84.85.
PTB

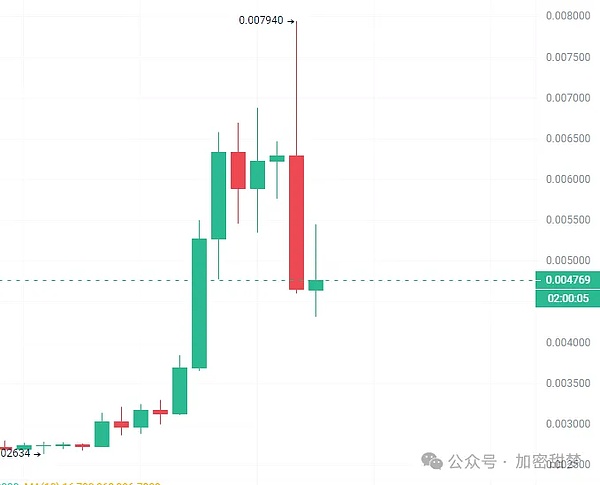
PTB is a token I wouldn't dare touch. It's like a single-player coin—going long or short is risky, and the risk-reward ratio is very low. You might get a quick profit if you're fast, but if you're slow, you'll get hit. In short, greed will eventually lead to losses. It can pump quickly and then drop over 40% in a single spike.
IR

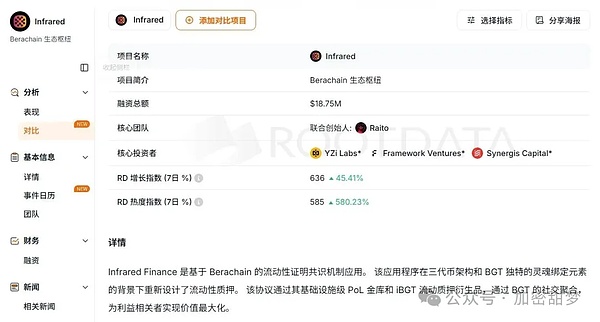
Total supply: 1 billion, initial circulating supply: 20.5%, pool price: 0.1

Pros: 1. Strong funding background—invested by Yzi Lab, co-founder of Bera. 2. Protocol revenue this year exceeded $8 million, TVL is still 210M. 3. Pool price is not expensive at 0.1, 100M. 4. Airdrop is on CEX, and participants say the airdrop is small.

Cons: 1. Protocol revenue has been declining due to the bear market—it peaked but didn't launch a token then, and is doing so now. Peak monthly revenue was $2.81 million in March, but this month it's only around $10,000 so far. 2. Tokenomics haven't been announced, and there's little community discussion.

The project's only chance is to accumulate筹码 during the sell-off, then counter-screw the community to achieve control, fully secure contract positions, and make a profit through contracts. Otherwise, there's basically no opportunity. Not planning to buy at open, will wait for the sell-off to stabilize. With the赚钱效应 of previous projects, market attention is returning to ALPHA, and recent projects have started harvesting. Better to be cautious.
If you find our content helpful, please share our public account with your friends! Welcome to follow and stay tuned for the latest updates in the crypto space! Every sharp decline is followed by vast opportunities. If you're feeling lost about planning for the next market phase, follow Tianmeng. Contact WeChat: RFGH8689


Criptos en tendencia

Preguntas relacionadas

QWhat is the current technical outlook for Bitcoin (BTC) according to the daily chart analysis?

AThe daily chart shows BTC has broken below the trend line with a MACD death cross, indicating a bearish outlook and potential for further decline. The analysis suggests selling at resistance levels.

QWhat are the identified support levels for Ethereum (ETH) in its current correction phase?

AKey support levels for ETH include the 20-day Bollinger lower band at 2228, the EMA52 on the 20-day chart at 2752, and the June low of 2112. The EMA52 on the monthly chart at 2508 is also noted as effective support.

QWhat is the suggested buying range for Solana (SOL) before the $100 level is broken?

AThe suggested buying range for SOL before the $100 level is broken is between 114 and 102, which corresponds to the lower Bollinger bands on the 10, 15, and 20-day charts.

QWhy does the analysis advise caution with the PTB token?

AThe analysis advises extreme caution with PTB because it behaves like a single-coin token, where both long and short positions are risky. It is prone to sharp, sudden drops of over 40%, making it a low性价比 (cost-performance) asset.

QWhat are the main bullish and bearish factors mentioned for the IR token launch?

ABullish factors: Strong funding background from Yzi Lab and Bera's co-founder, $8M+ protocol revenue this year, $210M TVL, and a low pool price of $0.1. Bearish factors: Declining protocol revenue (from $2.81M peak in March to just over $10K currently), no published tokenomics, and low community discussion.

Lecturas Relacionadas

La esperada ley de criptomonedas, conocida como 'Ley de Claridad', alcanza un momento crítico: La Casa Blanca la revisará este fin de semana

El futuro de la Ley CLARITY, que busca regular el mercado de criptomonedas en EE.UU., podría depender de la respuesta de la administración Trump a una nueva propuesta bipartidista sobre cuestiones éticas. Según la periodista Eleanor Terret, la administración está revisando una contrapropuesta de los senadores Tom Tillis (republicano) y Ruben Gallego (demócrata), que permitiría a fiscales generales estatales demandar a funcionarios federales si el Departamento de Justicia no hace cumplir las normas éticas y de prevención de conflictos de interés. La propuesta busca abordar las preocupaciones demócratas de que el Departamento de Justicia, bajo control de Trump, no ofrezca garantías suficientes. El anterior proyecto, respaldado por la Casa Blanca, fue criticado por mantener las competencias de aplicación en ese departamento y por expirar en enero de 2029. Se espera que la Casa Blanca revise la propuesta este fin de semana. Si se alcanza un acuerdo sobre las disposiciones éticas, podría procederse a una votación en el Senado sobre la Ley CLARITY, aunque aún no se cuenta con los 60 votos necesarios. El proyecto de ley, aprobado en comité con 15 votos a favor y 9 en contra, define los límites de autoridad de la SEC y la CFTC sobre los criptoactivos y establece un marco integral para este sector. También incluye normas sobre los rendimientos de las stablecoins y ciertas protecciones legales para desarrolladores de software que no prestan servicios de custodia. Un compromiso alcanzado en la regulación de stablecoins limita los pagos similares a intereses basados únicamente en la tenencia de tokens, pero permite recompensas ligadas a transacciones, pagos, programas de fidelidad o uso de la plataforma, buscando equilibrar las preocupaciones de los bancos y las demandas de las empresas de criptomonedas. Sin un acuerdo sobre las disposiciones éticas, el avance de la Ley CLARITY podría estancarse nuevamente, prolongando la incertidumbre regulatoria.

cryptonews.ruHace 5 min(s)

La esperada ley de criptomonedas, conocida como 'Ley de Claridad', alcanza un momento crítico: La Casa Blanca la revisará este fin de semana

cryptonews.ruHace 5 min(s)

Entrevista con un ejecutivo de Robinhood: Meme + Tokenización de acciones de EE.UU. como estrategia de adquisición de clientes "en forma de pesa", todas las líneas de negocio generan ingresos por valor de cientos de millones

**Resumen: Robinhood Chain, el enfoque "Bimodal" para la captación de usuarios** Robinhood Chain, la L2 de Ethereum de Robinhood, lanzó su red principal hace tres semanas, logrando un volumen de intercambio semanal en DEX de $30 mil millones, más de 100 millones de transacciones y un TVL superior a $3 mil millones. Johann Kerbrat, Vicepresidente Sénior y Director General de Crypto e Internacional de Robinhood, explica la estrategia "bimodal": atraer a los usuarios con memecoins y al mismo tiempo ofrecer activos del mundo real tokenizados (RWA), como acciones estadounidenses disponibles en más de 120 países. El objetivo central es llevar gradualmente los 27 millones de cuentas de Robinhood a la cadena, simplificando la complejidad de DeFi con una interfaz de usuario familiar. Esto representa la fusión entre CeFi y DeFi. La cadena usa la tecnología de Arbitrum, priorizando velocidad, bajo coste en gas y la seguridad de Ethereum, en lugar de construir una L1 propia. Robinhood ve el futuro como una oportunidad para "agrandar el pastel" de las finanzas descentralizadas para todos, no solo competir por la cuota de mercado con plataformas como Base. Las colaboraciones con socios DeFi se basan en el cumplimiento normativo y la creación de experiencias únicas. El plan a largo plazo es convertir a Robinhood en una "súper app" financiera integral.

marsbitHace 1 hora(s)

Entrevista con un ejecutivo de Robinhood: Meme + Tokenización de acciones de EE.UU. como estrategia de adquisición de clientes "en forma de pesa", todas las líneas de negocio generan ingresos por valor de cientos de millones

marsbitHace 1 hora(s)

Trading

Spot

Artículos destacados

Cómo comprar IR

¡Bienvenido a HTX.com! Hemos hecho que comprar Infrared Finance (IR) sea simple y conveniente. Sigue nuestra guía paso a paso para iniciar tu viaje de criptos.Paso 1: crea tu cuenta HTXUtiliza tu correo electrónico o número de teléfono para registrarte y obtener una cuenta gratuita en HTX. Experimenta un proceso de registro sin complicaciones y desbloquea todas las funciones.Obtener mi cuentaPaso 2: ve a Comprar cripto y elige tu método de pagoTarjeta de crédito/débito: usa tu Visa o Mastercard para comprar Infrared Finance (IR) al instante.Saldo: utiliza fondos del saldo de tu cuenta HTX para tradear sin problemas.Terceros: hemos agregado métodos de pago populares como Google Pay y Apple Pay para mejorar la comodidad.P2P: tradear directamente con otros usuarios en HTX.Over-the-Counter (OTC): ofrecemos servicios personalizados y tipos de cambio competitivos para los traders.Paso 3: guarda tu Infrared Finance (IR)Después de comprar tu Infrared Finance (IR), guárdalo en tu cuenta HTX. Alternativamente, puedes enviarlo a otro lugar mediante transferencia blockchain o utilizarlo para tradear otras criptomonedas.Paso 4: tradear Infrared Finance (IR)Tradear fácilmente con Infrared Finance (IR) en HTX's mercado spot. Simplemente accede a tu cuenta, selecciona tu par de trading, ejecuta tus trades y monitorea en tiempo real. Ofrecemos una experiencia fácil de usar tanto para principiantes como para traders experimentados.

861 Vistas totalesPublicado en 2025.12.17Actualizado en 2026.06.02

Cómo comprar IR

Discusiones

Bienvenido a la comunidad de HTX. Aquí puedes mantenerte informado sobre los últimos desarrollos de la plataforma y acceder a análisis profesionales del mercado. A continuación se presentan las opiniones de los usuarios sobre el precio de IR (IR).

活动图片












