SUI Action: Weekly Pattern Suggests Price Is Coiling For A Bigger Move

bitcoinistPublicado a 2025-06-22Actualizado a 2025-06-22

Resumen

The SUI/USDT weekly chart is attracting attention as the price action tightens within a defined range. After a period of...

Trusted Editorial content, reviewed by leading industry experts and seasoned editors. Ad Disclosure

The SUI/USDT weekly chart is attracting attention as the price action tightens within a defined range. After a period of decline and consolidation, the asset is stabilizing, with key support levels holding firm. The structure suggests that the asset may be gearing up for a potential shift in trend.

Price Action Coiling Up — Will SUI Snap Upward?

SUI has formed a symmetrical triangle squeeze, a pattern known for preceding explosive moves. Its price recently dipped below the lower trendline, raising alarms for a potential breakdown. However, Atres Crypto Academy noted on X that this may have been a bull trap, a temporary shakeout before a sharp reversal.

If SUI snaps back into the triangle with strong momentum, it would signal that the breakdown was a false move, and bulls may be regaining control. In that case, the stage would be for an upside breakout, with the target set at $3.50 or more.
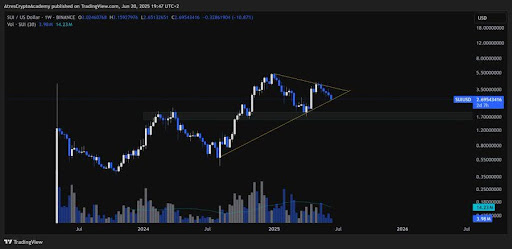
SUI
Source: Atres Crypto on X

SUI price action is forming a falling wedge pattern, a bullish reversal setup. After dropping 37% from its May highs, the altcoin is now testing a key support zone between $2.70 and $3.00, an area that has typically drawn buying interest. WEBBZ.SUI highlighted that a confirmed breakout could propel the token toward the $4.50 to $5.00 region, and if support fails to hold, the next critical level will be the $2.00 zone.

According to Gemxbt, the 1-hour chart is showing a consolidation phase around the $2.85 level, with the price stabilizing above the 5, 10, and 20-hour moving averages, signaling strength and support in this zone.

The Relative Strength Index (RSI) is also trending upward, steadily moving away from oversold territory. This suggests that bullish momentum is building. Furthermore, the Moving Average Convergence Divergence (MACD) is approaching a bullish crossover, indicating possible upward price movement if confirmed by increased volume.

Signs Of Strength Emerging 

SUI has quietly surged from under $0.60 to over $4.00 in less than a year, making an impressive nearly 7x gain despite pullbacks. The price-performance underscores the growing interest and momentum behind the token.

Emilio Crypto Bojan mentioned that the fundamentals are starting to catch up with the price action. DeFi aggregator volume has now surpassed $45 billion, with a 19% increase over the past 30 days, and bullish vibes are building ahead.

SUI is showing signs of strength after holding the critical support zone at $2.70, suggesting that a potential bounce is building. Presently, the market structure shows that conditions are favorable for a reversal, provided the bulls step in decisively. Cult Babe also revealed that the price action appears to be preparing for an upward move, with the key focus of reclaiming the $2.90 resistance level.

SUI
SUI trading at $2.7 on the 1D chart | Source: SUIUSDT on Tradingview.com
Featured image from Shutterstock, chart from Tradingview.com
Editorial Process for bitcoinist is centered on delivering thoroughly researched, accurate, and unbiased content. We uphold strict sourcing standards, and each page undergoes diligent review by our team of top technology experts and seasoned editors. This process ensures the integrity, relevance, and value of our content for our readers.

Godspower Owie is my name, and I work for the news platforms NewsBTC and Bitcoinist. I sometimes like to think of myself as an explorer since I enjoy exploring new places, learning new things, especially valuable ones, and meeting new people who have an impact on my life, no matter how small. I value my family, friends, career, and time. Really, those are most likely the most significant aspects of every person's existence. Not illusions, but dreams are what I pursue.

Criptos en tendencia

Lecturas Relacionadas

Trading

Spot

Artículos destacados

Cómo comprar MOVE

¡Bienvenido a HTX.com! Hemos hecho que comprar Movement (MOVE) sea simple y conveniente. Sigue nuestra guía paso a paso para iniciar tu viaje de criptos.Paso 1: crea tu cuenta HTXUtiliza tu correo electrónico o número de teléfono para registrarte y obtener una cuenta gratuita en HTX. Experimenta un proceso de registro sin complicaciones y desbloquea todas las funciones.Obtener mi cuentaPaso 2: ve a Comprar cripto y elige tu método de pagoTarjeta de crédito/débito: usa tu Visa o Mastercard para comprar Movement (MOVE) al instante.Saldo: utiliza fondos del saldo de tu cuenta HTX para tradear sin problemas.Terceros: hemos agregado métodos de pago populares como Google Pay y Apple Pay para mejorar la comodidad.P2P: tradear directamente con otros usuarios en HTX.Over-the-Counter (OTC): ofrecemos servicios personalizados y tipos de cambio competitivos para los traders.Paso 3: guarda tu Movement (MOVE)Después de comprar tu Movement (MOVE), guárdalo en tu cuenta HTX. Alternativamente, puedes enviarlo a otro lugar mediante transferencia blockchain o utilizarlo para tradear otras criptomonedas.Paso 4: tradear Movement (MOVE)Tradear fácilmente con Movement (MOVE) en HTX's mercado spot. Simplemente accede a tu cuenta, selecciona tu par de trading, ejecuta tus trades y monitorea en tiempo real. Ofrecemos una experiencia fácil de usar tanto para principiantes como para traders experimentados.

438 Vistas totalesPublicado en 2024.12.13Actualizado en 2026.06.02

Cómo comprar MOVE

Discusiones

Bienvenido a la comunidad de HTX. Aquí puedes mantenerte informado sobre los últimos desarrollos de la plataforma y acceder a análisis profesionales del mercado. A continuación se presentan las opiniones de los usuarios sobre el precio de MOVE (MOVE).

活动图片