Weather is not like elections—it has no stance; it's not like the NBA—it has no home team. But it is precisely this market that has attracted domestic users. The reason is simple: everyone has a feeling about it, and everyone thinks they understand Shanghai's weather.
But "feeling like you understand" and "being able to make money" are two different things.
Biteye shares three things today:
1. Understand the settlement rules
2. Establish a method for weather prediction
3. Use a system to find trading opportunities others can't see
1. First, Figure Out: How Exactly Does This Weather Market Settle?
1. The temperature settled is not what you think it is
Many people make a mistake when participating for the first time: they check their phone's weather app and bet on the highest temperature accordingly. But the app shows the temperature in downtown Shanghai, while Polymarket settles using the actual measured data from Shanghai Pudong International Airport (ZSPD weather station). This data is publicly available through the American weather platform Wunderground, and PM directly reads the records on WU as the basis for settlement.
Two locations, two numbers. Pudong Airport is located on the east side of the city, right next to the Yangtze River estuary, and is affected by sea breezes, so the temperature is usually lower than in the city center. This difference isn't usually noticeable, but near the threshold boundaries, it can be the difference between a correct and incorrect bet.
So you can see this kind of confusion in the weather market comments: "It clearly felt warmer today than yesterday, why is the displayed maximum temperature lower?"
2. The number is correct, but the unit isn't what you think
WU's data comes directly from the METAR reports (the global aviation standard meteorological telegraph format) reported hourly by the airport.
There's a detail hidden here: METAR records temperatures in whole Fahrenheit numbers, and WU displays this number without conversion or correction.
Most weather forecast systems and meteorological models output temperatures with decimal points. The more refined your model is, the easier it is to overlook this crude detail.
3. Shanghai Temperature Patterns
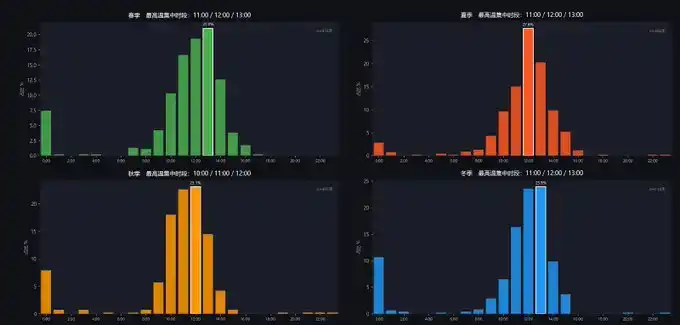
After scraping nearly 1900 days of data from the ZSPD station, the occurrence period of Shanghai's highest temperature is more concentrated than imagined:
· Highly concentrated between 11:00-13:00 across all four seasons,
· The concentration is highest at 12:00 in summer, with that single hour accounting for 27.6% of the entire season.
· The peak period in autumn is slightly earlier, with 10:00 also being one of the high-frequency periods.
Knowing the pattern is the first step, but patterns don't watch the market themselves. When the daily high temperature appears, whether it has been broken, and how far it is from the threshold.
So the editor built this system: to predict as accurately as possible which Celsius threshold the day's maximum temperature will fall into before daily settlement.
2. Five Methods, Three Worked
After understanding the market rules, the next question is: how to predict the day's maximum temperature?
As a weather novice, the first step was to ask ChatGPT: How does the meteorological industry actually calculate the day's maximum temperature, and what are the mature methods? ChatGPT provided a theoretical framework, and Claude turned the framework into code. Using the two AIs together, the system was built over a weekend.
Five methods were tried in total, but only three ended up working.
Those that worked:
1. WC + ECMWF Ensemble Forecast
Predicting the maximum temperature first requires data. Two sources were adopted:
· Weather Company (WC) is a commercial weather API providing hourly forecast data with high precision;
· ECMWF is the global meteorological model from the European Centre for Medium-Range Weather Forecasts, more sensitive to large-scale weather systems.
The two sources have their own pros and cons, so they were made to vote with weighted averages. The weights are dynamically adjusted based on the day's weather type: trust WC more on sunny days, trust ECMWF more on days with high cloud cover and wind speed.
2. Real-time Correction: Estimating the Peak Using Warming Data
The forecast was calculated last night, but today's weather is constantly changing. So what this module does is: use the actual measured data that has already happened this morning to estimate how high it can go today.
The logic isn't complicated; the editor found that 8-9 AM in Shanghai is the fastest warming period. After the system gets the measured temperature at this time, it checks historical data: for the same season, at the same time, how much higher did it get on average in the past.
Then add two corrections:
· Apply a discount for more clouds; the cloudier it is, the more the warming is hindered.
· Apply a discount for stronger wind; strong wind accelerates heat loss. This calculates an "extrapolation estimate."
Pressure, dew point, and humidity were also included in the calculation, but they were removed after backtesting showed these factors had a smaller, lower correlation impact.
But relying solely on extrapolation isn't stable enough. Here, a concept similar to Kalman gain is used. Simply put, it takes a weighted average between the "extrapolation result" and the "original forecast," and this weight changes automatically over time.
· At 6 AM, extrapolation only accounts for 20%, mostly still trusting the forecast
· By noon 12 PM, extrapolation accounts for 72%
· After 1 PM, it almost entirely trusts the actual measurements, accounting for 85%
The later it is, the more important the current events are; the earlier it is, the more reference value the historical forecast has.
After 2 PM, the system judges that the peak has most likely passed, directly takes the day's highest temperature from the historical record to lock in the result, and stops extrapolating.
3. Is Today a Warming Day?
This is the most satisfying module in the entire system. It makes a judgment every early morning: Will today's maximum temperature be higher than yesterday's?
Every day between 2-4 AM, the system collects a batch of meteorological data and feeds it to this model:
· Changes in air pressure over the past 3 hours and 12 hours
· Wind direction and speed in the early morning, cloud conditions
· The magnitude of warming/cooling yesterday, the temperature trend over the past three days, whether yesterday's temperature was above or below average
· Plus the month, season, the day of the year, whether it rained yesterday
The model output is divided into five levels: Warming Day, Slightly Warming, Flat, Slightly Cooling, Cooling Day, along with a confidence level.
However, the accuracy of this method varies greatly by season.
Most accurate in winter: When cold air arrives, pressure rises sharply, north winds strengthen—the signals are extremely clear, and the model can spot it instantly.
Worst in autumn: Cold and warm air masses repeatedly wrestle, temperatures rise today only to fall back tomorrow—historical patterns fail fastest in this season.
Eliminated methods:
1. Fourier Numerical Prediction
Initially tried using Fourier analysis to fit the periodic patterns of historical temperatures to see if it could directly predict the day's maximum temperature.
The result found that all it could tell you was "what the historical average is for this season." Shanghai's weather is too random; the Fourier fit produced a smooth average curve, not the real daily fluctuations. The error was 3.6°C, and it was 100% systematically underestimated, so it was deleted.
2. ERA5 Peak Time Prediction
ERA5 is the global historical reanalysis dataset from the European Climate Centre, used to predict what time the day's maximum temperature will occur.
Backtest results:
· ≤1 hour accuracy 59.6%
· ≤2 hours accuracy 81.3%
It sounds okay, but the problem is that PM's precision is higher, leaving traders with a very short time window for judgment. If it can't predict the peak within half an hour, it's better to just watch Polymarket's data, so this method was淘汰 (eliminated).
3. System in Practice: Two Cases and Shortcomings Reflection
Polymarket's weather market opens for trading 4 days in advance. Popular temperature thresholds are usually fully priced early in the market opening. Buying directly on high-probability thresholds offers a poor risk-reward ratio.
So the strategy the editor adopted is: wait for the signal, wait for the time window after warming, and then enter the market.
Based on the self-built weather system, the following two operations were performed:
Case 1:
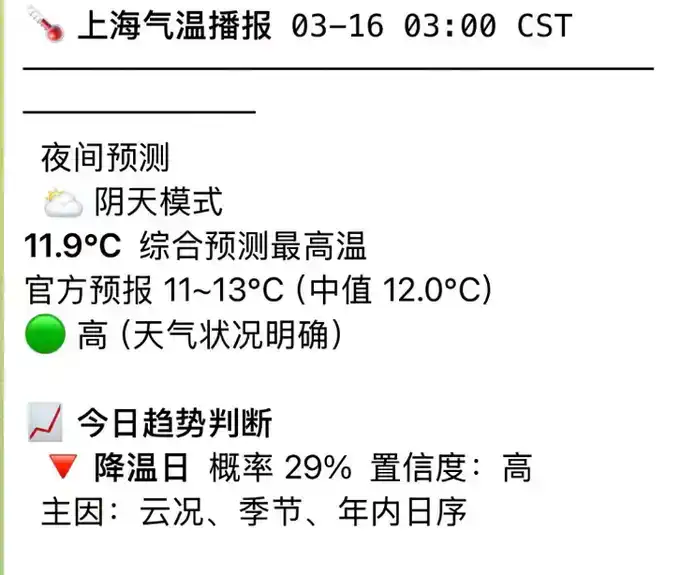
On the early morning of the 16th, the Telegram channel pushed a report from the night mode: tomorrow is a cooling day. The reasons were that the cloud cover was thick that night, and both the season and the day of the year pointed towards cooling.
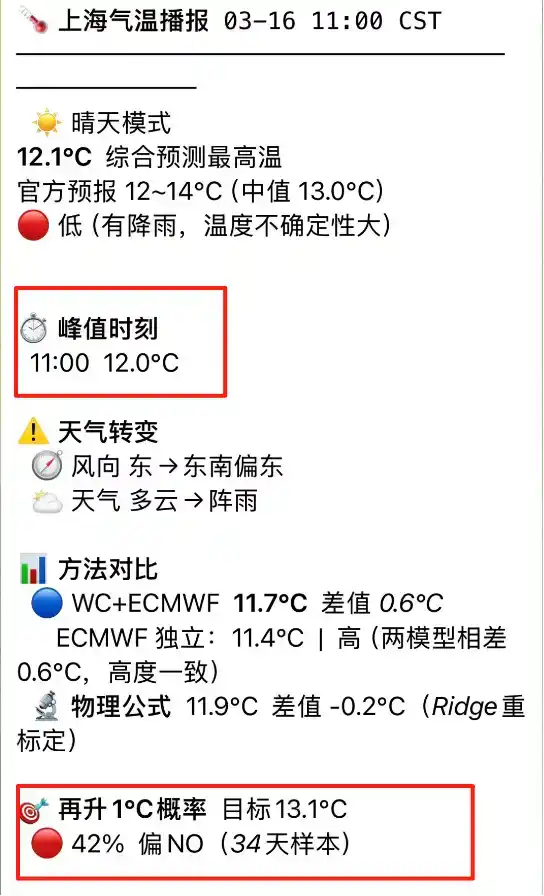
The editor did not bet immediately at this point. The early morning signal was just the first layer of reference.
By 11 AM, the system pushed a real-time report during the warming period. The actual measured high temperature had already reached 12°C, and the +1°C probability score gave a result: the probability of rising another 1°C today was 42%, leaning towards not warming further.
Combined with the slightly cooling signal from the early morning logistic regression, the two modules were in agreement. The signal was much clearer now than in the early morning. So a bet was placed that the 16th's maximum temperature would not exceed 13°C.
Settlement that day: 12°C. The previous day, the 15th, was 15°C, a drop of 3 degrees.
Case 2:
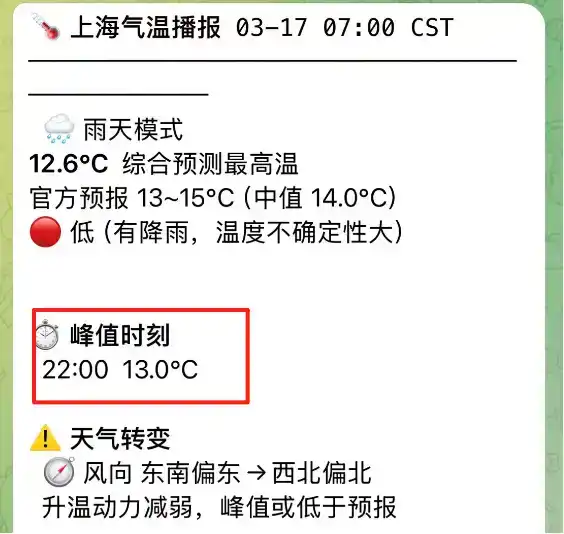
Another example is Shanghai's weather on the 17th (today). The weather system can also serve as an early warning: the push received at 7 AM showed an abnormal peak time: 22:00
Normally, the peak temperature on a sunny day appears between 1-3 PM, but today's peak is at 10 PM, indicating this is not solar heating but warm, moist air transport at night. It rained all day, with cloud cover 97-100%, and almost zero sunshine.
At this point, opening Polymarket, the price for 12°C was still at 53%. Someone in the community was confused: It's already afternoon, the temperature is only 11°C, the normal peak period is long gone, why are people still buying 12°C?
Behind this confusion is that people are still using sunny day logic to judge a rainy day market.
The system is not confused. It identified today's weather type clearly in the morning: abnormal peak time, obvious deviation between the current temperature and market expectations. This is an information gap, and the information gap is a trading opportunity.
This is precisely the meaning of building this system: Easier to identify opportunities; faster to warn of risks.
What are the system's shortcomings?
A system built over a weekend cannot be without flaws:
· Autumn accuracy is only 63.7%, close to a coin toss.
· Cold and warm air masses wrestle repeatedly this season, temperatures rise today and fall back tomorrow—historical patterns fail fastest in autumn.
· Pressure characteristics are not available in live trading. Pressure changes were used as a feature when training the model, and backtest results were good.
· The signal of cold air passing through is very clear. But during live operation, the current interface cannot obtain real-time pressure data.
· Coastal correction is still waiting for more data activation. The sea breeze effect at Pudong Airport is real, and the system has built a corresponding correction module, but there aren't enough backtest samples yet.
For a system that has only been running for a weekend, finding these problems is already a gain. Next step: fix it while running.
4. Conclusion
Meteorology has developed for hundreds of years, using satellites, supercomputers, and global models, yet weather forecasts still dare not guarantee 100% accuracy for tomorrow. It's not that scientists aren't trying hard enough; it's that the atmospheric system itself is chaotic. A one-degree difference in initial conditions can lead to completely different results.
This system, which has only been running for a weekend, will of course make mistakes. Autumn accuracy is nearly a coin toss, the system might not react in time if cold air arrives early, and the sea breeze effect hasn't been fully captured yet.
But that's not important. Participating in prediction markets doesn't require being right every time; it only requires having one more layer of information than the market when the odds are advantageous.