Bitcoin Cash: Here’s why BCH traders should watch THIS buy signal

ambcryptoPublished on 2026-03-20Last updated on 2026-03-20

Abstract

Bitcoin Cash (BCH) is holding a key long-term demand zone at $440, with similarities to a previous local bottom that led to a rally. While the 1-day chart shows a bearish structure and low trading volume remains a concern, a short-term bullish opportunity has emerged. The 4-hour chart flipped bullish on March 16, with a rebound from $449 and positive indicators like the DMI signaling an uptrend. A break above $440 would invalidate the bullish outlook, but if momentum continues, targets lie at $494, $510, and possibly $570—especially if Bitcoin remains strong above $70k.

Bitcoin Cash [BCH] continued to hold on to a long-term demand zone at the $440 level. Previously, AMBCrypto had reported that the on-chain metrics gave mixed signals. There were similarities to the October 2025 local bottom that resulted in a BCH rally to $660 by January 2026.

Overall, the strength of Bitcoin [BTC] could have a big say on how Bitcoin Cash reacted at the $440 critical demand zone. So far, the reaction has been positive, as BTC defended the $70k level recently and bulls looked to push prices higher once more.

A deeper dive into the short-term price action showed that Bitcoin Cash presented a buying opportunity for swing traders. Here’s how traders can plan their next move.

Decoding Bitcoin Cash’s long-term range
Source: BCH/USDT on TradingView

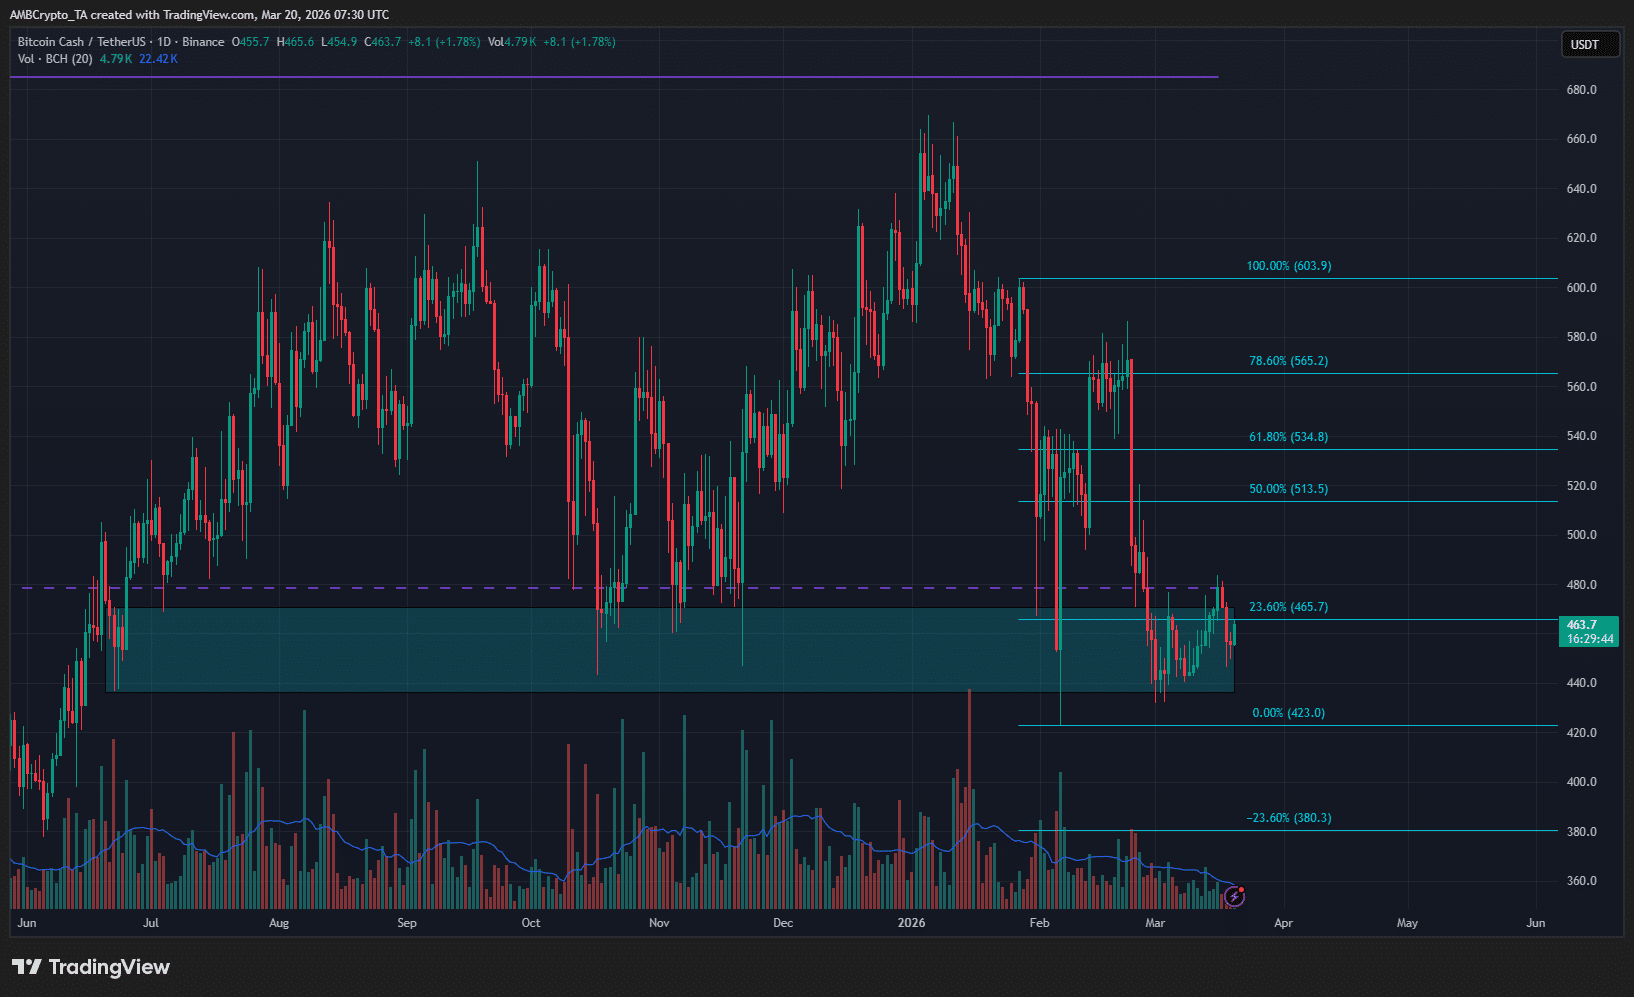
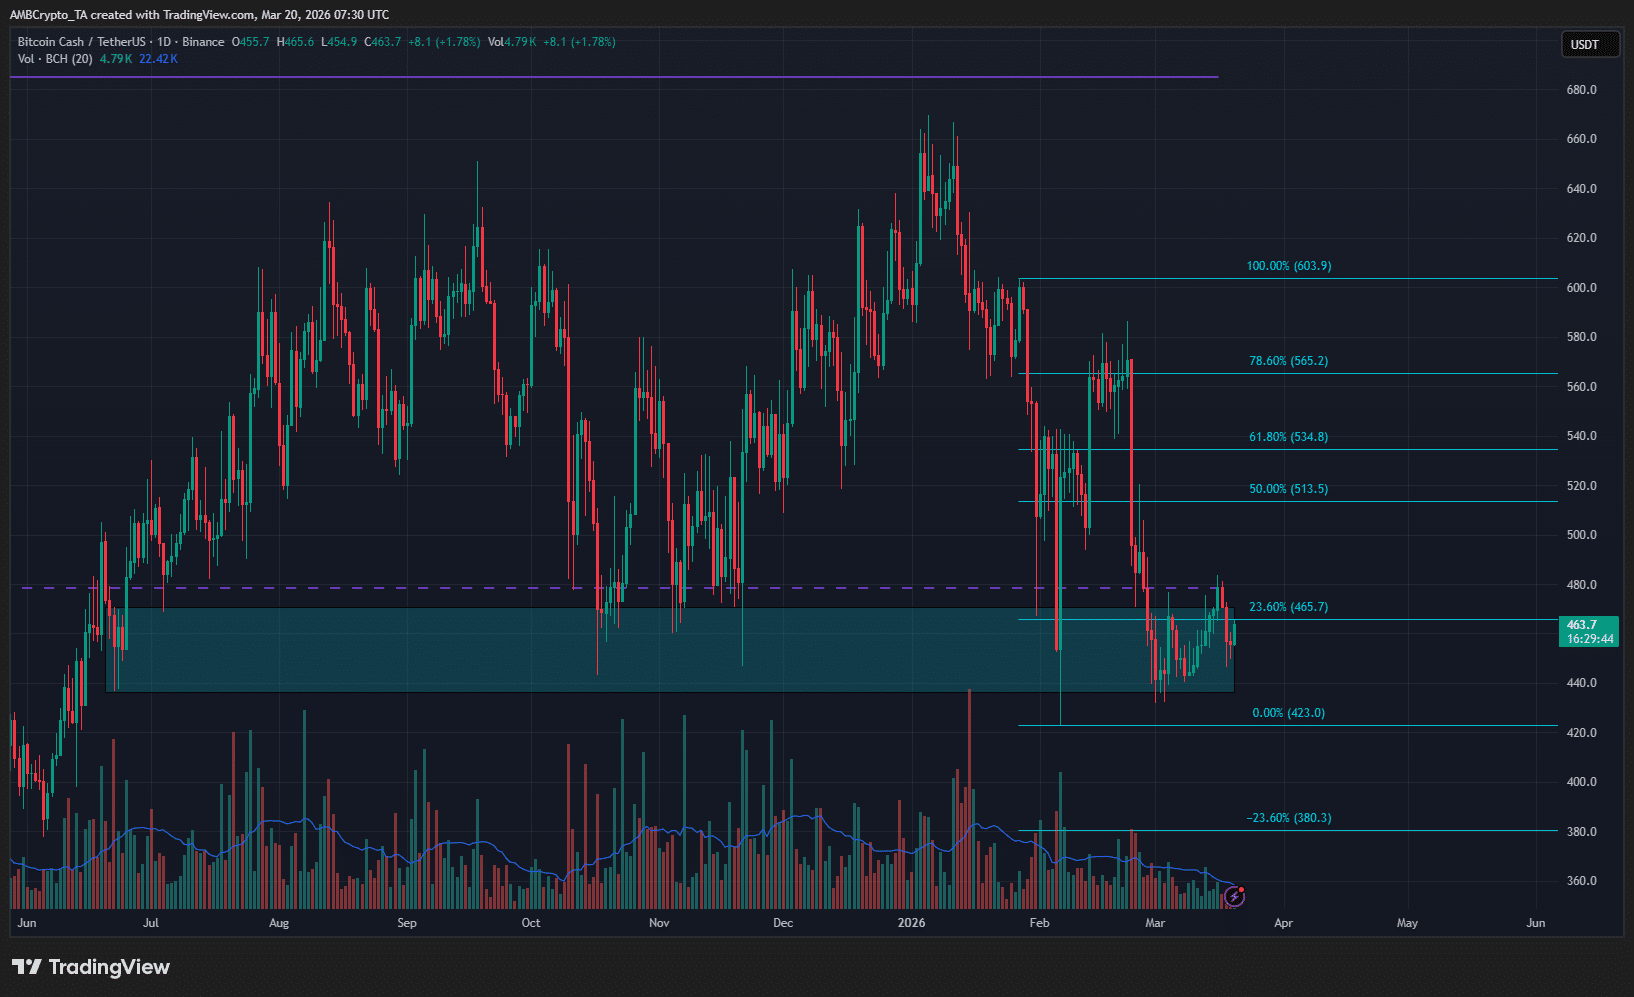
The long-term range extended from $272-$684, and its mid-range level was at $478. At the time of writing, Bitcoin Cash had a bearish structure on the 1-day chart.

Its trading volume had been dwindling over the past six weeks during the downtrend. Despite the recent bounce, the volume was still unable to climb back above the 20-day average.

Investors would see this as a warning sign. The buying volume and aggressive demand need to strengthen before a recovery toward the range highs is made possible.

Moreover, the current Bitcoin rally was likely only a retracement within a broader bear market. This could hurt the BCH bulls who are expecting a multi-month rally.

Does BCH present a buying opportunity?
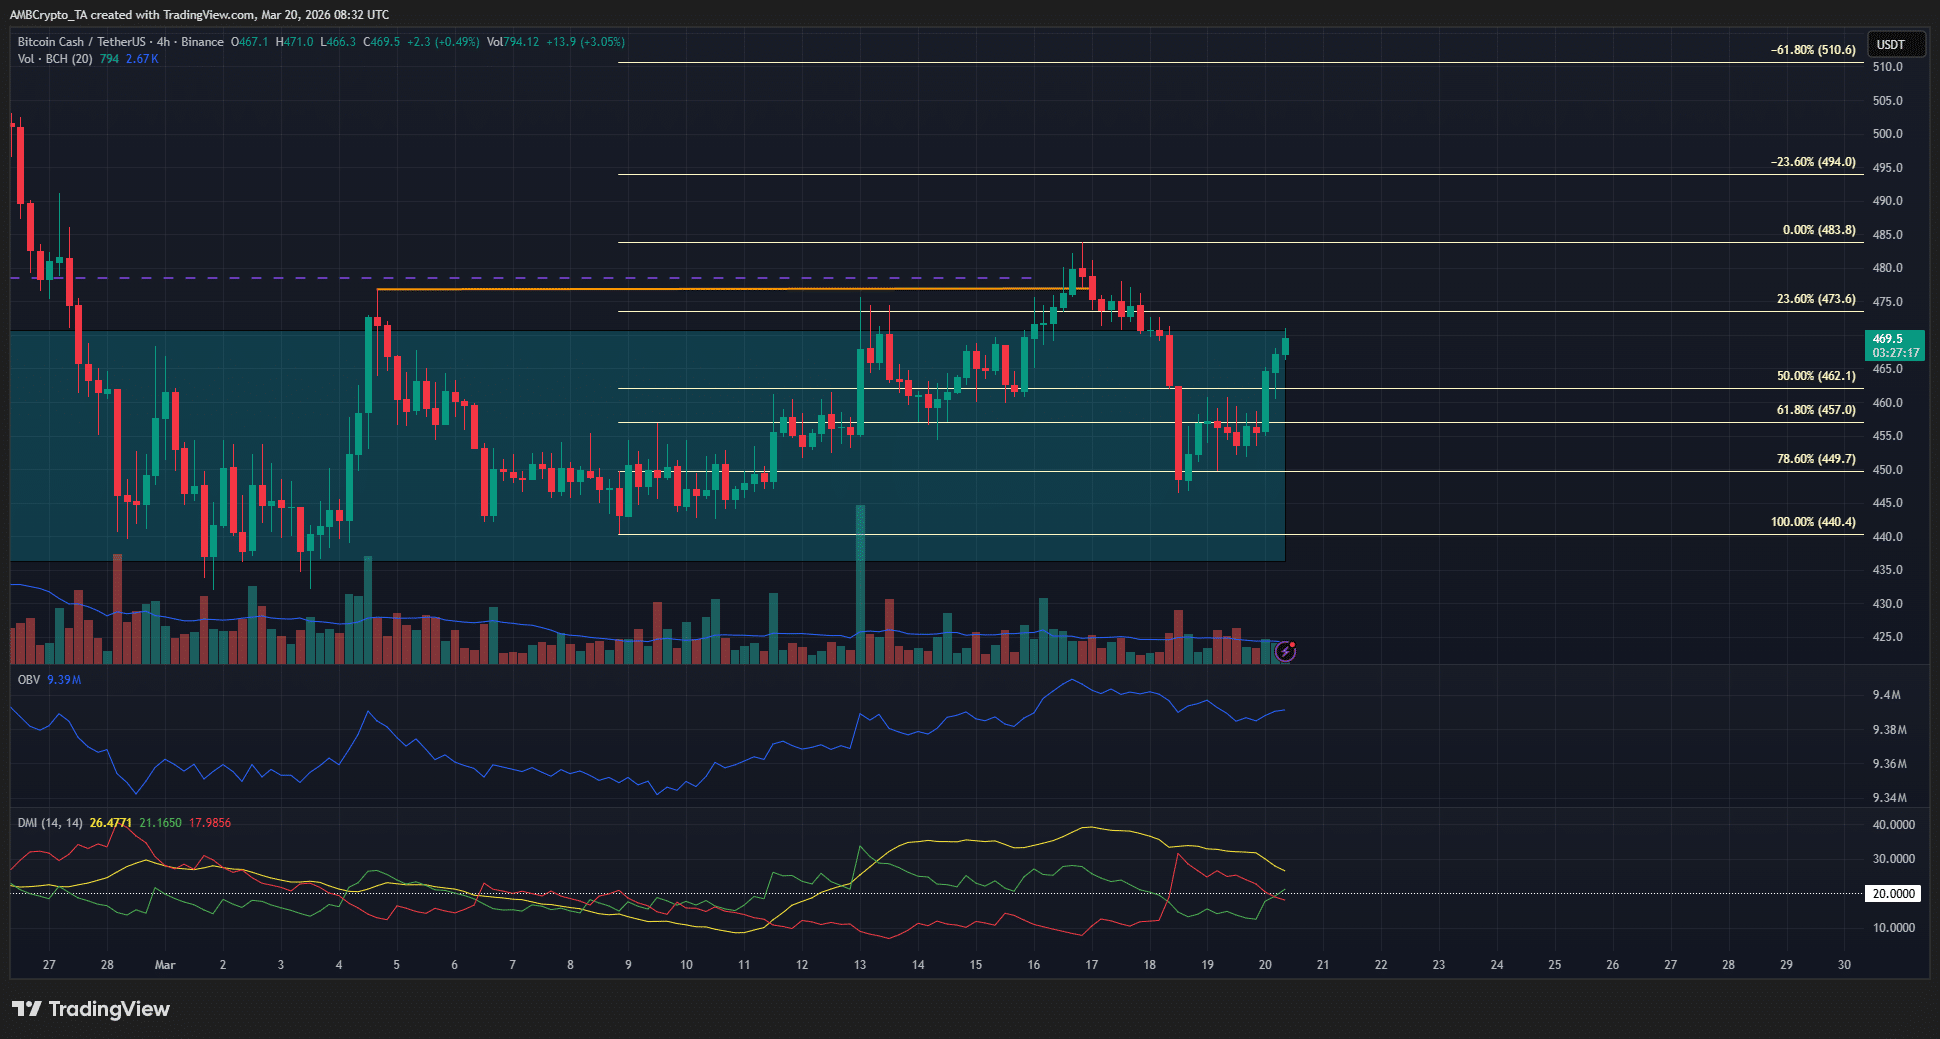
Source: BCH/USDT on TradingView

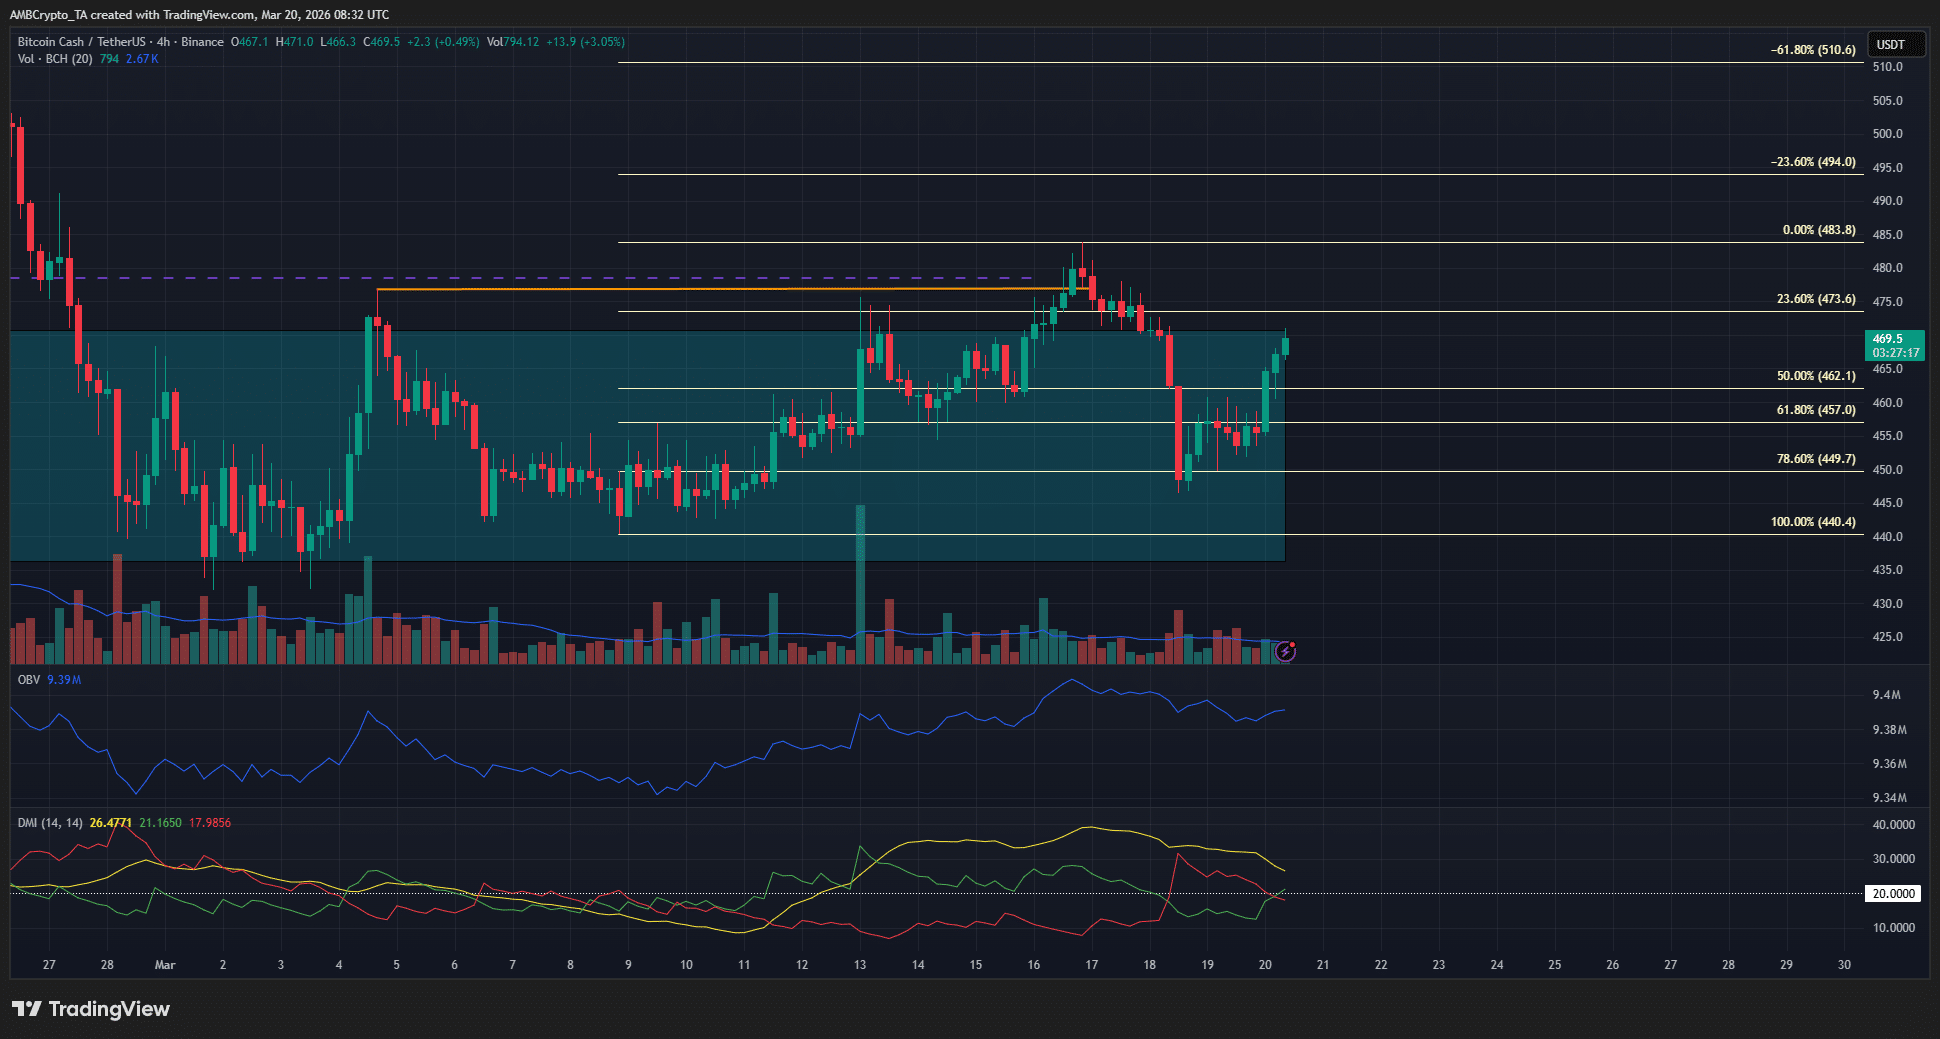
Despite the challenges on the higher time horizons, there was likely a buying opportunity for the altcoin now. The 4-hour structure saw a bullish flip (orange) on Monday, the 16th of March.

A subsequent retracement to $449 represented a test of a key Fibonacci support, and BCH has rebounded since then. The OBV has made higher lows over the past two weeks. The DMI has flipped to show a strong uptrend in progress on this timeframe.

A drop below the $440 level would invalidate this bullish idea. Meanwhile, the $494 and $510 levels are the next price targets. It is possible that the current move could go as high as $570, provided BTC can continue climbing higher.


Final Summary

  • Bitcoin Cash bulls have defended the $440 demand zone and forced a short-term rally to $470.
  • Though the trading volume was lower in comparison to periods earlier in 2026, there was a good chance BCH would rally toward $500 and higher.


Trending Cryptos

Related Questions

QWhat is the long-term demand zone that Bitcoin Cash (BCH) is holding, as mentioned in the article?

AThe long-term demand zone that Bitcoin Cash is holding is at the $440 level.

QAccording to the article, what is the mid-range level of Bitcoin Cash's long-term trading range?

AThe mid-range level of Bitcoin Cash's long-term trading range is $478.

QWhat signal on the 4-hour chart from March 16th suggested a potential buying opportunity for BCH?

AA bullish flip on the 4-hour chart on March 16th suggested a potential buying opportunity.

QWhat would invalidate the short-term bullish idea for Bitcoin Cash?

AA drop below the $440 level would invalidate the short-term bullish idea.

QWhat are the next two price targets mentioned for BCH if the bullish move continues?

AThe next two price targets mentioned are $494 and $510.

Related Reads

Goldman Sachs: July Smashes Through Crowded Trades, U.S. Stock Bull Market Not Broken but Harder to Navigate

Goldman Sachs: July Sees Crowded Trades Unwound, U.S. Bull Market Intact but Getting Tougher. The U.S. stock market in July did not see an index-level crash, but rather a significant unwinding of speculative positions. While the S&P 500 remained stable—trading within a narrow 3.5% range and staying within 2% of its high—underlying market dynamics were volatile. Heavily crowded trades, particularly in high-momentum tech, AI-linked stocks, and Asian strategies, faced severe pressure and forced deleveraging. Data indicates this was a meaningful cleanse, not a minor adjustment. Global tech exposure saw its largest sell-off in over five years, leverage in Korean equity ETFs plummeted, and Goldman's prime brokerage recorded the largest gross exposure reduction since late 2022. Leverage on momentum factors among fundamental long/short clients fell to the 28th percentile of its one-year range. The AI trade narrative shifted from pure potential to a focus on tangible returns. While Meta failed to show clear AI monetization, Microsoft and Amazon provided evidence that massive capital expenditure is translating into scalable revenue and product growth, preventing a blanket sell-off of the AI sector. The Federal Reserve's more opaque communication style and volatility in long-end Treasury yields have introduced new friction, particularly for rate-sensitive growth and tech stocks. The broader outlook for U.S. equities remains favorable, supported by a strong economy, robust earnings, and substantial AI capital expenditure. However, risk/reward is no longer cheap, and the market's upward elasticity has weakened. The Nasdaq 100's trajectory—up 12% year-to-date despite significant pullbacks—illustrates that the bull trend persists but the path is becoming more difficult. The key lesson from July is that the market no longer rewards crowded, highly leveraged trades, requiring more disciplined and liquid portfolio approaches.

marsbit10m ago

Goldman Sachs: July Smashes Through Crowded Trades, U.S. Stock Bull Market Not Broken but Harder to Navigate

marsbit10m ago

Interview with Robinhood Executive: Meme + Tokenized US Stocks as "Barbell" Customer Acquisition Strategy, All Business Lines Achieve Hundreds of Millions in Revenue

Interview with Robinhood executive Johann Kerbrat reveals the company's "barbell" customer acquisition strategy for its new Robinhood Chain, combining meme tokens with tokenized stocks. Three weeks after mainnet launch, the chain has seen over $3B in weekly DEX volume and 105M transactions. Kerbrat explains the logic behind the permissionless chain: meme tokens attract DeFi users, while tokenized real-world assets (RWA), currently over 90 US stocks and ETFs accessible in 120+ countries, serve global users. The goal is to bring Robinhood's 27 million funded accounts on-chain by simplifying DeFi with a user-friendly interface, exemplified by features like Robinhood Earn which offers yield without requiring wallet management. Built on Arbitrum's technology stack for its speed, low cost, and Ethereum's security, the chain focuses on financial products like Earn, spot trading, and perpetuals. Kerbrat downplays direct competition with platforms like Base, emphasizing the goal of expanding the overall market for on-chain assets. He details selective partnerships (e.g., Morpho, Lighter) based on compliance, unique UX, and differentiation. While regulatory clarity is pending for US perpetuals, the expansion continues via Bitstamp in Europe. Finally, Kerbrat positions Robinhood as a "super app" integrating stocks, options, crypto, banking, and AI trading, with all major business lines generating hundreds of millions in revenue. For the chain, current priority is driving adoption over maximizing gas fee revenue.

marsbit2h ago

Interview with Robinhood Executive: Meme + Tokenized US Stocks as "Barbell" Customer Acquisition Strategy, All Business Lines Achieve Hundreds of Millions in Revenue

marsbit2h ago

Fidelity Q3 Report: BTC, ETH, and SOL Continue to Build Bottoms; How Much Further Will This Crypto Bear Market Go?

Fidelity's Q3 Crypto Signal Report analyzes the current bear market, noting Bitcoin (BTC), Ethereum (ETH), and Solana (SOL) are in a prolonged bottoming phase. Key indicators like the weighted Net Unrealized Profit/Loss (NUPL) have turned negative (-0.01), signaling the market is slightly below its aggregate cost basis, with BTC acting as the primary stabilizing asset. BTC's dominance has risen to 68%, indicating a lack of capital rotation to other digital assets. Performance has been weak across the board, with BTC, ETH, and SOL down significantly year-to-date. Market sentiment is depressed, exacerbated by substantial outflows from spot ETPs and a challenging macro environment. The report compares the current ~203-day downtrend to historical ~300-day bottoming cycles, suggesting the process may be two-thirds complete, with late 2026 as a potential timeframe to monitor. For Bitcoin, NUPL at 0.09 indicates cautious sentiment, while momentum signals remain negative. The Yardstick metric points to potential undervaluation relative to network security (hashrate). Ethereum's NUPL is deep in the "capitulation" zone at -0.43, a historically positive signal for future returns, though its momentum and network fee revenue are negative. Solana shows the deepest NUPL at -0.72 but demonstrates relative resilience in on-chain activity and stablecoin transfer volume. The report concludes that while several metrics are near historical capitulation levels, a definitive market bottom has not yet been established. The path forward likely involves continued consolidation, with BTC's relative strength and fundamental on-chain usage for ETH and SOL providing key areas for investor observation.

marsbit2h ago

Fidelity Q3 Report: BTC, ETH, and SOL Continue to Build Bottoms; How Much Further Will This Crypto Bear Market Go?

marsbit2h ago

Trading

Spot

Hot Articles

What is $BITCOIN

DIGITAL GOLD ($BITCOIN): A Comprehensive Analysis Introduction to DIGITAL GOLD ($BITCOIN) DIGITAL GOLD ($BITCOIN) is a blockchain-based project operating on the Solana network, which aims to combine the characteristics of traditional precious metals with the innovation of decentralized technologies. While it shares a name with Bitcoin, often referred to as “digital gold” due to its perception as a store of value, DIGITAL GOLD is a separate token designed to create a unique ecosystem within the Web3 landscape. Its goal is to position itself as a viable alternative digital asset, although specifics regarding its applications and functionalities are still developing. What is DIGITAL GOLD ($BITCOIN)? DIGITAL GOLD ($BITCOIN) is a cryptocurrency token explicitly designed for use on the Solana blockchain. In contrast to Bitcoin, which provides a widely recognized value storage role, this token appears to focus on broader applications and characteristics. Notable aspects include: Blockchain Infrastructure: The token is built on the Solana blockchain, known for its capacity to handle high-speed and low-cost transactions. Supply Dynamics: DIGITAL GOLD has a maximum supply capped at 100 quadrillion tokens (100P $BITCOIN), although details regarding its circulating supply are currently undisclosed. Utility: While precise functionalities are not explicitly outlined, there are indications that the token could be utilized for various applications, potentially involving decentralized applications (dApps) or asset tokenization strategies. Who is the Creator of DIGITAL GOLD ($BITCOIN)? At present, the identity of the creators and development team behind DIGITAL GOLD ($BITCOIN) remains unknown. This situation is typical among many innovative projects within the blockchain space, particularly those aligning with decentralized finance and meme coin phenomena. While such anonymity may foster a community-driven culture, it intensifies concerns about governance and accountability. Who are the Investors of DIGITAL GOLD ($BITCOIN)? The available information indicates that DIGITAL GOLD ($BITCOIN) does not have any known institutional backers or prominent venture capital investments. The project seems to operate on a peer-to-peer model focused on community support and adoption rather than traditional funding routes. Its activity and liquidity are primarily situated on decentralized exchanges (DEXs), such as PumpSwap, rather than established centralized trading platforms, further highlighting its grassroots approach. How DIGITAL GOLD ($BITCOIN) Works The operational mechanics of DIGITAL GOLD ($BITCOIN) can be elaborated on based on its blockchain design and network attributes: Consensus Mechanism: By leveraging Solana’s unique proof-of-history (PoH) combined with a proof-of-stake (PoS) model, the project ensures efficient transaction validation contributing to the network's high performance. Tokenomics: While specific deflationary mechanisms have not been extensively detailed, the vast maximum token supply implies that it may cater to microtransactions or niche use cases that are still to be defined. Interoperability: There exists the potential for integration with Solana’s broader ecosystem, including various decentralized finance (DeFi) platforms. However, the details regarding specific integrations remain unspecified. Timeline of Key Events Here is a timeline that highlights significant milestones concerning DIGITAL GOLD ($BITCOIN): 2023: The initial deployment of the token occurs on the Solana blockchain, marked by its contract address. 2024: DIGITAL GOLD gains visibility as it becomes available for trading on decentralized exchanges like PumpSwap, allowing users to trade it against SOL. 2025: The project witnesses sporadic trading activity and potential interest in community-led engagements, although no noteworthy partnerships or technical advancements have been documented as of yet. Critical Analysis Strengths Scalability: The underlying Solana infrastructure supports high transaction volumes, which could enhance the utility of $BITCOIN in various transaction scenarios. Accessibility: The potential low trading price per token could attract retail investors, facilitating wider participation due to fractional ownership opportunities. Risks Lack of Transparency: The absence of publicly known backers, developers, or an audit process may yield skepticism regarding the project's sustainability and trustworthiness. Market Volatility: The trading activity is heavily reliant on speculative behavior, which can result in significant price volatility and uncertainty for investors. Conclusion DIGITAL GOLD ($BITCOIN) emerges as an intriguing yet ambiguous project within the rapidly evolving Solana ecosystem. While it attempts to leverage the “digital gold” narrative, its departure from Bitcoin's established role as a store of value underscores the need for a clearer differentiation of its intended utility and governance structure. Future acceptance and adoption will likely depend on addressing the current opacity and defining its operational and economic strategies more explicitly. Note: This report encompasses synthesised information available as of October 2023, and developments may have transpired beyond the research period.

1.3k Total ViewsPublished 2025.05.13Updated 2025.05.13

What is $BITCOIN

Discussions

Welcome to the HTX Community. Here, you can stay informed about the latest platform developments and gain access to professional market insights. Users' opinions on the price of BTC (BTC) are presented below.

活动图片