This week, the market enters a critical phase of contention.
At the macro level, marginal changes in Federal Reserve policy expectations continue to dictate the pricing rhythm of risk assets. In the crypto market, after the previous period of consolidation, the divergence between bulls and bears is intensifying around key price levels.
This weekly review maintains the consistent framework: based on multi-timeframe structural analysis and combined with quantitative model signals, it assesses the market outlook for BTC and HYPE this week and formulates specific short- to medium-term trading plans.
It is crucial to note that all content herein represents personal technical analysis records, serving solely as a reference framework and review basis for my own trading decisions, and does not constitute any form of investment advice. The market is always more complex than predictions. Strict adherence to risk control and stop-loss discipline remains the top priority.
Summary of Core Trading Views for This Week:
- BTC Hourly Timeframe Structure Analysis (Detailed in Part 1)
- BTC Weekly Outlook & Medium/Short-Term Trading Strategies (Detailed in Part 2)
- HYPE Hourly Timeframe Structure Analysis (Detailed in Part 3)
- HYPE Weekly Outlook & Short-Term Trading Strategy (Detailed in Part 4)
Market Verification of Last Week's Trading Strategies & Core Views:
- BTC Market Outlook Verification: Last week, strictly following trading discipline, we promptly established an approximately 20% short position when market entry opportunities emerged. The medium-term trading plan outlined in the weekly review article was executed.
I. In-depth Analysis of Bitcoin's Hourly Timeframe Structure
Bitcoin _4-Hour K-line Chart
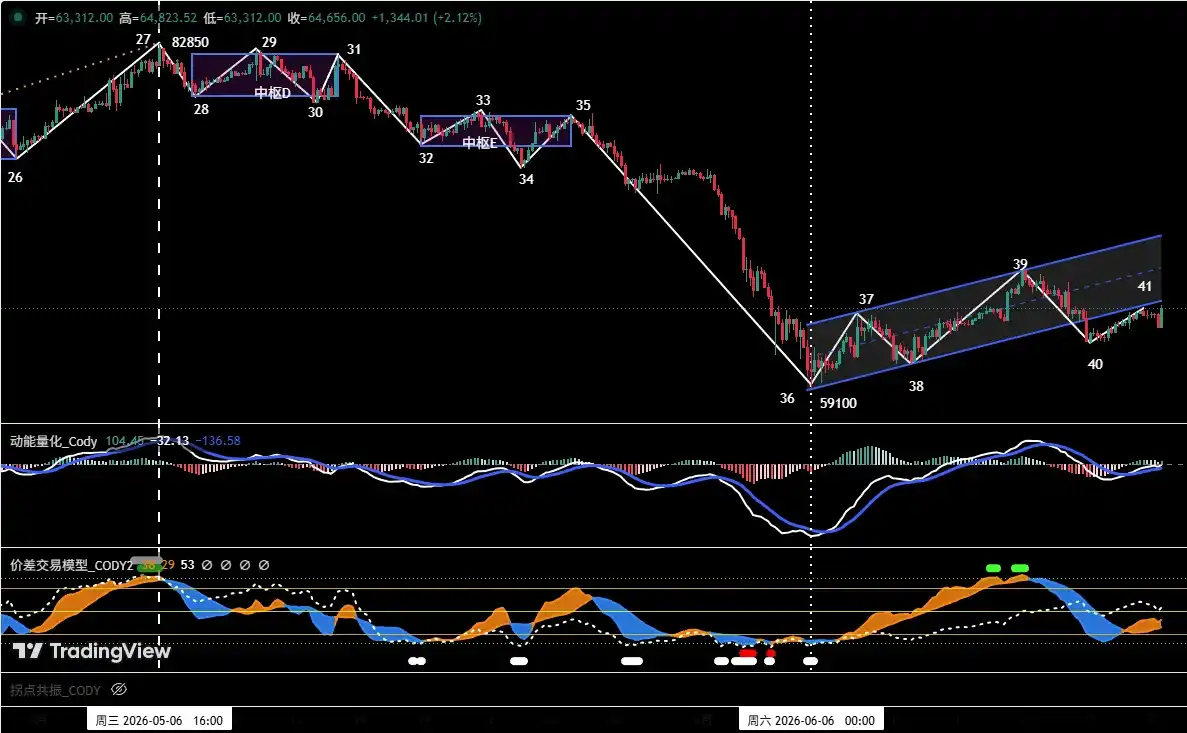
Figure 1
1 As shown in (Figure 1): From a 4-hour structural perspective, the price rebound initiated from the June 5th low of $59,100 can be subdivided into a five-wave structure, corresponding sequentially to segments 36-37, 37-38, 38-39, 39-40, and 40-41.
2 The overall trend presents a short-term rising channel pattern (blue channel in the chart): its upper bound is formed by connecting the two rebound highs at (point 37) and (point 39), while the lower bound is established by connecting the two correction lows at (point 36) and (point 38). The chart shows that the price has already breached the channel's lower bound at (point 40). The current (40-41) rebound segment can be viewed as a retracement confirmation phase for the breakdown below the channel's lower bound. If (point 41) fails to decisively reclaim a position above the channel's lower bound, the probability of the price revisiting the previous low support around $59,100 will significantly increase.
II. Bitcoin Weekly Outlook and Trading Strategies
1. BTC Weekly Market Outlook:
Core View for the Week: Focus on the outcome of the price's retracement confirmation of the short-term channel's lower bound.
- If it holds firmly above, the price may continue its rebound along the short-term rising channel, potentially challenging the core resistance zone of $69,500~$70,500.
- If it fails to hold, the market may retest the core support zone of $59,000~$60,000.
2. Core Resistance Levels:
- First Resistance Zone: $64,500~$65,000 area (near the short-term rising channel's lower bound)
- Second Resistance Zone: $69,500~$70,500 area (previous high-volume congestion zone)
3. Core Support Levels:
- First Support Level: $59,000~$60,000 area (previous significant support level)
- Second Support Level: Around $55,000 (previous significant support level)
4. Trading Strategies for This Week (Excluding Unexpected News Impact)
1 Medium-Term Strategy:
Bitcoin _ Daily K-line Chart (Position Monitoring Model)
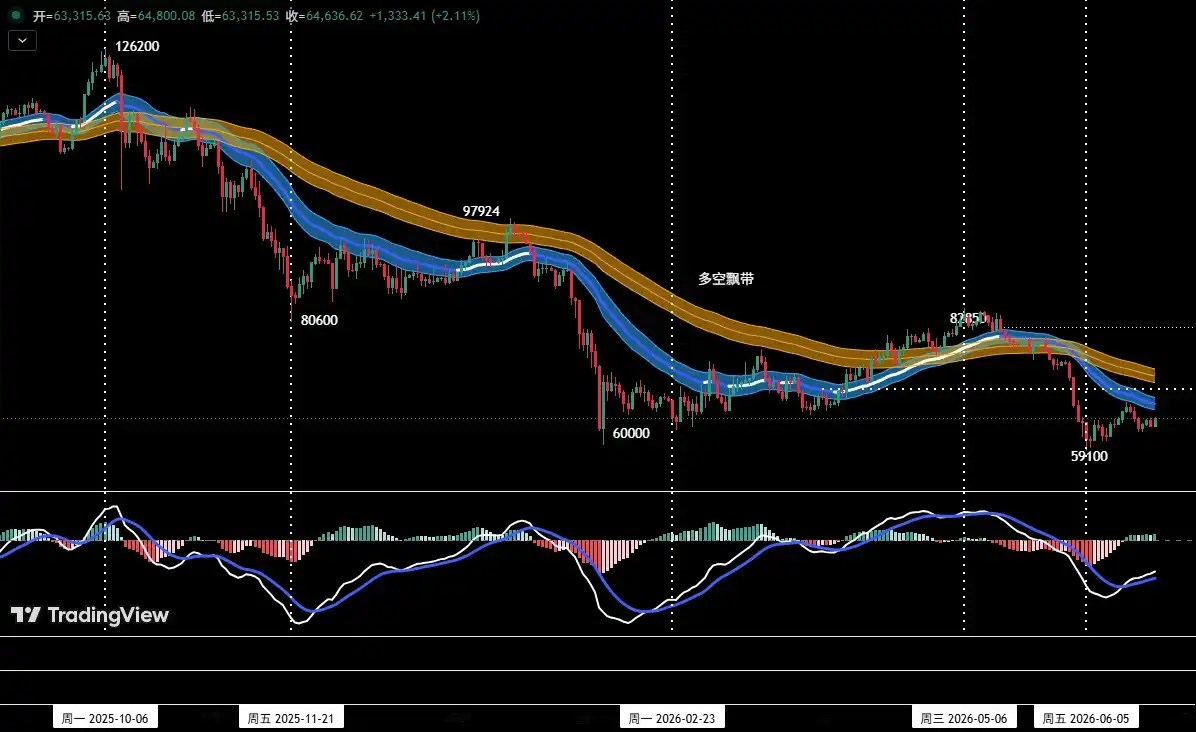
Figure 2
Position Monitoring Model: As shown in (Figure 2), the current price has decisively broken below the "Bull-Bear Channel," confirming a shift in market structure to a bear-dominated regime. Following the pre-set plan last week, we entered a short position around $64,500, with the initial medium-term position controlled at approximately 20% of total capital. Subsequent actions will adhere to stop-loss discipline, awaiting the next opportunity to add to the position.
2 Short-Term Strategy: Utilize 30% of capital, set stop-loss points, and seek "spread" trading opportunities based on support and resistance levels (using 30-minute/60-minute cycles).
3 To dynamically respond to the market's complex evolution in short-term operations, we have pre-formulated three specific contingency plans: A, B, and C.
Plan A: Tentative Positioning in Resistance Zone
- Entry: If the price rallies to the $64,500~$65,000 zone showing signs of exhaustion, combined with a quantitative model top signal, an initial short position of around 15% can be established.
- Risk Control: Set an initial stop-loss.
- Exit: When the correction approaches significant support levels and aligns with model signals, gradually close positions to take profits.
Plan B: Adding to Position in Strong Resistance Zone
- Addition: If the price breaks above the $65,000 resistance and continues to rally to the $69,500~$70,500 zone showing pressure signs, combined with a quantitative model top signal, increase the short position to within 30%.
- Risk Control: Set an initial stop-loss.
- Exit: When the correction approaches significant support levels and aligns with model signals, gradually close positions to take profits.
Plan C: Following the Break Below Support to Add Shorts
- Addition: If the price decisively breaks below the $65,000 support, continues its decline, and loses the $59,000~$60,000 support zone, consider adding to the short position (within 30%) when price shows weakness during a retracement confirmation.
- Risk Control: Set an initial stop-loss.
- Exit: When the decline reaches significant support levels and aligns with model signals, gradually close positions to take profits.
III. HYPE Hourly Timeframe Structure Analysis
HYPE_4-Hour K-line Chart
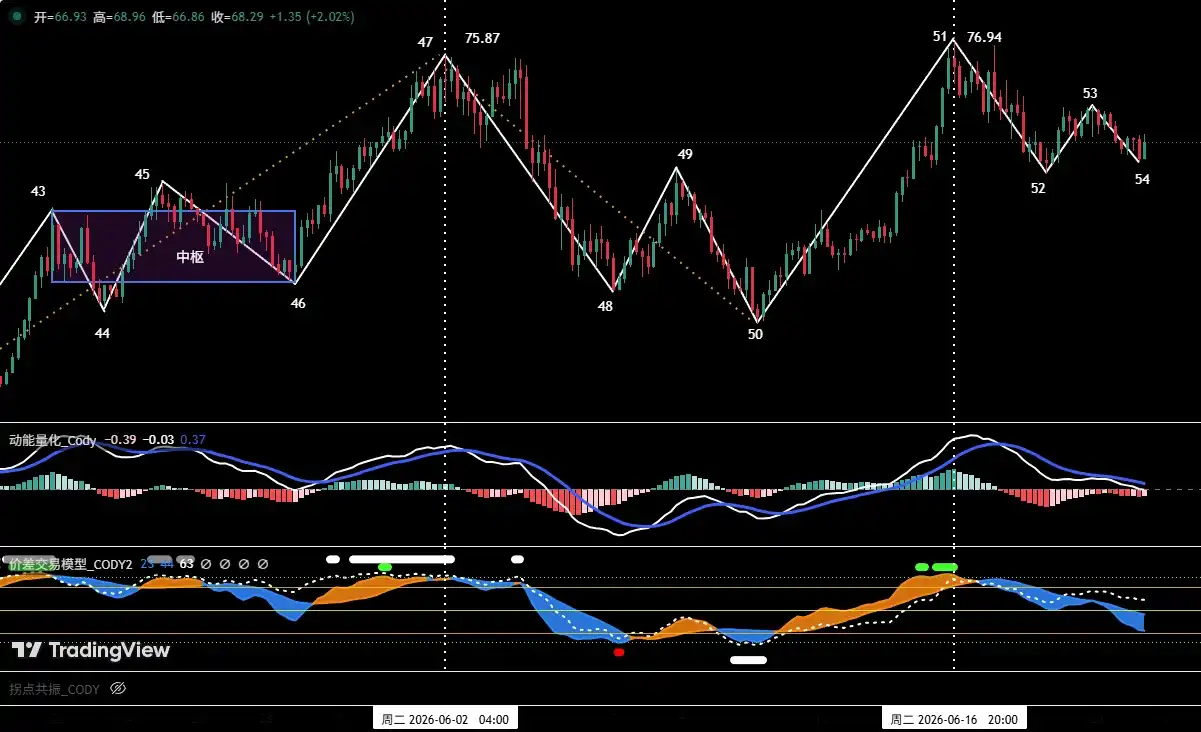
Figure 3
1 As shown in (Figure 3), on the 4-hour timeframe, HYPE initiated a correction from the June 2nd high of $75.87 (point 47), finding support near $52.62 (point 50) on June 10th, a correction lasting about 9 trading days. Subsequently, the market began a strong upward wave (segment 50-51), breaking the previous high within 6 trading days to reach a new high of $76.94 since the January rally, indicating that bullish momentum remains strong.
2 The decline from the new high presents a clear three-wave corrective structure (51-52, 52-53, 53-54). The price has currently retraced back to the critical support zone of $64~$66.
- Bullish Scenario: If the price finds effective support in this zone, the uptrend from (point 50) is likely to continue, with subsequent prices challenging new highs.
- Bearish Scenario: If this level is lost, the correction period will extend, and the price may retest the core support band of $52~$54, which marks the starting point of the previous uptrend.
IV. HYPE Weekly Outlook and Short-Term Trading Strategy
1. HYPE Weekly Market Outlook:
1 Core Resistance Levels:
- First Resistance Level: Around $77
- Second Resistance Zone: $80~$82 area
2 Core Support Levels:
- First Support Level: $64~$66 area
- Second Support Level: $52~$54 area
Core View for HYPE This Week:
- Observe the outcome of the battle between bulls and bears over the $64~$66 zone.
2. HYPE Short-Term Trading Strategy for This Week (Long on Support)
This week's short-term HYPE trading should adhere to the strategy of "buying the dip, avoiding chasing rallies."
Short-Term Strategy: Testing Longs on Support Zone Stabilization
When the HYPE price retests and finds support, showing signs of stabilization in the $64~$66 key support zone or the deeper $52~$54 zone, and this aligns with bottom signals triggered by the two models, consider a light long position trial. Position size must be controlled below 30%, and strict stop-loss discipline must be maintained.
V. Special Notes:
- Upon Entry: Immediately set the initial stop-loss.
- Upon Reaching 1% Profit: Move the stop-loss to the entry price (break-even point), ensuring capital safety.
- Upon Reaching 2% Profit: Move the stop-loss to the position of 1% profit.
- Continuous Tracking: Thereafter, for every additional 1% profit gained, move the stop-loss up by 1%, dynamically protecting and locking in profits.
Financial markets change rapidly. All market analysis and trading strategies require dynamic adjustment. All views, analytical models, and operational strategies mentioned in this article are derived from personal technical analysis, intended solely for personal trading log purposes, and do not constitute any investment advice or operational basis. Markets involve risk, investment requires caution. Please do not make decisions based solely on this content.



















