Bitcoin Price Forecast: Is Bitcoin's Resistance Band About to Break Through or Be Rejected for the Sixth Time?

cryptonews.ru發佈於 2026-07-27更新於 2026-07-27

文章摘要

Bitcoin is trading around $65,457, consolidating between a key bear market resistance line (rejecting price since February) and its cluster of EMAs around $64,475-$65,045. Key resistance is at the upper Bollinger Band at $66,578, with further resistance at the 100-day EMA ($67,717). Support lies at the EMAs and the lower Bollinger Band at $62,243. A potential bullish catalyst is Iran's signal for a ceasefire, which could reduce geopolitical risk. Analyst Benjamin Cowen draws parallels to 2018, warning of a potential rejection and August-September decline if the resistance isn't broken. Anthony Scaramucci remains long-term bullish, citing Bitcoin's advantages over gold. The outlook hinges on whether BTC can close above the $66,578 resistance or faces another rejection.

Bitcoin is trading at $65,457 on July 27, up 0.18%, following Iran signaling a willingness to halt hostilities, simultaneously putting pressure on the bearish market resistance band that has capped all upside attempts since February.

$BTC is squeezed between the bear market resistance band and its EMA cluster.
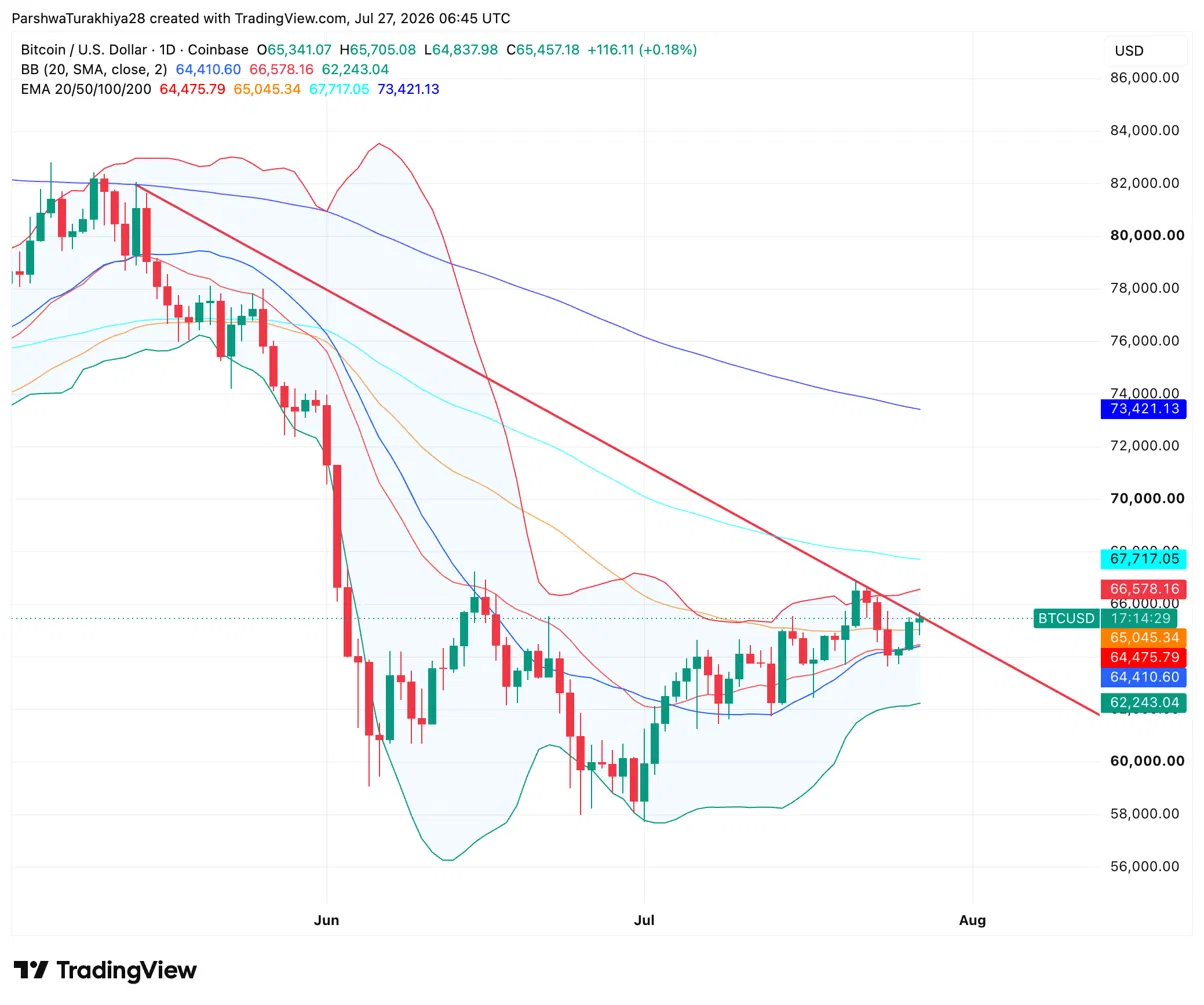
$BTC price chart 1D (Source: TradingView)

The daily chart shows $BTC consolidating between the 20-day EMA at $64,475 and the upper Bollinger Band at $66,578, with a descending red trendline from the May peak passing through the same zone. This trendline is Benjamin Cowen's bear market resistance band, and it has rejected the price on every approach since February. The 50-day EMA at $65,045 aligns almost exactly with the current price, making the EMA cluster an immediate support test.

Related: Cardano Price Forecast: Can ADA Break $0.20 Amid Ark Invest vs. Hoskinson Clash Over Its Significance?

The Bollinger Middle Line at $64,410 and the 20-day EMA at $64,475 form a narrow support zone just below. A close above the upper Bollinger Band at $66,578 and the descending trendline would be the first real signal of a breakout recovery. Above that, the next target is the 100-day EMA at $67,717, with the 200-day EMA at $73,421 as the long-term ceiling. The lower Bollinger Band at $62,243 defines the lower floor if support gives way.

What are the key support and resistance levels for $BTC today?

  • Support at $65,045 on the 50-day EMA and $64,475 on the 20-day EMA
  • Resistance at $66,578 on the upper Bollinger Band and the descending bear market resistance band
  • Extended resistance at $67,717 on the 100-day EMA
  • Key low at $62,243 on the lower Bollinger Band

Iran's ceasefire signal could be the needed macro-market unlock

Analyst Michaël van de Poppe reported on July 26 that Iran has indicated it will halt attacks provided the US suspends military operations.

Van de Poppe characterized this as a great sign for Bitcoin and crypto markets and called for a green week. Geopolitical tensions since June have been a persistent headwind for risk assets, with spikes in oil prices and uncertainty in the Strait of Hormuz repeatedly unsettling sentiment at key technical levels.

Benjamin Cowen sees a replay of 2018 with August declines

Cowen's latest video shows Bitcoin's 2026 structure relative to 2018: a February low, a high low in late March, the June low range in early July, and the current rally back to the bear market resistance band.

In 2018, this rally lasted until late July before giving back all gains in August and September. His base case is the same outcome: Q4 forms the market cycle bottom where on-chain indicators historically reset. His turnaround condition remains unchanged: if $BTC doesn't break out by year-end, he calls the bull market back on.

Anthony Scaramucci says $10 trillion is Bitcoin's next stop

Speaking on The Wolf of All Streets podcast, Scaramucci noted that Bitcoin's $1.2 trillion market cap is roughly the size of Micron Technology, arguing that a $10 trillion valuation still wouldn't be proportionate to global capital markets. He used gold's $28 trillion market cap as a benchmark, calling Bitcoin more scarce, more portable, and easier to move than the metal it increasingly competes with. He characterized the current environment as apathy, not a structural breakdown, drawing a parallel to Uber, where technologies that truly serve people eventually win, regardless of who tries to block them.

Related: Espresso Price Forecast: Bullish Momentum Builds as ESP Aims for $0.1208 Following 42% Weekly Rally

Regarding the clarity bill, Scaramucci flatly stated he does not see it passing, not out of pessimism but due to how Washington actually works. He argued Democrats have every incentive to block the bill simply to deny Trump a victory, irrespective of the bill's merits. He cited former SEC Chairman Paul Atkins as a steady hand but warned that without legislation, crypto regulation remains a pendulum swinging at the whim of those in power.

Bitcoin Price Forecast: Upside and downside targets

  • Upside case: Iran's ceasefire signal holds, $BTC closes above the upper Bollinger Band at $66,578 and the bear market resistance zone, the FOMC confirms a hold on rates on July 29, and van de Poppe's green week pushes towards the 100-day EMA at $67,717 amid a declining geopolitical risk premium.
  • Downside case: Cowen's 2018 analog plays out on the chart, $BTC is rejected at the bear market resistance zone, the 50-day EMA at $65,045 fails to hold support, and price drops towards the Bollinger Middle Line at $64,410 and the 20-day EMA at $64,475 as August seasonal weakness sets in.
end-content

熱門幣種推薦

相關問答

QWhat are the key support and resistance levels for Bitcoin mentioned in the article, based on the daily chart?

AKey support levels are at the 50-day EMA of $65,045 and the 20-day EMA of $64,475. Key resistance is at the upper Bollinger Band and the bear market resistance band around $66,578. Extended resistance is at the 100-day EMA of $67,717. The key floor is the lower Bollinger Band at $62,243.

QWhat geopolitical event does the article suggest could act as a positive catalyst for Bitcoin's price?

AThe article suggests that Iran signaling a readiness to suspend attacks, conditional on the US halting military operations, could be a positive macro catalyst for Bitcoin and crypto markets, potentially reducing geopolitical risk premiums.

QAccording to Benjamin Cowen's analysis, what historical pattern is Bitcoin's 2026 structure mirroring, and what is his base case outcome?

ABenjamin Cowen's analysis shows Bitcoin's 2026 structure mirroring 2018: a February low, a high low in late March, June lows retested in early July, and a rally back to the bear market resistance band. His base case is a similar outcome where the rally lasts until late July, followed by a pullback in August and September, with Q4 forming the market cycle bottom.

QWhat is Anthony Scaramucci's long-term outlook for Bitcoin's market capitalization, and what asset does he use as a benchmark?

AAnthony Scaramucci's long-term outlook is that Bitcoin's market cap could reach $10 trillion. He uses gold's market cap of $28 trillion as a benchmark, arguing Bitcoin is scarcer, more portable, and easier to move than the precious metal it increasingly competes with.

QWhat are the article's outlined 'Upside Case' and 'Downside Case' scenarios for Bitcoin's price movement?

AUpside Case: The Iran ceasefire signal holds, BTC closes above the $66,578 resistance (upper Bollinger Band & bear market band), the Fed holds rates on July 29, and a 'green week' propels price toward the 100-day EMA at $67,717. Downside Case: Cowen's 2018 analog plays out, BTC is rejected at the bear market band, support at the 50-day EMA ($65,045) fails, and price descends toward the $64,410-64,475 support zone (Bollinger midline & 20-day EMA) amid August seasonal weakness.

你可能也喜歡

彼得·希夫声称Strategy公司的STRC计划损害了MSTR股东的利益

Strategy公司(MSTR)发布二季度财报后,其股价在7月31日面临更大抛压。知名比特币批评者彼得·希夫随后指责公司宣称的核心企业目标——维持其优先股STRC价格接近100美元声明价值——损害了MSTR普通股股东的利益。希夫认为,该政策在优先股投资者和普通股股东之间造成了直接冲突,意味着公司并非以股东价值最大化为首要目标。 Strategy则解释,维持STRC价格稳定是其数字信贷资本更广泛战略的一部分,旨在稳定公司资本结构。STRC是一种永久优先股,目前提供每年12%的现金股息,且股息率每月调整,以激励其交易价格接近100美元面值,降低价格波动。该结构为公司收购比特币提供了额外融资渠道,但要求管理层平衡股息义务、流动性储备、优先股定价和普通股动态。 公司管理层已扩充美元储备至约37.5亿美元,用以覆盖约2.1年的优先股股息和利息支出,并回购了部分STRC。这些行动显示出公司意图强化优先股结构,同时保持财务灵活性。 市场观点出现分歧。希夫持续警告,Strategy对优先证券和资本募集的使用可能导致普通股股东权益被稀释。而其他机构如Grayscale Research则认为,公司近期出售部分比特币降低了融资风险,STRC价格的复苏也反映了市场对其资本结构的信心增强。未来考验在于公司如何平衡比特币增持、优先股股息支付、可能的股票回购以及普通股面临的市场压力。

cryptonews.ru44 分鐘前

彼得·希夫声称Strategy公司的STRC计划损害了MSTR股东的利益

cryptonews.ru44 分鐘前

交易

現貨

熱門文章

如何購買BAND

歡迎來到HTX.com!在這裡,購買Band Protocol (BAND)變得簡單而便捷。跟隨我們的逐步指南,放心開始您的加密貨幣之旅。第一步:創建您的HTX帳戶使用您的 Email、手機號碼在HTX註冊一個免費帳戶。體驗無憂的註冊過程並解鎖所有平台功能。立即註冊第二步:前往買幣頁面,選擇您的支付方式信用卡/金融卡購買:使用您的Visa或Mastercard即時購買Band Protocol (BAND)。餘額購買:使用您HTX帳戶餘額中的資金進行無縫交易。第三方購買:探索諸如Google Pay或Apple Pay等流行支付方式以增加便利性。C2C購買:在HTX平台上直接與其他用戶交易。HTX 場外交易 (OTC) 購買:為大量交易者提供個性化服務和競爭性匯率。第三步:存儲您的Band Protocol (BAND)購買Band Protocol (BAND)後,將其存儲在您的HTX帳戶中。您也可以透過區塊鏈轉帳將其發送到其他地址或者用於交易其他加密貨幣。第四步:交易Band Protocol (BAND)在HTX的現貨市場輕鬆交易Band Protocol (BAND)。前往您的帳戶,選擇交易對,執行交易,並即時監控。HTX為初學者和經驗豐富的交易者提供了友好的用戶體驗。

431 人學過發佈於 2024.12.12更新於 2026.06.02

如何購買BAND

相關討論

歡迎來到 HTX 社群。在這裡,您可以了解最新的平台發展動態並獲得專業的市場意見。 以下是用戶對 BAND (BAND)幣價的意見。

活动图片