Author: Tanay Ved, Coin Metrics
Compiled by: Luffy, Foresight News
TL;DR:
- Bitcoin gave back all of its April gains, falling approximately 11% in Q2 against a backdrop of shifting interest rate expectations, ETF outflows, and capital rotation into AI stocks.
- Three major liquidity channels—ETFs, Treasury companies like Strategy, and stablecoins—all weakened in Q2, with spot Bitcoin ETFs alone seeing net outflows of $4.08 billion.
- Total long liquidations for BTC and ETH reached $8.35 billion, leading to significant deleveraging in Q2, but the market entered Q3 in a more stable condition.
Market Overview
The crypto market entered Q2 2026 with strong momentum. After a difficult Q1, Bitcoin rebounded alongside equities in April, as geopolitical tensions eased briefly and institutional demand improved, climbing to around $82,000. However, this recovery did not last.
This reversal was driven by three forces: Brent crude prices hitting a high of $126.41 amid volatility from geopolitical negotiations, a hawkish shift in the Federal Reserve's interest rate outlook, and capital rotation into the AI trade.
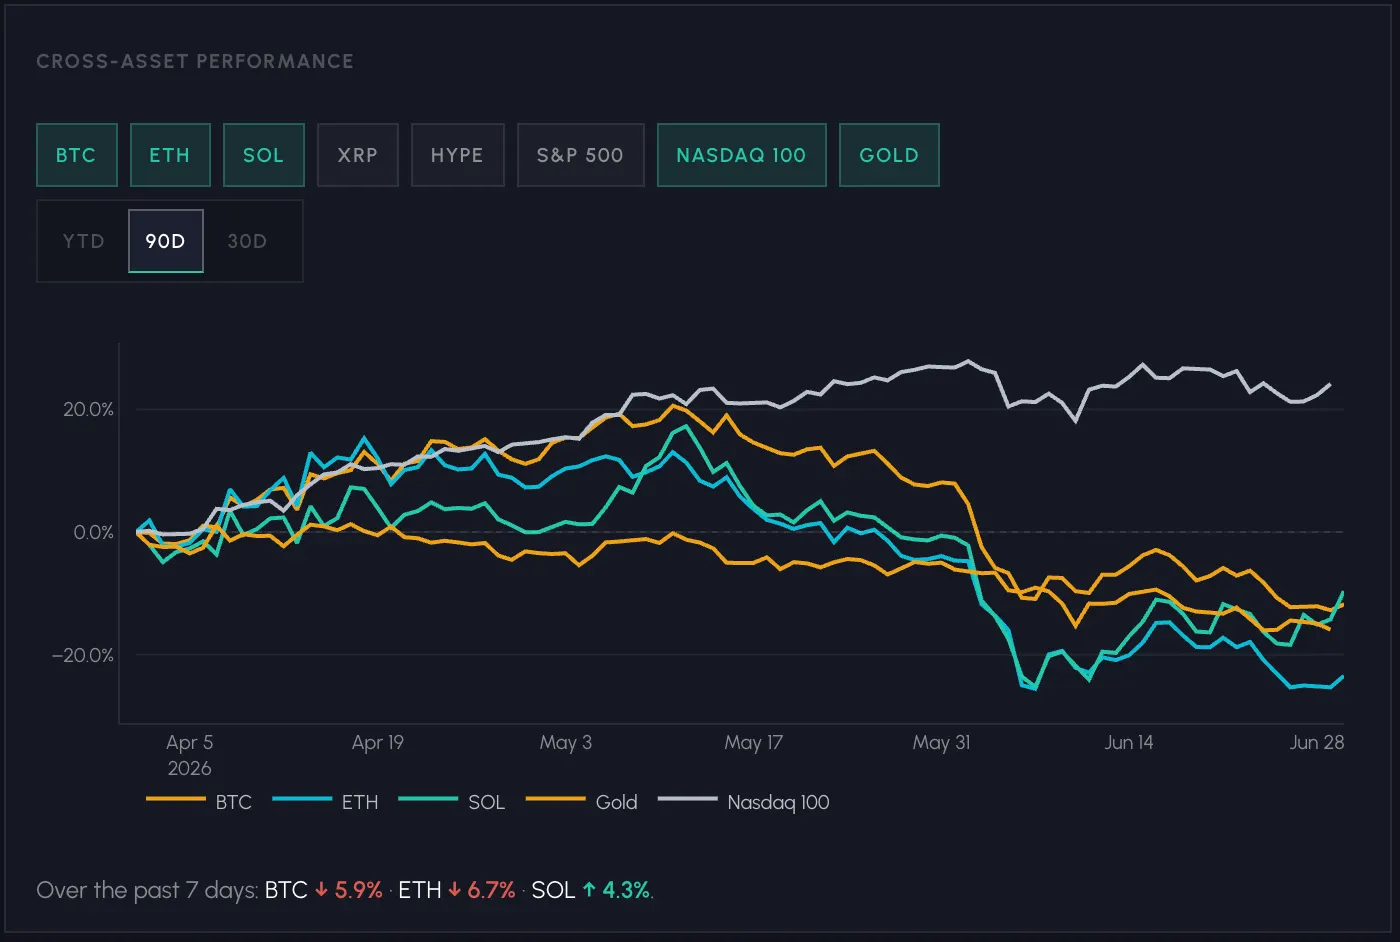
Until mid-May, cryptocurrencies and equities largely moved in sync, with both BTC and ETH rising about 20% from their early-April lows. The divergence came in late May when cryptocurrencies pulled back while equities held firm. Ultimately, the S&P 500 and Nasdaq 100 rose approximately 16% and 28% for the quarter, respectively, while BTC fell about 10%, ETH about 20%, and SOL about 13%.
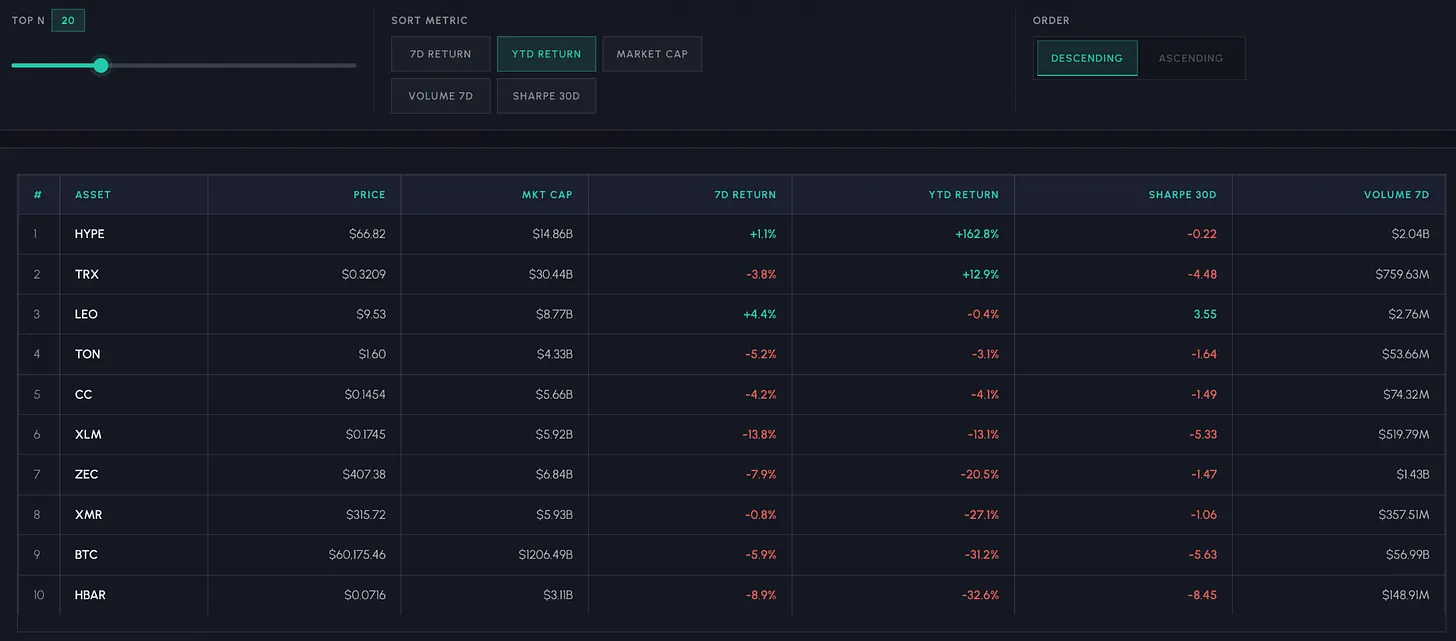
Bitcoin is currently trading around $60,000, down about 52% from its all-time high of $126,000 set in late 2025. Altcoin performance has been similar, with few gainers. Year-to-date, among the top 20 crypto assets by market cap, Hyperliquid (HYPE) remains the sole bright spot (up 142%), driven by strong demand for its on-chain trading of perpetual contracts for stocks and commodities.
Fund Flows
The weakness in Q2 was exacerbated by the deterioration of three key demand channels: spot ETFs, crypto asset treasuries like Strategy, and stablecoin supply.
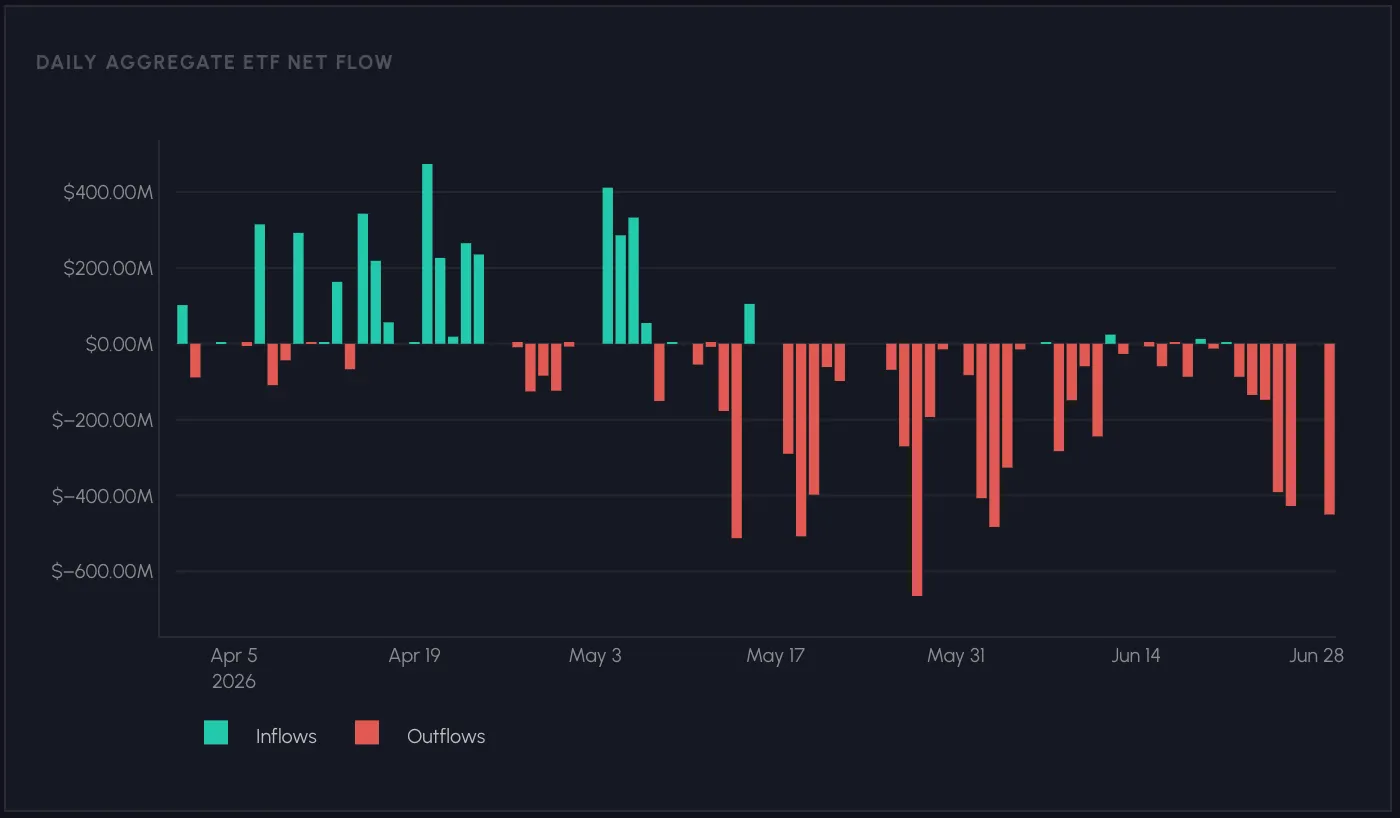
Spot Bitcoin ETFs: April started strong for spot Bitcoin ETFs, dominated by inflows. The peak single-day inflow of $474 million occurred on April 20th, after which flows reversed. Outflows dominated for the rest of the quarter, with 53 days of outflows compared to 30 days of inflows in Q2. June was the primary culprit, with net outflows reaching $3.84 billion for the month among tracked ETF issuers, accounting for the majority of the quarter's total net outflow of $4.08 billion.
Crypto Asset Treasuries (Strategy Companies): This quarter, Bitcoin accumulation by Strategy companies slowed significantly. Their preferred shares (STRC), designed to stabilize around $100, fell to a historic low of $74, while Strategy's market-to-net-asset-value ratio (mNAV) compressed close to 1.0, impacting the funding channels behind their accumulation. A surprise sale of 32 BTC in early June unsettled the market and broke the "never sell" sentiment. In response, Strategy established a new Digital Credit Capital framework, raising STRC dividends to 12%, authorizing the sale of up to $1.25 billion worth of BTC, and setting up a $2.55 billion USD reserve to cover approximately 17 months of debt.
Stablecoins: The total stablecoin market cap contracted by approximately $4.2 billion in Q2, reducing the funds underpinning on-chain activity and liquidity. USDT saw a modest increase of $1.8 billion, while USDC decreased by $3.4 billion. Ethena's USDe fell by $1.4 billion as risk-off sentiment dampened interest in yield-bearing stablecoin strategies.
With the three major demand channels weakening simultaneously, the liquidity environment heading into Q3 is markedly tighter than at the start of Q2. Whether this demand will return to crypto assets or continue flowing into AI stocks remains a dynamic to watch.
Exchange Activity & Derivatives
Total spot trading volume on exchanges fell 28% quarter-over-quarter to $2.32 trillion, continuing a downtrend that began in January. Futures volume fared slightly better at $12.32 trillion, down 11.6% QoQ, but the spot/futures ratio compressed from 0.23x to 0.19x, indicating an increase in derivative positioning rather than spot demand.
Hyperliquid stood out, with its futures trading volume market share growing to around 4.5%, as on-chain perpetuals continued to take market share from centralized exchanges.
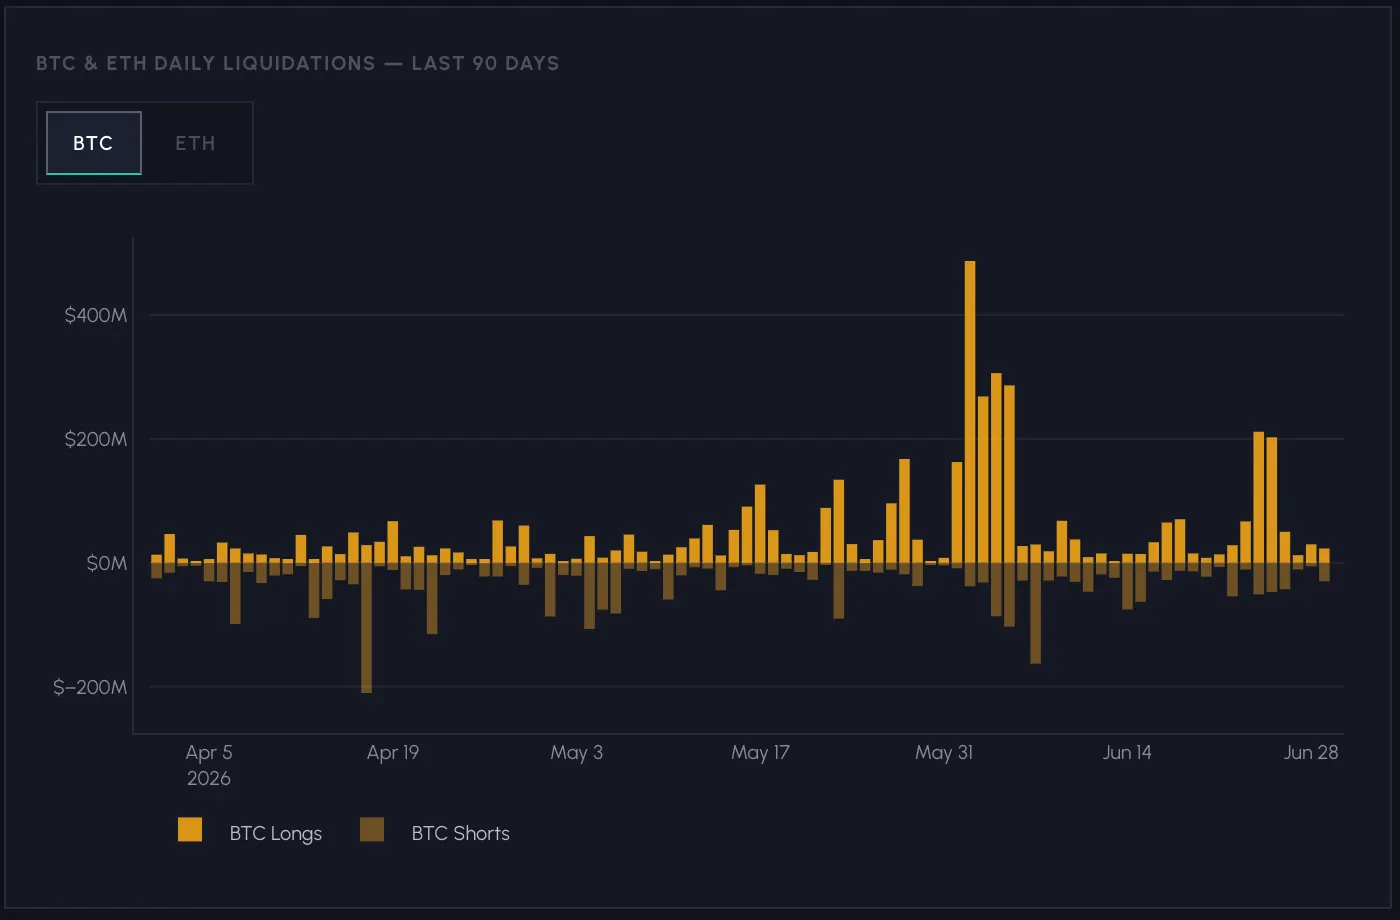
Open interest peaked before the May sell-off, reaching $49.2 billion for BTC and $27.2 billion for ETH. Currently, these figures have dropped to $33.5 billion (BTC) and $16.2 billion (ETH), down 32% and 40% from their peaks, respectively. Throughout Q2, total long liquidations for BTC and ETH reached $8.35 billion. More than half of these liquidations occurred between May 25th and June 7th, as over-leveraged long positions were wiped out. The market entered Q3 in a more deleveraged state.
Funding rates were volatile during Q2, swinging from deeply negative (annualized -16%) in mid-April to strongly positive (annualized +10%) in May as long positions increased. The subsequent sell-off pulled rates back to neutral levels, fluctuating around zero at quarter-end, reflecting cautious sentiment.
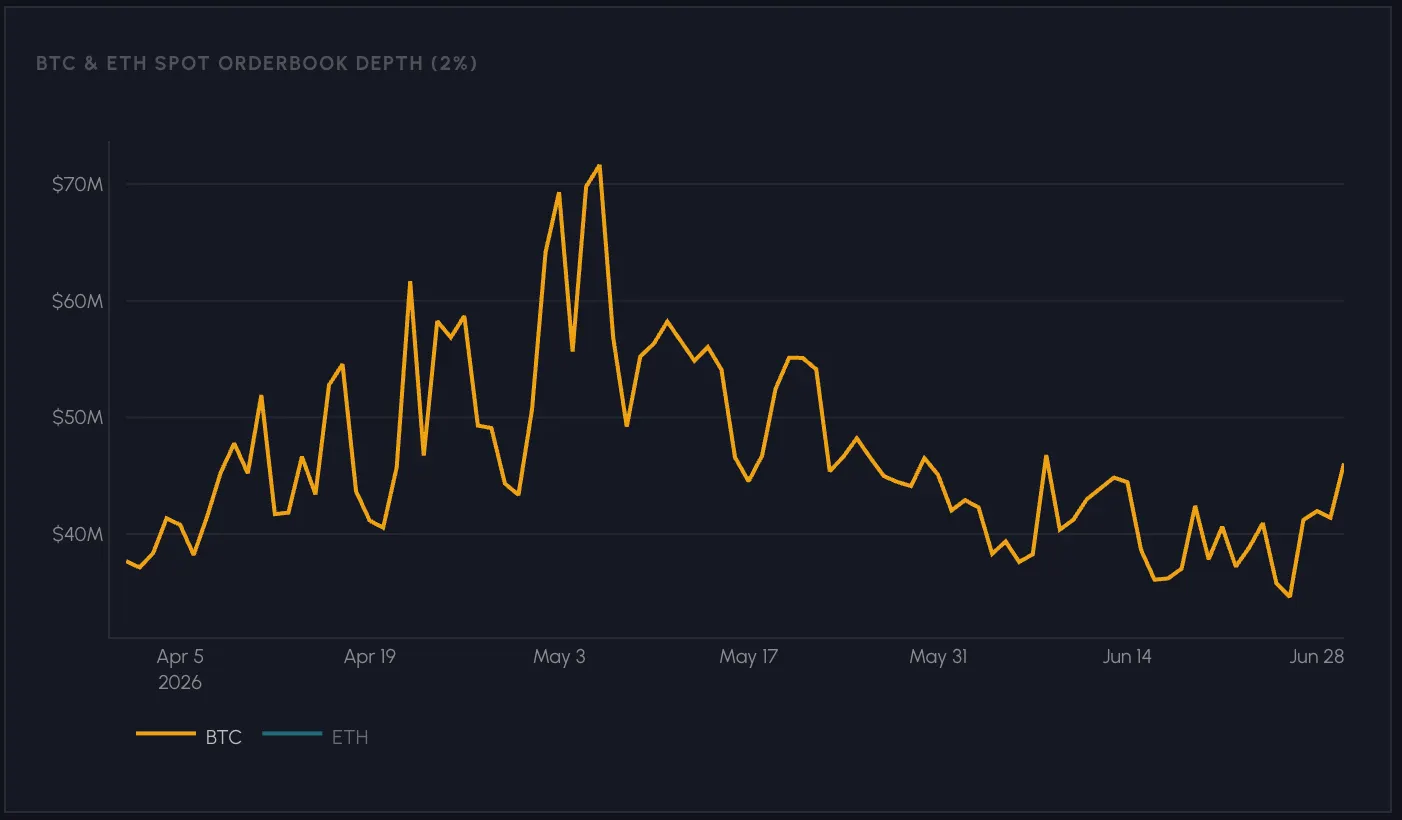
Liquidity also deteriorated in sync. The 2% order book depth for Bitcoin fell from a peak of around $70 million in early May to about $35-40 million by late June, indicating reduced market liquidity and a diminished ability to absorb selling pressure.
Key Themes to Watch Going Forward
Beyond Q2's price action, several structural developments point to the market's future direction, from new asset classes emerging on-chain to the infrastructure supporting them.
- Tokenized Stocks: Coinbase announced the launch of 1:1 pegged, fully legally entitled tokenized stocks.
- The Rise of RWA Perpetuals: On-chain trading and price discovery have moved beyond crypto, extending to stocks, indices, and commodities via Hyperliquid HIP-3 perpetuals and centralized exchanges offering 24/7 RWA perpetuals.
- SpaceX IPO Priced On-Chain: The $1.7 trillion SpaceX IPO was priced on crypto rails ahead of its public listing, providing early price discovery signals for private companies.
- Vaults & Lending Markets: On-chain vaults are becoming a core allocation layer for institutional capital, pooling deposits into curated lending strategies on protocols like Morpho and Aave. Infrastructure is maturing rapidly as traditional asset managers like Bitwise enter the vault management space.