Author: Claude, Deep Tide TechFlow
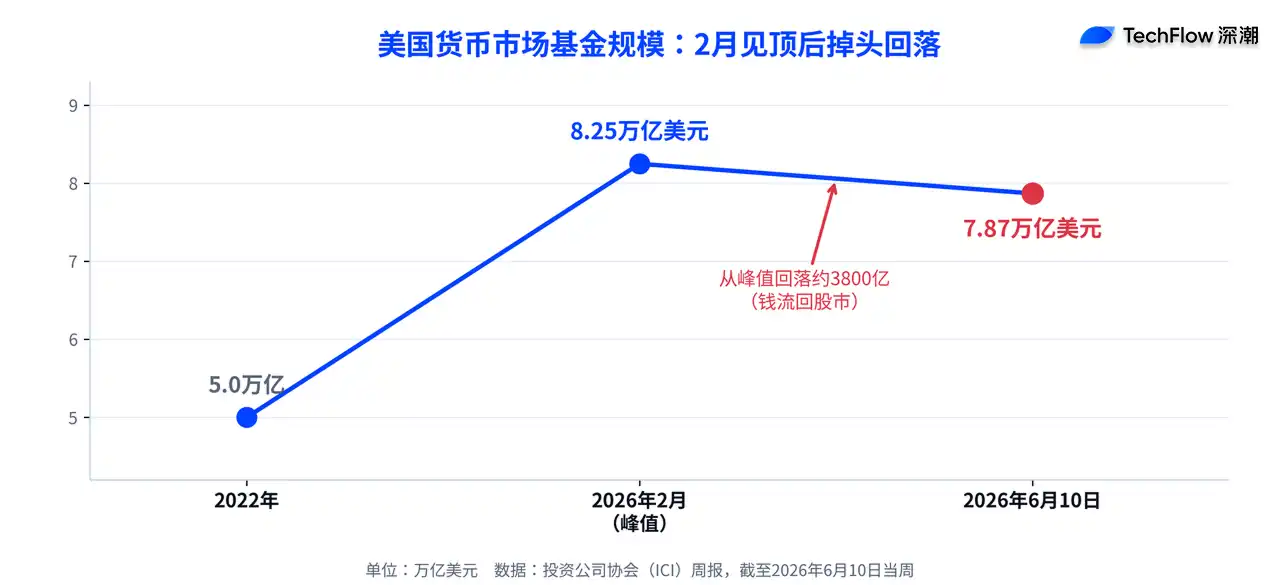
Deep Tide Introduction: In February of this year, US money market funds surged to a historical peak of about $8.25 trillion. Buffett left behind $381.7 billion in cash before retirement, and rumors swirled that the super-rich were fleeing the stock market.
But now in June, the plot has reversed: the S&P 500 repeatedly hits new highs, breaching the 7600-point level for the first time on June 2nd, while money market fund assets have fallen back to $7.87 trillion as of June 10th. Money is flowing from cash back into stocks. The safe-haven bet placed by the wealthiest group is now being proven wrong by the market.
The Story in February: Cash in the Hands of the Rich Piled Up to a Record High
Let's rewind to the beginning of the year.
According to a Goldman Sachs survey from October 2025, high-net-worth individuals with over $1 million in investable assets held, on average, about 20% of their net worth in cash and cash equivalents—a proportion considered high for traditional allocation.
The most symbolic figure was Buffett.
As reported by Bloomberg, before his retirement on December 31, 2025, the former CEO of Berkshire Hathaway had built the company's cash reserves to approximately $381.7 billion as of the end of the third quarter of 2025. This cash pile even ended up making money—despite market turmoil, Buffett's personal net worth still grew by about $21 billion last year.
He wasn't the only one reducing holdings. According to Reuters' disclosures of holdings documents, PayPal co-founder Peter Thiel, through his hedge fund Thiel Macro, sold about $100 million worth of Nvidia stock in Q3 2025. Nvidia rose nearly 35% in 2025; Thiel exiting at a high point added fuel to concerns about an "AI bubble."
The market direction was the same. According to data from the Investment Company Institute (ICI), US money market fund assets surged to a historical peak of about $8.25 trillion at the end of February this year, a 65% increase from about $5 trillion in 2022. The narrative back then was clear: smart money was hiding in cash.
The June Reversal: Money is Flowing from Cash Back into Stocks
The problem is, it's June now, and the story has flipped.
According to official ICI data, as of the week ending June 10th, money market fund assets dropped to $7.87 trillion, with a single-week outflow of $21.48 billion; the previous week, June 4th, it was $7.89 trillion. From the February peak of $8.25 trillion, assets have shrunk by about $380 billion. Money is flowing *out* of cash, not in.
Where is it going? Stocks. According to CNBC, the S&P 500 closed at 7609.78 points on June 2nd, breaking above the 7600-point level for the first time in history, marking its ninth consecutive day of gains; the Nasdaq also hit new highs. Nvidia surged over 6% in a single day after releasing its new generation of PC chips, boosting Dell and HP. In short, the money that hid in cash back in February is now watching the market hit new highs without them.
There was an early signal behind this. According to investingLive reports, Bank of America (BofA) warned as early as late May that as the market surged to new highs and bullish sentiment peaked, cash levels were actually declining. The $8.25 trillion record was old news from February; by June, the market landscape was a different story.
The Cost of Hoarding Cash: Lagging Stocks by More Than Double
Why is the wealthy's safe-haven move being proven wrong? Look at the return gap.
According to calculations by The Motley Fool, if one had held from the point before the 2022 bear market when cash was flowing into money market funds all the way to the present, the total return for the S&P 500 would be about 42%, while the Vanguard Federal Money Market Fund returned only 18% over the same period—a gap of more than double. Hiding in cash seems safe, but the cost is missing a big chunk of the rally.
This is also why many analysts remain skeptical of the "pile into cash at the first sign of trouble" approach:
Historically, events like geopolitical conflicts are often short-term and can instead be buying opportunities at low points, not reasons to sell out.
Those Who Moved Money Out of Stocks Went into Real Estate and Art
The money freed up by those who did reduce stock holdings hasn't been idle. The Goldman Sachs survey shows that among those with $1 million to $5 million in investable assets, nearly 40% hold alternative investments; among those with over $10 million, this proportion reaches 80%. The greater the assets, the more they move beyond traditional stocks.
Art is one destination. According to UBS's 2025 Art Market Report, high-net-worth collectors allocated an average of about 20% of their wealth to art in 2025. Real estate, private credit, and hedge funds are also absorbing funds flowing out of the stock market. The logic is that in an environment of sticky inflation, high interest rates, and uncertain tariff prospects, these asset classes resemble safer harbors. But even safe harbors have a cost, as the earlier set of return numbers demonstrates.
Major Banks Are Still Doubling Down: Goldman Sachs, Morgan Stanley Raise Price Targets
If the wealthy's moves in February leaned defensive, Wall Street banks' stance in June is the opposite.
According to Bloomberg, Goldman Sachs' strategy team (led by Ben Snider) raised its year-end target for the S&P 500 from 7600 points to 8000 points in late May, citing AI-driven earnings growth. Goldman increased its 2026 S&P 500 earnings-per-share forecast to $340, representing a 24% year-on-year growth, and believes AI infrastructure beneficiaries will contribute about half of this year's index earnings growth. However, Goldman also cautioned: "AI sentiment and interest rates present risks in both directions."
Morgan Stanley is even more bullish. Chief Investment Officer for Wealth Management Lisa Shalett, in an outlook on May 20th, set a one-year target of 8300 points for the S&P 500, implying about 11% to 12% upside. But she also listed five risks: gains excessively concentrated in a few large-cap AI stocks, deteriorating US consumer finances, corporate profits reliant on price hikes rather than productivity, pressure on long-term interest rates, and better performance outside the US (Japan and some emerging markets). Shalett's core judgment is that the market's surface is stronger than the underlying economy.