Author: Jialiu, Zhangsheng Beatz
In Tianjin, there have been days of sudden downpours, with sunny skies before leaving the house, only to be soaked through halfway. A friend's flight to Shenzhen was canceled due to a typhoon, and all high-speed train tickets to Zhejiang were suspended.
Checking the news on my phone, Fushun in Liaoning had over 329 mm of rainfall in a few hours. Residents in Fangchenggang, Guangxi, said it was the worst flood in 20 years, with seven national-level meteorological stations breaking historical single-day precipitation records. North China issued its largest-scale high-temperature warning, with ground temperatures in some areas approaching 50°C. In the first week of July, two to three typhoons queued up to form in the Western Pacific, with super typhoon 'Bavi' approaching the southeastern coast.
After the summer began in 2026, China's weather has clearly become more unsettled.
And it's not just us. Off the coast of Peru, seawater continues to be abnormally warm, restricting anchovy catches, with fishmeal prices rising about 80% over the past year. As Southeast Asia enters the dry season, drought signals are strengthening, causing tension in Malaysia and Indonesia's palm oil regions. The Indian monsoon rains haven't yet reached the critical window, but the market is already betting they will be weak. Analysts have noted that Australia's wheat planting area may shrink significantly.
These extreme weather events are scattered across different continents, seemingly unrelated. But in fact, apart from direct triggers like monsoon moisture, tropical storm outer circulations, location, and topography, they are all likely influenced by the same storm:
ENSO, El Niño.
El Niño: The Pacific Is Running a Fever
ENSO, which translates to El Niño-Southern Oscillation, is the largest interannual signal in Earth's climate system. Simply put, it describes periodic changes in Pacific sea surface temperatures and atmospheric circulation.
Normally, the eastern equatorial Pacific is relatively cool and the western part is relatively warm, with trade winds pushing warm water toward the western Pacific. But if the trade winds weaken, warm water flows back eastward, causing abnormally high sea temperatures in the central and eastern Pacific—this is El Niño.
Meteorological agencies determine whether an El Niño is occurring by looking at a key region: the Niño3.4 zone (a crucial area of the central equatorial Pacific, which can be understood as the 'thermometer' for gauging El Niño's strength). If this region's temperature is 0.5°C above the normal average for several consecutive months, it is considered an El Niño state; if it's 2°C or more above, it's classified as a super El Niño. 1997 and 2015 were two classic super El Niño events.
This year's El Niño could become one of the strongest since 1950.
On June 11, the U.S. National Oceanic and Atmospheric Administration officially issued an El Niño advisory, confirming that El Niño conditions are present and expected to strengthen through late 2026 to early 2027. They estimate a 63% probability of a super El Niño occurring from November of this year to January next year. The Chinese Academy of Sciences' Institute of Atmospheric Physics is slightly more conservative, forecasting over a 70% chance of a moderate event and about a 10% chance of a super one.
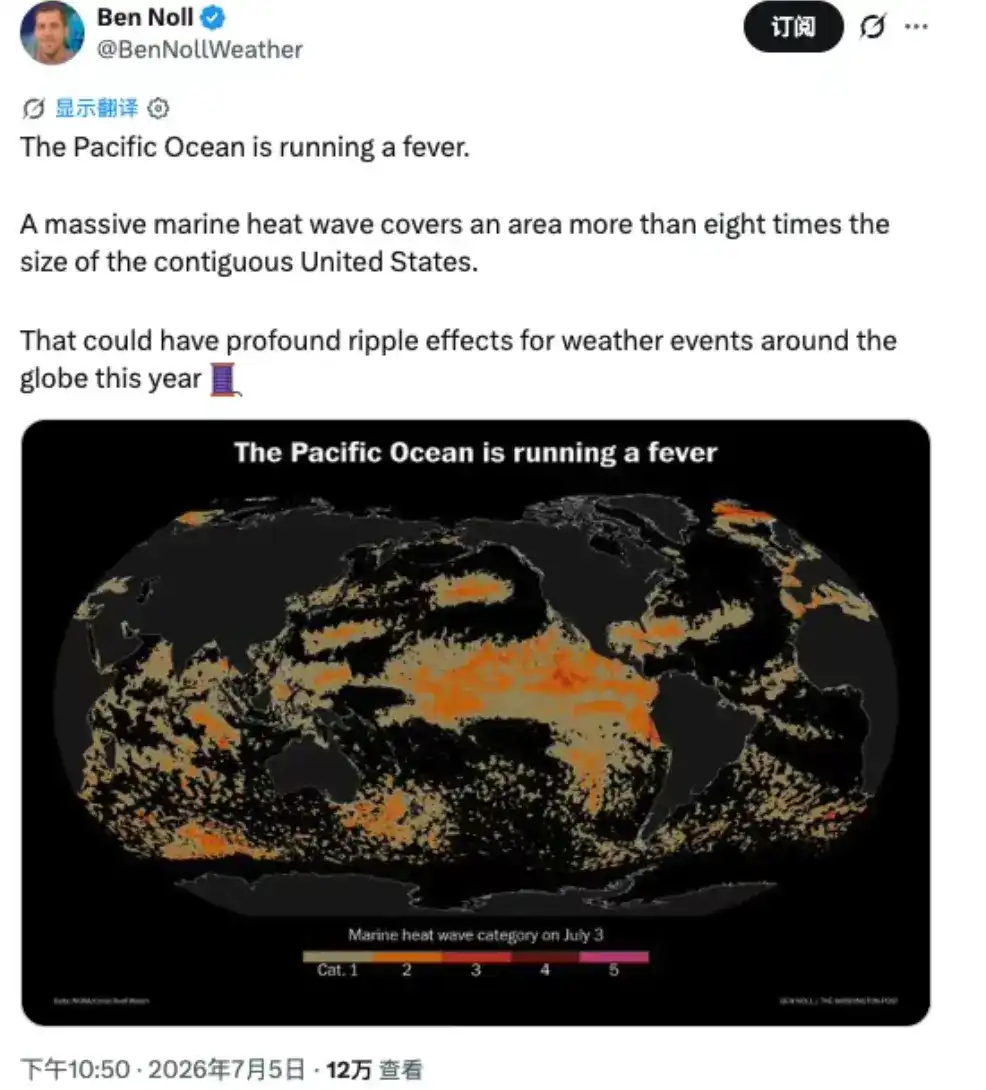
Meteorologist Ben Noll posted a Pacific sea temperature map on X titled 'Pacific is running a fever.' The map is covered in dark orange and red across a vast expanse of the Pacific, showing this marine heatwave covers an area over eight times the size of the contiguous United States.
For us, its impact is not 'directly causing a specific rainstorm' but altering the backdrop of atmospheric circulation. It affects the position of the Western Pacific Subtropical High, changes the path of the East Asian summer monsoon transporting moisture, making rain belts more prone to deviate from their usual locations, and raising the risks of heatwaves, droughts, and severe convection.
Compounded by global warming, for every 1°C increase in atmospheric temperature, its capacity to hold water vapor increases by about 7%. So today's El Niño is not occurring within a normal climate but against a background that is already hotter, wetter, and more prone to extremes.
On one side are monsoons and typhoons, but on the other side, financial markets have already caught a whiff, with funds stirring.
On June 24, Bloomberg reported that hedge fund Moreton Capital Partners was raising $500 million for a special-purpose vehicle. The targets are agricultural commodities like South African corn, Malaysian palm oil, and Australian wheat that are susceptible to El Niño. Co-founder Les Finemore gave only one reason: the market is vastly underestimating the risks brought by this year's El Niño.
Weather is no longer background noise in commodity portfolios; to some extent, it can be a standalone theme for fundraising.
How can Finemore raise $500 million? Because making money from extreme weather like El Niño is not theoretical; people have made fortunes from it for decades.
The Founding Father of 'Turtle Trading' and His First Pot of Gold
In 1972, anchovies suddenly disappeared off the coast of Peru.
This small fish, about a dozen centimeters long, is something most people in the world will never eat, but when ground into fishmeal, it is one of the most important protein sources in global animal feed.
The reason for the anchovies' disappearance was the sudden warming of equatorial Pacific waters; cold upwelling ceased, breaking the plankton chain. Meteorologists later named this phenomenon: El Niño.
With no fishmeal, feed suppliers had to find substitutes, soybean meal prices were forced up, and soybean prices followed.
At the Chicago Board of Trade, a young trader not yet 26, Richard Dennis, saw prices hitting new highs and kept buying soybeans. In 1974, he made about $500,000 on soybeans and became a millionaire by the end of the year.

Richard Dennis in his youth
This young trader, Richard Dennis, who earned his first pot of gold, later became the famous founder of the 'Turtle Traders.' His name is one of the founding fathers of the trend-following trading school.
Another classic story is about Anthony Ward, nicknamed Chocfinger. He founded Armajaro in London in 1998, specializing in cocoa and coffee. What made this company special was not its trading desk but its meteorology department: a self-built weather station network, hiring full-time meteorologists, and deploying a team of over 20 researchers in West African origins.
His logic was that slight weather changes could cause crop yields to fluctuate by 10%; whoever knows the weather first knows the price. In 2002, he took three-quarters of the cocoa deliveries on the London exchange for that month, making a pre-tax profit of £10.4 million. On July 17, 2010, he received 240,100 tons of cocoa in one go, worth £658 million, 7% of global annual production, basically all visible European inventory at the time. Cocoa prices were pushed to their highest since 1977.
Let's look at some more recent examples.
In 2024, cocoa was the wildest commodity globally. West Africa's Ivory Coast and Ghana, which produce 70% of the world's cocoa, experienced abnormal heat and dry Harmattan winds (a hot, dry wind from the Sahara blowing toward the West African coast). Cocoa pods rotted on a large scale, compounded by disease, old trees, and low inventories. Cocoa futures rose over 400% in two years, once breaking $10,000 per ton.
Those who reaped the biggest gains weren't just people in the cocoa industry but a group of quantitative trend funds. Razvan Remsing of Aspect Capital said it was their best first quarter in 25 years. AQR's managed futures strategy rose about 17.4% in Q1. Capital Fund Management's trend fund rose about 17.5%. Aspect's flagship fund rose 21.4% by late April. Winton, founded by David Harding, saw its diversified macro fund rise about 13% in Q1.
During the same period, besides making good money on cocoa, Winton also made a killing in another direction: El Niño typically leads to warmer winters in parts of the US. With less cold weather, demand for heating gas weakens, inventories pile up, and the US natural gas benchmark Henry Hub (equivalent to Brent in the oil market) fell to near 30-year lows.
Buying Cocoa or Sugar?
Back to 2026. This El Niño hasn't peaked yet, but the market has already front-run a move.
Palm oil surged from 9,400 yuan in late April to 9,993 yuan before retreating. Rubber rose from its April lows, breaking through 18,300 yuan in mid-May. Sugar seesawed between 5,200 and 5,450 yuan. Peanut oil strung together seven consecutive gains on drought and cost support.
The odd part is that the actual fundamentals of these commodities don't support the rise. Malaysian palm oil inventories were still increasing month-on-month at the end of May, domestic sugar stocks were up 1.83 million tons year-on-year, and domestic palm oil inventories were 25.68% higher year-on-year. Production hasn't even started to drop yet, but prices have risen. The only reason for the rise is the anticipation of reduced yields 6 to 12 months later due to El Niño.
Over the past fifty years, every El Niño of moderate strength or above has left its mark on commodity markets. Palm oil rose 169% during the 1982 event. From 2009 to 2010, Indonesian rubber production fell 11.3%, and spot prices rose 157.79% over two years. Sugar rose 65% from 2015 to 2016.
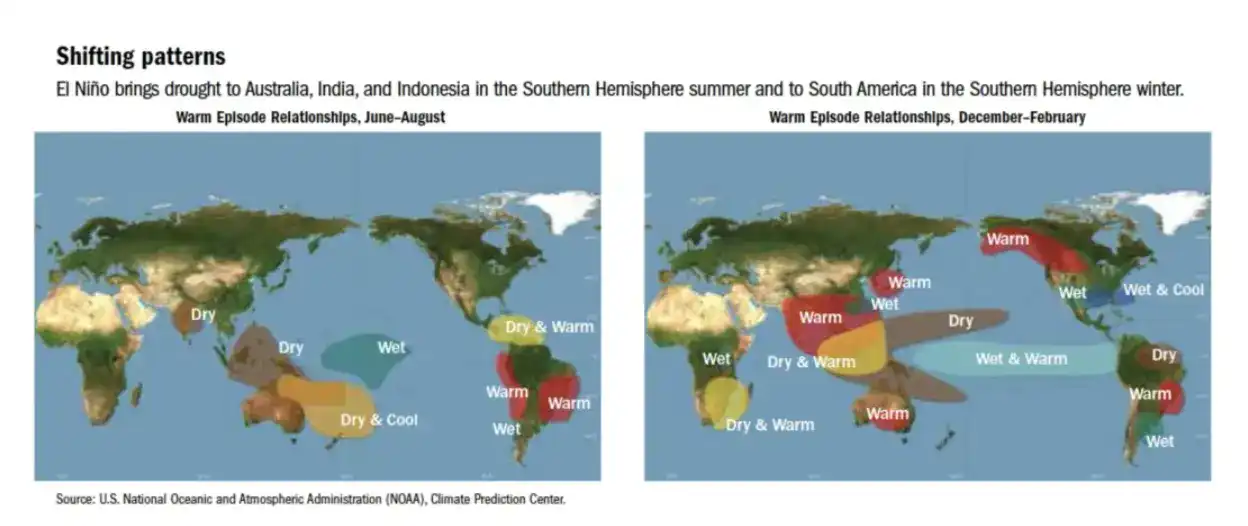
In Southeast Asia, it brings drought, suppressing palm oil and rubber yields. In India, it weakens the monsoon, affecting sugar and cotton. In Peru, it makes anchovies disappear, driving up fishmeal prices. But at the other end of South America, it brings more rain, potentially improving soybean and sugarcane crops in Brazil and Argentina. In the mining regions of Chile and Peru, heavy rains impact not farmland but copper mines. In the US, warm winters suppress natural gas demand.
Discussions about this El Niño continue to ferment in overseas communities.
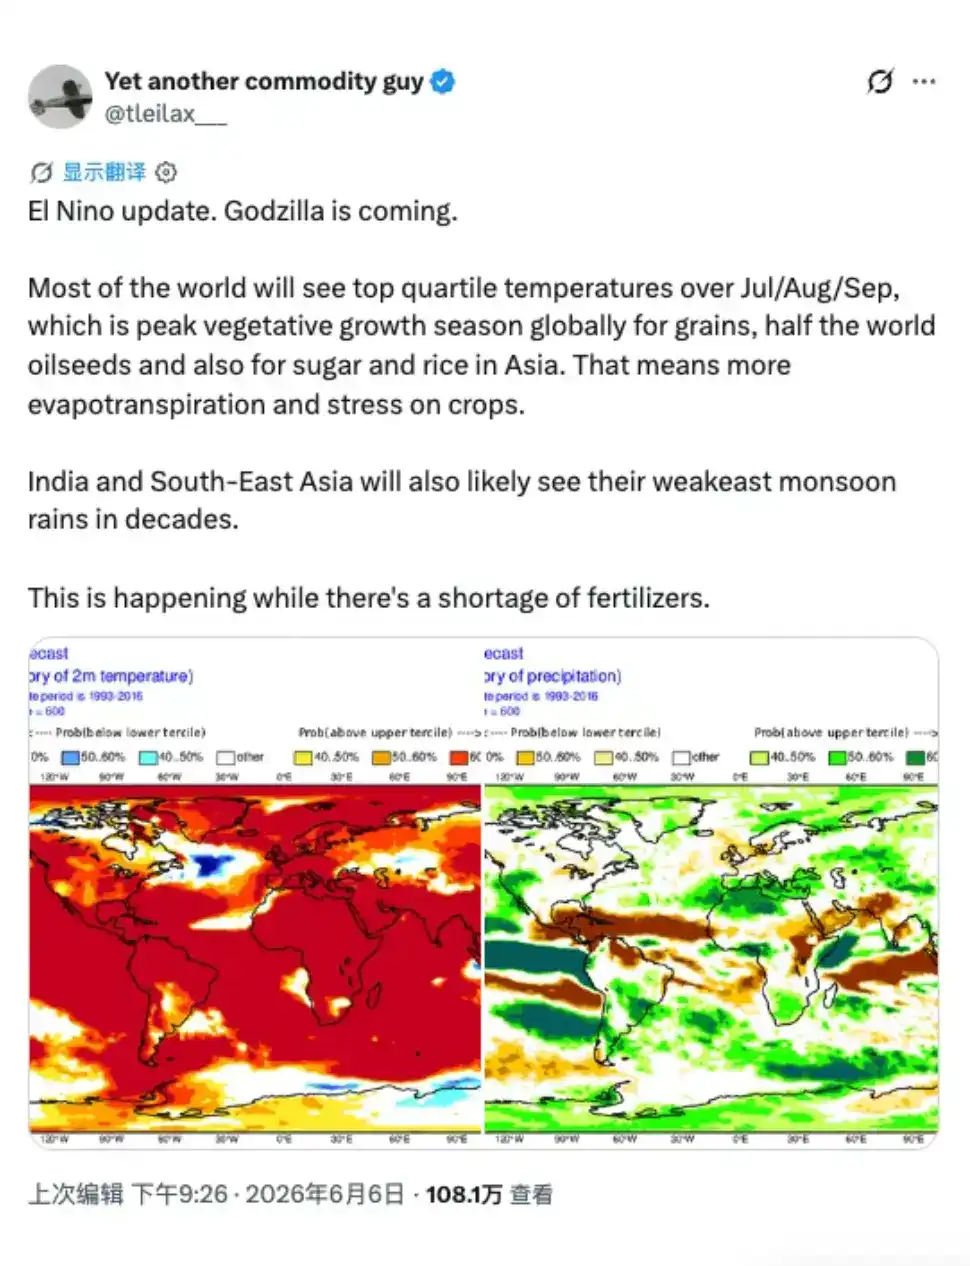
Commodities blogger @tleilax__ posted with two forecast maps. One map shows how much warmer global temperatures will be from July to September this year compared to the same period. The map is almost entirely red, and this timeframe coincides with crucial growing periods for grains, oilseeds, Asian rice, and sugar.
The other map looks at whether rainfall will be above or below average for the same period. The map shows large areas of India and Southeast Asia drier than usual, corresponding to the market's biggest fear: a weak monsoon.
Therefore, his conclusion: India and Southeast Asia may experience their weakest monsoon rains in decades, and this is happening against a backdrop of global fertilizer shortages. This post has garnered over 1.08 million views.
A commodities column on Substack lists palm oil, cotton, and cocoa as the cluster with the clearest risk-reward profile over the next 6 to 12 months. Singapore's investment community is screening Malaysian plantation stocks one by one, concluding that pure upstream planters capture all the upside, while companies like Wilmar International, which focus more on midstream and downstream processing, see their margins squeezed by rising palm oil prices. The US stock community is circulating a more convoluted argument: Brazilian and Argentine agricultural company Adecoagro is a 'weather hedge for tech-heavy portfolios' because El Niño brings rain, not drought, to South America; its production expands while Asian yields shrink and push up prices.
The script for this market move is far from fully played out, so it's not a case of the earlier you buy, the better. There aren't many hard metrics that can change positioning direction, but each one is critical:
-
Whether the Niño3.4 index breaks through 2.0°C in autumn/winter. This is the dividing line between moderate and super El Niño and the switch that raises overall agricultural commodity volatility.
-
Indian monsoon rainfall data from June to September. The steering wheel for the sugar, cotton, and rice group of commodities.
-
The Malaysian Palm Oil Board's monthly inventory reports. The speed at which high inventories are drawn down determines when expectation-driven moves connect with reality-driven ones.
-
July rainfall in Guangxi, China, and the number of consecutive high-temperature days in North China. The former influences sugar, the latter electricity.
-
Subsequent fundraising sizes for weather-specific funds like Moreton. The volume of institutional capital determines whether weather trading is a short-term pulse or a year-long theme.
The experiences of 1972 and 2024 point to the same time lag: the real price effects of El Niño mostly occur after the event peaks. Dennis made his money two years after the anchovy collapse; cocoa truly exploded only after ENSO turned neutral. In the second half of 2026, the market trades expectations; in 2027, it trades the actual production shortfalls.
In the Beginning, No One Cared About This Storm
Beyond these trading opportunities, what's more thought-provoking are two highly reposted posts by finance blogger @FinanceLancelot on X.
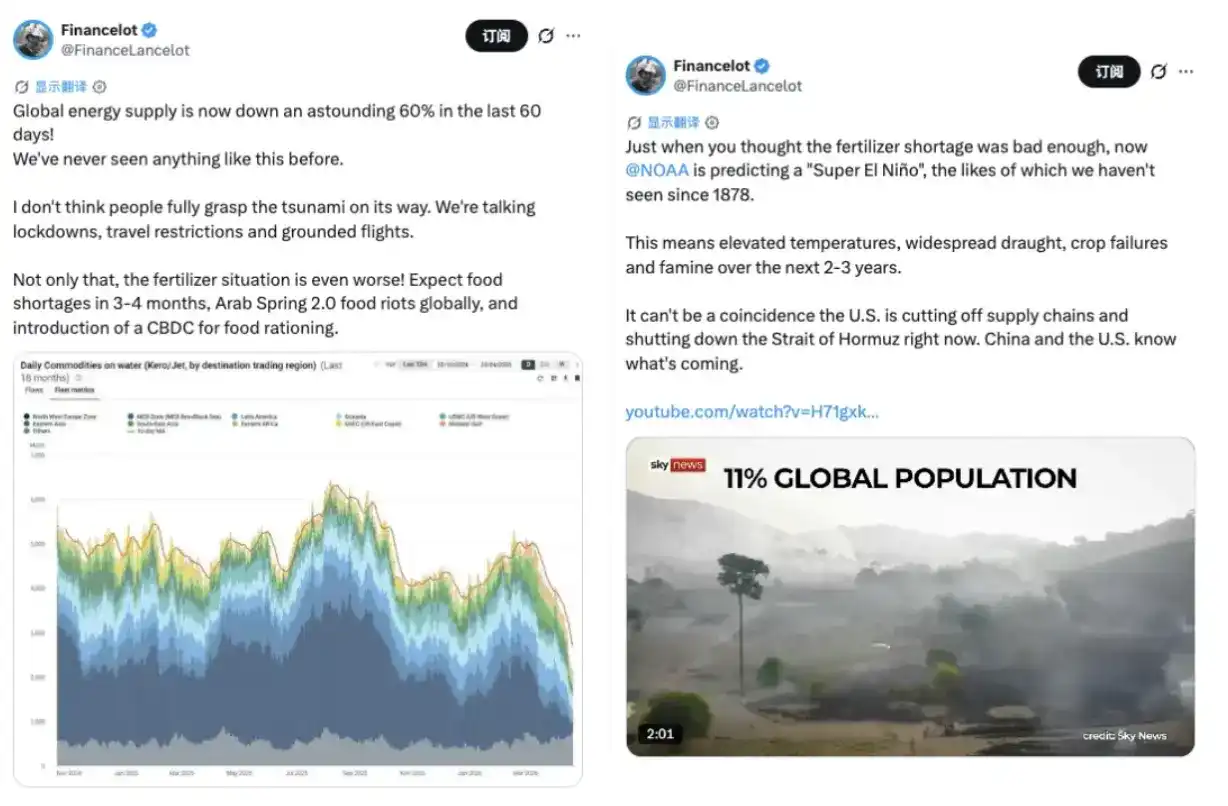
One said NOAA (the National Oceanic and Atmospheric Administration, one of the world's most cited climate monitoring agencies) is predicting a 'super El Niño' not seen since 1878, implying warming, widespread drought, crop failures, and famine risks within the next two to three years. It included a Sky News video titled '11% of the global population.'
The other expressed a similar view: global energy and maritime supplies have fallen 60% in the past 60 days, accompanied by a shipping oil flow chart showing a cliff-like drop from early-year highs. His conclusion: fertilizer shortages combined with El Niño could lead to global food shortages within 3 to 4 months.
The wording of these posts carries a distinct doomsday tone and shouldn't be taken at face value.
But they reflect one thing: a group in the market is already weaving El Niño, energy supply disruptions, fertilizer shortages, and tensions in the Strait of Hormuz into a single narrative, and this narrative is gaining traction and attention.
More importantly, this narrative points not just to gains and losses in futures accounts but to potential impacts on all ordinary people, adding to everyone's cost of living.
In the beginning, no one cared about this storm. It was just a typhoon, a rainstorm, a slight increase in seawater temperature.
But the storm doesn't stop just because no one cares. The rainstorms around the world, the canceled flights, the anchovies disappearing off Peru, the rotting cocoa pods in Ghana, the sugar shortages—these are already part of the storm, destined to land in different people's lives.