Odaily's Invited Market Analyst Cody, Master of Financial Statistics from Columbia University, USA, focused on quantitative trading of US stocks during university and gradually expanded to digital assets such as Bitcoin. He has built a systematic quantitative trading model and risk control system through practical experience; possesses keen data insight into market fluctuations and is committed to continuous深耕 in the professional trading field, pursuing steady returns; will deeply analyze changes in BTC technology, macroeconomics, capital flows, etc., weekly, review and display practical strategies, and preview major upcoming events for reference.
Core Summary of Trading Weekly Report:
In the previous article, we compared the BTC trend structure of 2021 and 2025, judging that history might repeat itself (BTC would continue to adjust), which received a lot of feedback, and some analysts had different views. Below, based on this week's updates, we provide a detailed analysis of the current market trend characteristics and future focus points. Welcome everyone to discuss together.
• Strategy (Short-term) Execution Effectiveness Verification: Last week's trading strictly followed the established strategy, completing one short-term operation (1x leverage), successfully achieving a return of 3.76%. (Detailed explanation see Figure 1)
• Core View (Short-term) Verification: At the beginning of last week, the price quickly fell below the core range of $94,500~$95,000, returning to the original震荡 range of $84,000~$94,500, and continued to move towards the lower轨 of the range. It is particularly emphasized that the lowest point of the price last week恰好 fell on the $86,000 support level we previously indicated. Overall, last week's market trend and the performance of key support levels were precisely verified by the market.
The following will详细回顾 the行情预判, strategy execution, and specific trading process.
一、Learning from History, Need a Dialectical View of the Current Market (See Figure 3)
By comparing the weekly-level adjustments after two historical highs of BTC, we observed that the adjustment starting in October 2025 and the adjustment in November 2021 share惊人相似 structural规律. Currently, the market is at a critical technical decision point.
1、Key Technical Position: Gain and Loss of the Rising Channel Lower轨
The rebound starting from the low of $80,600 on November 21, 2025, has formed a clear rising channel. The lower轨 of this channel has become the "lifeline" determining the short-term trend.
2、Two Possible Paths for Bitcoin's Later Trend:
• If it steadies itself back above the channel lower轨, the B-wave rebound行情 is expected to continue. The next step will first test the pressure near $94,500, then challenge the key resistance level of the 21-week moving average. The realization of this path requires the配合 of macro factors, particularly a shift towards宽松 in Fed policy expectations.
• If it effectively breaks below the channel lower轨 and the model momentum line (daily) breaks below the zero axis, it宣告 the daily level has returned to a bear market. This means the B-wave rebound行情 starting on November 21, 2025, may have ended, and the C-wave adjustment will further continue, significantly increasing the possibility of the price falling below $80,600.
3、Three-stage Adjustment Structure Analysis: Based on the premise of the price effectively breaking the channel lower轨
The current adjustment starting from October 2025 presents a typical three-stage structure:
• A-wave adjustment: $126,200 (2025-10-06) to $80,600 (2025-11-21), lasting 46 days, a drop of 36%.
• B-wave rebound: $80,600 (2025-11-21) to $97,924 (2026-01-14), lasting 54 days, a rise of 21.5%, this stage belongs to technical repair.
• C-wave adjustment: $97,924 (January 14) to present. Currently in this stage of operation, the gain and loss of the channel lower轨 will become the key basis for judging the strength of the C-stage adjustment.
4、C-wave Adjustment Target Prediction:
• $80,600, this is the B-wave starting point. If this point is effectively broken, the A-B-C three-wave adjustment structure starting from $126,200 tends to be complete.
• $75,200, this price is both the 50% Fibonacci retracement level of the A-wave decline and coincides with the adjustment low of April 2025, forming an important historical support area.
"History repeats itself, but does not simply repeat" is the most profound dialectic of financial markets. It requires investors to both respect historical laws and to discern the particularity of the current market. Therefore, all rational market predictions are probabilistic outlooks obtained after comprehensive fundamental and technical structure analysis, not deterministic prophecies. Their ultimate purpose is not to accurately predict the future, but to formulate more resilient coping strategies.
二、Bitcoin Last Week's Market Review: (01.19~01.25)
1、Last Week's Short-term Operation Review: As shown in (Figure 1)
1、Transaction Details Summary: (No leverage)
We strictly followed the trading signals issued by our self-built spread trading model and momentum quantitative model, combined with the预判 of market trends, and completed one short-term operation. This transaction profited 3.76%.

Specific transaction details and review are as follows:
Bitcoin 30-minute K-line chart: (Momentum Quantitative Model + Spread Trading Model)
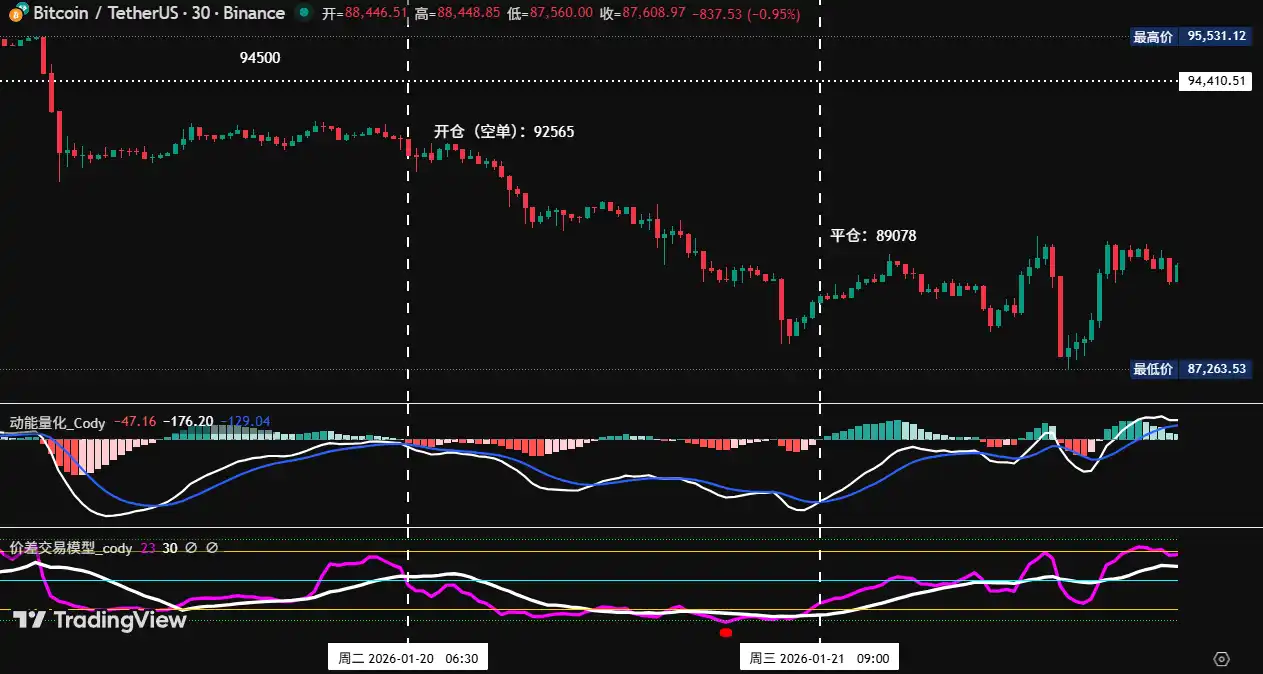
Figure 1
2、Short-term Trading Review:
• First transaction (Profit 3.76%): This operation executed Plan B (Effectively break below the key area to go short) strategy: When the price fell below the $94,500~$95,000 area and反弹无力,同时 the spread trading model and momentum model共振 triggered a top signal,叠加 the two momentum lines formed a dead cross below (near) the zero axis, constituting a triple bearish signal. Based on this, we established a 30% short position at $92,565. Subsequently, the market trend adjusted as expected. When the price fell to an important support level, the spread model率先 issued a触底预警 signal (red dot), followed by the momentum quantitative model and spread trading model共振 again generating a bottom signal. Based on this, we平仓 all positions at $89,078, achieving the expected profit target.
2、Last Week's Trend Prejudgment and Operation Strategy Review:
1、Last week clearly提示: Focus on the gain and loss of the $94,500~$95,000 area. If effectively broken, it will maintain震荡 within the $84,000~$94,500 range.
2、Core point review: Pressure level at $94,500~$95,000 area; First support at $89,500~$91,000 area, Second support at $86,000~$86,500.
2、Operation Strategy Review:
• Mid-line strategy: Empty position.
• Short-term strategy: Because the price effectively broke below the $94,500~$95,000 area, execute operation according to Plan B (see below):
• Open position: If反弹 to this area confirms the break is effective, a 30% short position can be established.
• Risk control: Initial stop loss for short orders set about 1.5% above the cost price(i.e., 1.015*cost price).
• Close position: When it探至 $86,500附近并结合 model signals, can gradually清仓获利了结.
三、Bitcoin Trend Structure: Daily Level Maintains Bearish Pattern
Combining market operation, the author conducts a deep analysis of Bitcoin's trend structure from multiple models and dimensions based on a self-built trading system.
Bitcoin Weekly K-line chart: (Momentum Quantitative Model+Sentiment Quantitative Model)
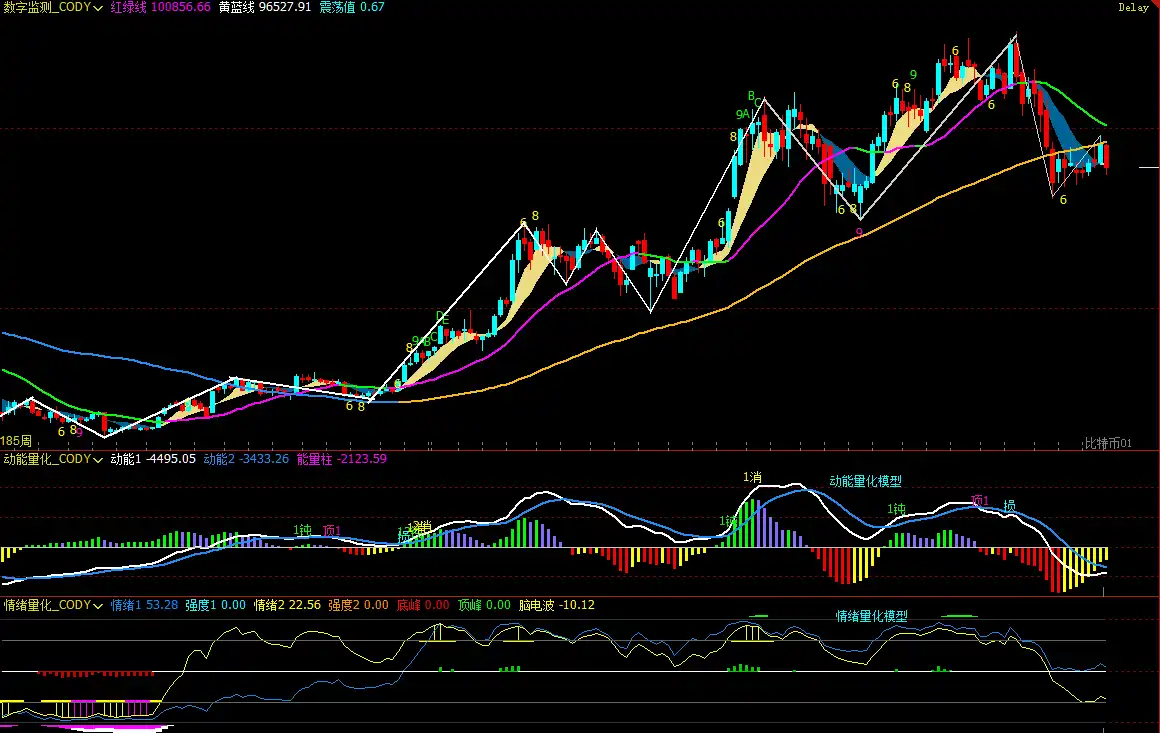
Figure 2
1、As shown in (Figure 2), analysis from the weekly chart:
• Momentum Quantitative Model: Technical indicators show that shorting momentum was released last week, the two momentum lines showed signs of opening, the negative energy column change was not obvious, pay attention to the bears' next performance.
Momentum Quantitative Model Predicts: Price decline index: High
• Sentiment Quantitative Model: Blue sentiment line value 53.28, strength zero; Yellow sentiment line value 22.56, strength zero, peak value is 0.
Sentiment Quantitative Model Predicts: Price pressure and support index: Neutral
• Digital Monitoring Model: The price has been below the bull-bear (yellow-blue line)分界线 for 10 weeks, the price has fallen again, the price is far from the分界线.
Digital Monitoring Model Predicts: Monitoring (top/bottom) digital signals have not appeared; Weekly K-line closed with a large阴线, decline about 7.55%; The recent three-week K-lines form a "strong top分型" bearish pattern.
The above data predicts: Bitcoin weekly bearish trend, beware of震荡下跌 risk.
Bitcoin Daily K-line chart: (Momentum Quantitative Model+Sentiment Quantitative Model)
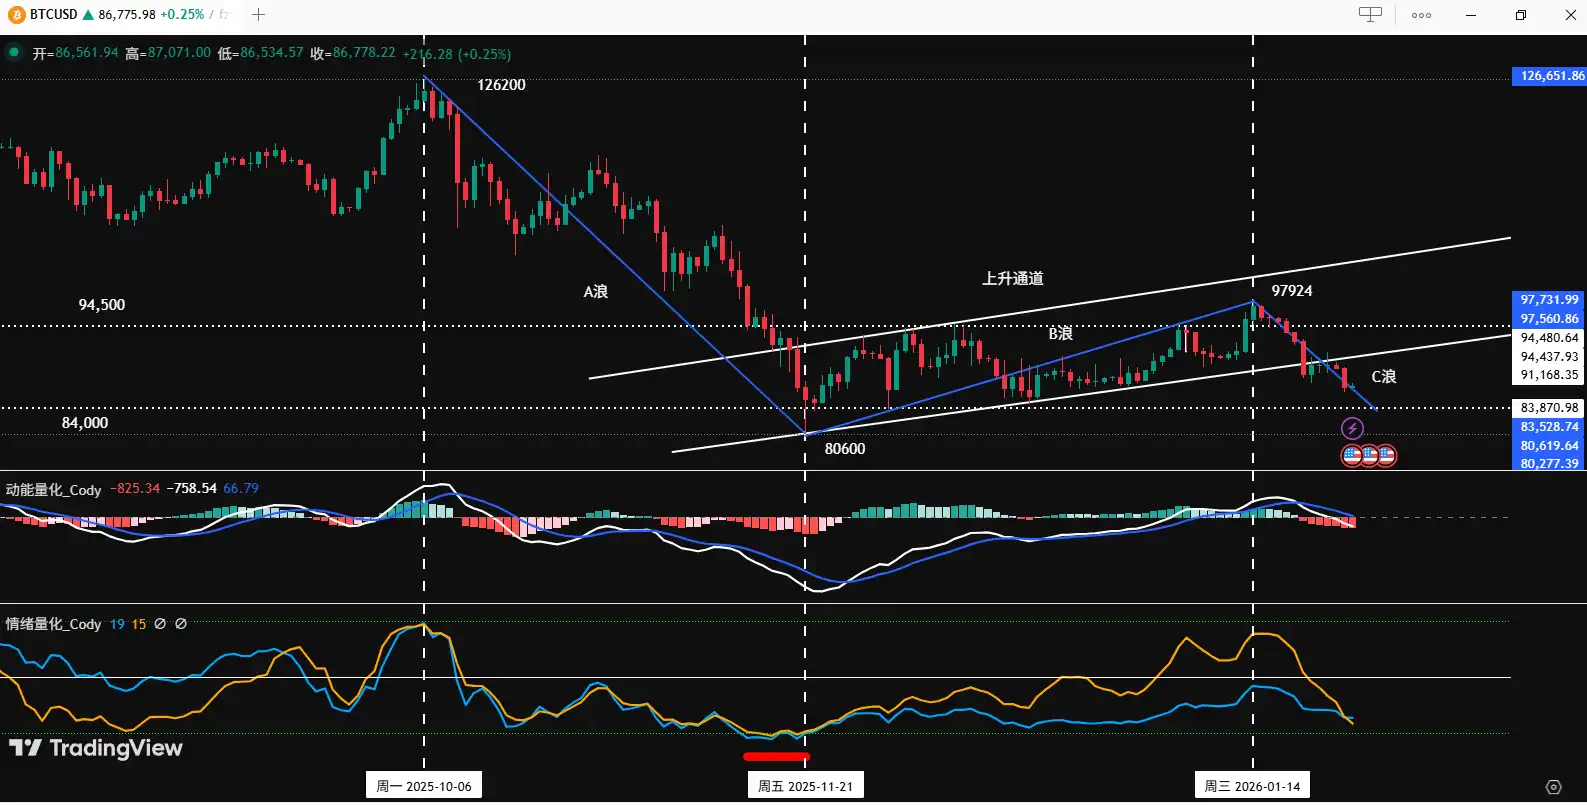
Figure 3
2、As shown in (Figure 3), analysis from the daily chart:
• Momentum Quantitative Model: Last week overall presented a "decline-震荡-decline" pattern. After Sunday's盘后, Momentum Line 1 has fallen below the zero axis, Line 2 is about to fall below the zero axis; Negative energy column is gradually放大.
Momentum Quantitative Model Predicts: Daily shorting momentum is being released, pay attention to the gain and loss of the zero axis.
• Sentiment Quantitative Model: After last week's daily close, blue sentiment line value 19, strength zero; yellow sentiment line value 20, strength zero.
Sentiment Quantitative Model Predicts: Pressure and support index: Neutral
The above data提示: The daily level initially shows a bearish pattern,有效性 still待确认, pay attention to the bull-bear battle for the zero axis.
四、This Week's Market Prediction: (01.26~02.01)
1、This Week's Core View: Pay attention to the effective confirmation after breaking the rising channel lower轨.
• If the price effectively breaks below the lower轨, the price will accelerate adjustment, target first look at the lower edge of the original震荡 box near $84,000.
• If the price effectively stabilizes, it will maintain震荡 within the rising channel, but the height is limited.
2、Core Pressure Levels:
• First pressure area: $88,500~$91,200 area (previous震荡中枢)
• Second pressure area: $94,500~$95,000 area (previous震荡中枢)
• Important pressure area: Near the 21-week moving average
3、Core Support Levels:
• First support level: $86,000~$86,500 area (previous筹码密集成交区)
• Second support level: Near $84,000 (previous box lower edge)
• Important support level: Near $80,000~$80,600 (near last November's low)
五、This Week's Operation Strategy (Excluding Sudden News Impact): (01.26~02.01)
1、Mid-line strategy: If it effectively breaks below the rising channel lower轨, can choose to establish a 60% short position.
2、Short-term strategy: Use 30% of the position, set stop loss points, based on support and pressure levels, look for "spread" opportunities. (Use 30 minutes as the operation cycle).
3、In operation, focus on the gain and loss of the rising channel lower轨. To dynamically respond to market evolution and combine real-time model signals, we have formulated A/B two sets of short-term operation plans:
• Plan A: If the price falls below the rising channel lower轨:
• Open position: After effective break and combined with model top signal, can establish a 30% short position.
• Risk control: Initial stop loss for short orders set about 1.5% above the cost price(i.e., 1.015*cost price).
• Close position: When falling to near important support levels and combined with model signals, can gradually清仓获利了结.
• Plan B: If the price stabilizes back above the rising channel lower轨: (Sell on resistance)
• Open position: When反弹 to important pressure levels or the channel upper轨 shows受阻信号, and combined with model top signal, can establish a 30% short position.
• Risk control: Initial stop loss for short orders set about 1.5% above the cost price(i.e., 1.015*cost price).
• Close position: When falling to the channel lower轨 or support levels, and combined with model signals, can gradually清仓获利了结.
六、Special Tips:
1、When opening a position: Immediately set the initial stop loss level.
2、When profit reaches 1%: Move the stop loss to the opening cost price (break-even point), ensuring principal safety.
3、When profit reaches 2%: Move the stop loss to the position of 1% profit.
4、Continuous tracking: Thereafter, for every additional 1% profit, the stop loss level moves同步 1%, dynamically protecting and locking in profits.