Analyst Reveals The Chances Of Bitcoin Price Crashing Again

bitcoinist发布于2026-04-18更新于2026-04-18

文章摘要

Analyst Sykodelic argues that the probability of Bitcoin experiencing another significant price crash has substantially decreased. This conclusion is based on a key technical indicator: the weekly Relative Strength Index (RSI) has broken above a descending trendline after falling to historic lows in Q1 2026, a rare event that has only occurred three times in Bitcoin's history. This bullish RSI breakout suggests the chances of Bitcoin revisiting new price lows are now very slim. This technical signal is supported by multiple converging bottom indicators and broader market data. Bitcoin exchange reserves have dropped to seven-year lows, while large investors are accumulating over $2 billion worth of BTC. Furthermore, spot Bitcoin ETFs have seen strong net inflows in March and April 2026. Despite this optimistic outlook, the analyst emphasizes the importance of watching how Bitcoin closes the current week. At the time of writing, Bitcoin is trading around $75,818.

Bitcoin’s recent price behavior has kept traders split between those expecting another leg down and those calling that a bottom is already in. That tension is now feeding different technical analyses, with one analyst arguing that the probability of a deeper crash has dropped significantly based on long-term signals.

Chance Of Bitcoin Making New Lows Is Very Small

Bitcoin has spent months testing the patience of its holders since its all-time high of $126,000 in 2025. According to crypto analyst Sykodelic, there is a compelling case that the drawdown is done and that the probability of Bitcoin revisiting new lows at this point has dropped massively.

Sykodelic’s rationale leans heavily on the behavior of the Relative Strength Index (RSI) on the weekly candlestick timeframe chart. According to his analysis posted on X, Bitcoin has just printed a powerful bullish break on the weekly RSI, and what makes this particular reading extraordinary is not just where it bounced from but how low it got before doing so.
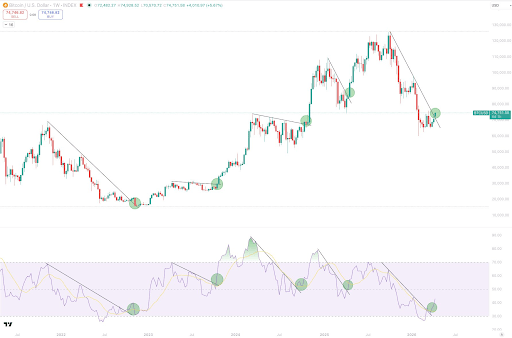
Source: Chart from Sykodelic on X

The weekly RSI has only fallen below 30 on three occasions in BTC’s history, with the most recent being Q1 2026. However, the RSI is now back into the normal zone, and it has broken above a descending trendline that touches lower highs. According to the analyst, this scenario means that the probabilities are now very slim for new lows of any kind.

The Bottom Signals Have Stacked Up

The RSI break did not arrive on its own. Sykodelic noted that multiple bottom indicators have converged simultaneously, a convergence he described as reaching a very high degree. According to him, about 12 important bottom indicators have fired, and Bitcoin is showing it here.

The broader data support his reading. Bitcoin exchange reserves have fallen to seven-year lows while whale wallets are now accumulating more than $2 billion worth of Bitcoin, their highest in over two months. Spot Bitcoin ETFs have recorded $954.05 million in net inflows so far in April, following a $1.32 billion inflow in March, which was the first positive month since October 2025.

Looking at the chart Sykodelic shared, the weekly price structure shows BTC breaking out of a descending trendline above $70,000, a pattern visible across both the price candles and the RSI panel below. Previous breakouts in 2022, 2023, and early 2025 were characterized by a similar RSI breakout of a descending trendline.

All of this contributes to a market environment where downside continuation becomes harder to sustain. Despite his conviction, Sykodelic stopped short of declaring an unconditional all-clear. The most important thing now is seeing how BTC closes the week. At the time of writing, Bitcoin is trading at $75,818, up by 1.4% in the past 24 hours.

BTC trading at $75,675 on the 1D chart | Source: BTCUSDT on Tradingview.com

热门币种推荐

相关问答

QWhat is the main argument presented by analyst Sykodelic regarding Bitcoin's price crash probability?

ASykodelic argues that the probability of Bitcoin revisiting new lows has dropped massively, based on a powerful bullish break on the weekly RSI and the convergence of multiple bottom indicators.

QHow many times has Bitcoin's weekly RSI fallen below 30 in its history according to the analysis?

AThe weekly RSI has fallen below 30 on three occasions in Bitcoin's history, with the most recent being Q1 2026.

QWhat are some of the broader market data points that support the analyst's bullish reading?

ABitcoin exchange reserves have fallen to seven-year lows, whale wallets are accumulating over $2 billion worth of Bitcoin (their highest in over two months), and spot Bitcoin ETFs recorded significant net inflows in March and April.

QWhat key price level did Bitcoin break out of according to the weekly price structure chart?

ABitcoin broke out of a descending trendline above $70,000, a pattern visible in both the price candles and the RSI panel.

QWhat is the most important thing to watch now, according to Sykodelic, despite his conviction?

AThe most important thing now is seeing how Bitcoin closes the week, as the analyst stopped short of declaring an unconditional all-clear.

你可能也喜欢

福建晋江,一家存储超级独角兽静悄悄

近日,随着长鑫科技A股上市成为股王,同为国内三大存储芯片项目之一的福建晋华集成电路有限公司(晋华)重新进入公众视野。这家位于福建晋江的DRAM企业,自2016年成立起便肩负打破海外垄断的使命,却因2018年被美国列入实体清单并遭遇司法指控而陷入长达数年的沉寂。2024年2月,美国法院裁定其无罪,晋华才得以摆脱法律阴影。 晋华的曲折发展与灵魂人物陈正坤密不可分。这位拥有美光与联电背景的工程师,怀揣自主开发DRAM的梦想加入晋华。公司初期通过与联电合作快速推进,但随后美光发起诉讼,指控技术窃密,导致晋华产线因设备禁运而停摆。在极端困难下,陈正坤带领团队改造国产设备、重构工艺,艰难维持运营。尽管最终赢得清白,但发展进度已被严重拖慢。目前,晋华专注于利基型DRAM市场,月产能约4万片,拥有千余项专利,但仍在美国实体清单限制之下。 晋江这座以鞋服闻名的民营经济强市,为引入晋华这一“硬科技”项目投入巨资,并以政府基金、全链条配套和持续的政策支持,助力企业在制裁中生存下来。如今,以晋华为龙头,晋江已形成超千亿规模的集成电路产业集群。在全球AI驱动存储繁荣的周期中,晋华虽规模尚小,但其在封锁中重建的经历,已成为中国存储产业自主攻坚的缩影。

marsbit6分钟前

福建晋江,一家存储超级独角兽静悄悄

marsbit6分钟前

《夏季拉锯战》仍在继续:突破67000美元将是比特币上涨的起点

比特币价格在8月1日跌至62,217美元,延续了自6月5日开始的盘整格局。目前比特币被困在58,000至67,000美元的区间内,市场参与者对下一步走向存在分歧。 技术分析显示关键价位在60,000美元和67,000美元。交易员Crypto Candy认为,只要价格低于66,000美元,就可能跌向60,000美元或更低。投资者Jelle则将当前市场比作“夏季拉锯战”,坚持定期买入的平均成本策略。 上行突破的关键在于能否站稳67,000美元以上。交易员Daan Crypto Trades认为,若无法突破此位,市场可能继续盘整。交易员Roman则预测,若伴随足够交易量有效突破67,000美元,价格可能快速上涨至70,000-80,000美元区间。 宏观分析师Gert van Lagen从更长周期观察,认为比特币正在测试一个持续七年之久的“杯柄形态”的颈线位,市场恐惧情绪在盘整中逐渐消退。他强调,长期持有者仍未出现投降迹象,NUPL指标显示他们远未进入抛售区域。 总而言之,市场共识是比特币正处于积累阶段,60,000美元和67,000美元是关键水平,对任一水平的突破都将决定资产的下一个方向。当前围绕67,000美元的博弈,也反映出短期持有者盈亏平衡点附近的心理压力。近期价格在利好新闻后迅速回落,表明市场叙事尚未转化为持续的资本流入,能否构建更稳固的上涨基础仍有待观察。

cryptonews.ru1小时前

《夏季拉锯战》仍在继续:突破67000美元将是比特币上涨的起点

cryptonews.ru1小时前

交易

现货

热门文章

加密市场宏观研报:《GENIUS Act》法案取得重大进展,BTC突破历史新高,后市全新展望

2025年5月22日,比特币价格正式突破11万美元大关,创下历史新高。在政策面、宏观经济、资金面与投资者结构共同作用下,一场结构性牛市浪潮正在展开。而此轮上涨背后的核心驱动,是美国《GENIUS稳定币法案》的实质性进展以及多项利好的叠加。本文将从政策端突破、宏观环境转向、链上与ETF资金结构、交易行为演化,以及重点受益赛道五大维度,全面解析此轮BTC再创新高的深层逻辑,并前瞻下半年市场的潜在趋势。

1.8k人学过发布于 2025.05.22更新于 2025.05.22

加密市场宏观研报:《GENIUS Act》法案取得重大进展,BTC突破历史新高,后市全新展望

相关讨论

欢迎来到HTX社区。在这里,您可以了解最新的平台发展动态并获得专业的市场意见。以下是用户对BTC(BTC)币价的意见。

活动图片