Bitcoin started a steady increase above the $42,000 resistance against the US Dollar. BTC tested the $43,400 zone and recently corrected lower.
- Bitcoin started a downside correction after a test of $43,400.
- The price is trading above $42,000 and the 100 hourly simple moving average.
- There is a key bullish trend line forming with support near $41,950 on the hourly chart of the BTC/USD pair (data feed from Kraken).
- The pair must stay above the $41,500 support zone to remain in a positive zone.
Bitcoin Price Remains In Uptrend
Bitcoin price started a steady increase after it cleared the $42,000 resistance zone. BTC gained pace for a move above the $42,500 level and settled above the 100 hourly simple moving average.
The upward move was such that the price even broke the $43,200 resistance. It traded as high as $43,402 and is currently correcting lower. There was a move below the 23.6% Fib retracement level of the recent increase from the $40,510 swing low to $43,402 high.
However, the bulls are defending the $42,000 support zone. There is also a key bullish trend line forming with support near $41,950 on the hourly chart of the BTC/USD pair. The trend line is close to the 50% Fib retracement level of the recent increase from the $40,510 swing low to $43,402 high.
On the upside, the price is facing resistance near the $42,800 level. The next major resistance could be near the $43,000 zone. A successful break and close above the $43,000 level might start another steady increase.
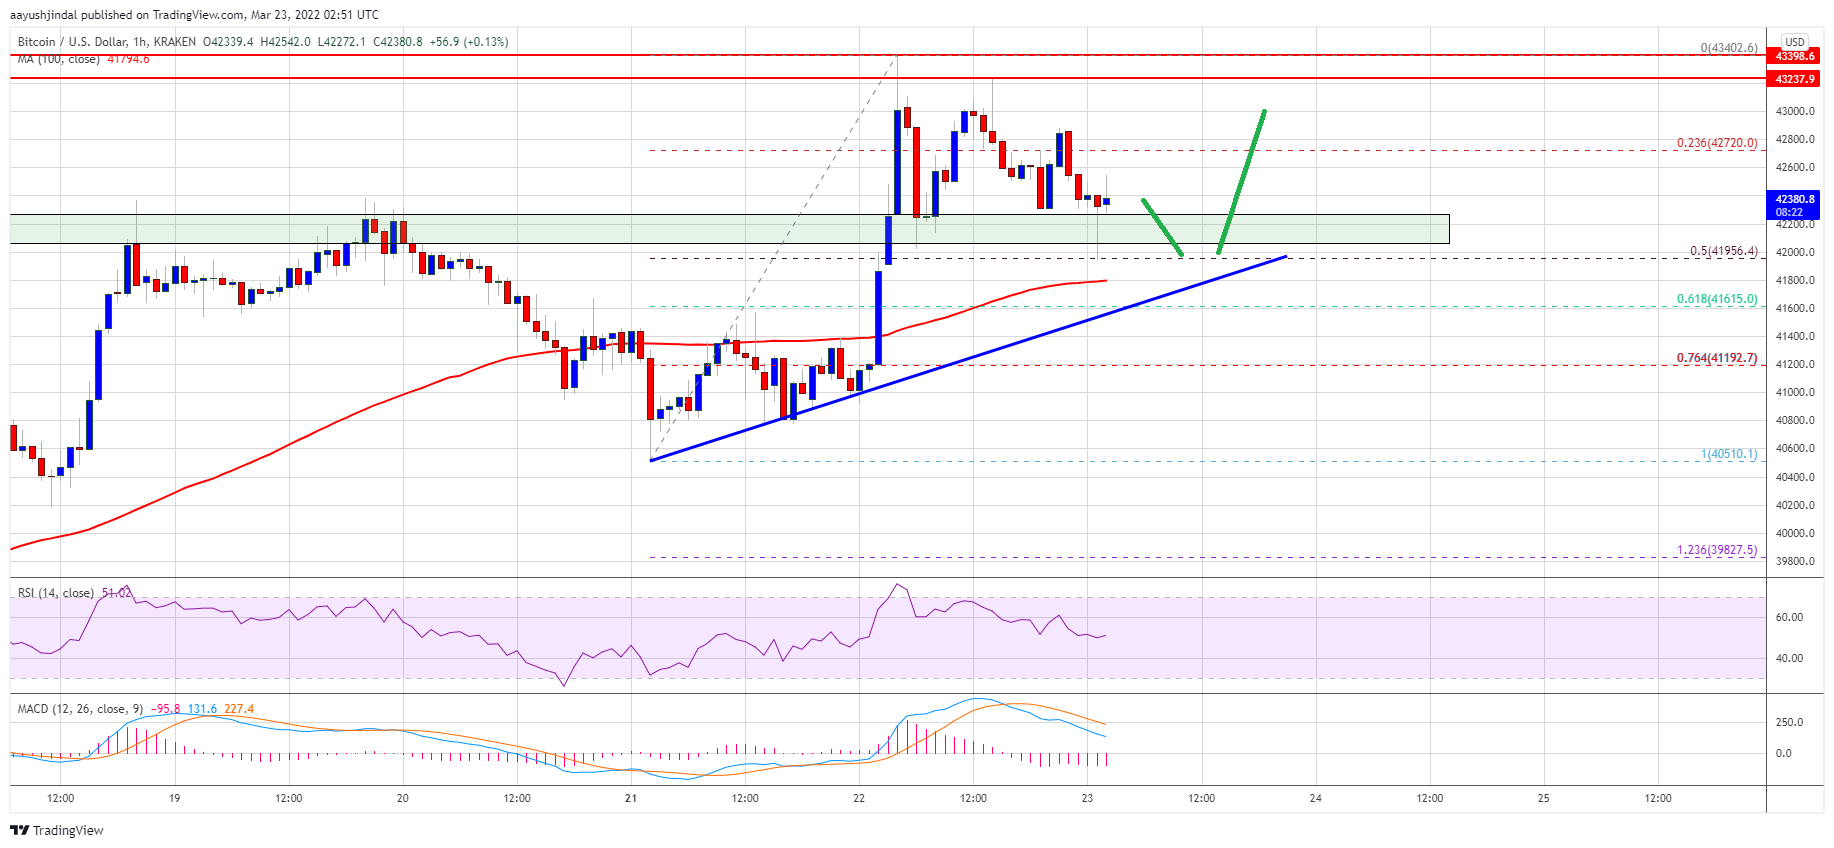
Source: BTCUSD on TradingView.com
In the stated case, the price might rise towards the $43,500 level. Any more gains could send the price towards the $44,200 level in the coming sessions.
Downside Break in BTC?
If bitcoin fails to clear the $43,000 resistance zone, it could correct further lower. An immediate support on the downside is near the $42,000 zone.
The next major support is seen near the trend line and the 100 hourly SMA. The main support sits near the $41,500 zone (the previous breakout zone). A downside break below the $41,500 support zone could push the price further lower towards $40,500.
Technical indicators:
Hourly MACD – The MACD is now losing pace in the bearish zone.
Hourly RSI (Relative Strength Index) – The RSI for BTC/USD is now above the 50 level.
Major Support Levels – $42,000, followed by $41,500.
Major Resistance Levels – $42,800, $43,000 and $43,500.