DeXe slips 13% – But here’s why the pullback may be temporary

ambcrypto发布于2026-07-14更新于2026-07-14

文章摘要

DeXe (DEXE) has recently pulled back by approximately 13% after a significant rally, gaining over 1,000% in the past six months. This dip is largely attributed to profit-taking by buyers. Analysis of the price chart indicates the sell-off may be temporary. Key demand zones are seen as potential support levels, with the first zone being the most likely to hold. Technical indicators support this view: the Accumulation/Distribution line shows slight upward divergence despite falling prices, and the RSI remains in a neutral-bullish range near 52. Furthermore, spot market data reveals a sharp decline in net selling pressure, dropping more than tenfold from its recent peak. The evidence suggests the current weakness is a slowdown within a longer-term bullish trend rather than a decisive reversal.

DeXe [DEXE] has been printing fresh highs for weeks, gaining 45% in the past seven days alone and more than 1,000% across the past 180 days, as reflected on the chart.

Over the past 24 hours, capital has begun retreating as buyers step back and lock in profit, a shift that has dragged the asset down roughly 13% within the period.

The chart structure, however, points to a possible temporary pullback, with price still positioned to extend its upside over the longer term.

DeXe doji candles expose a standoff

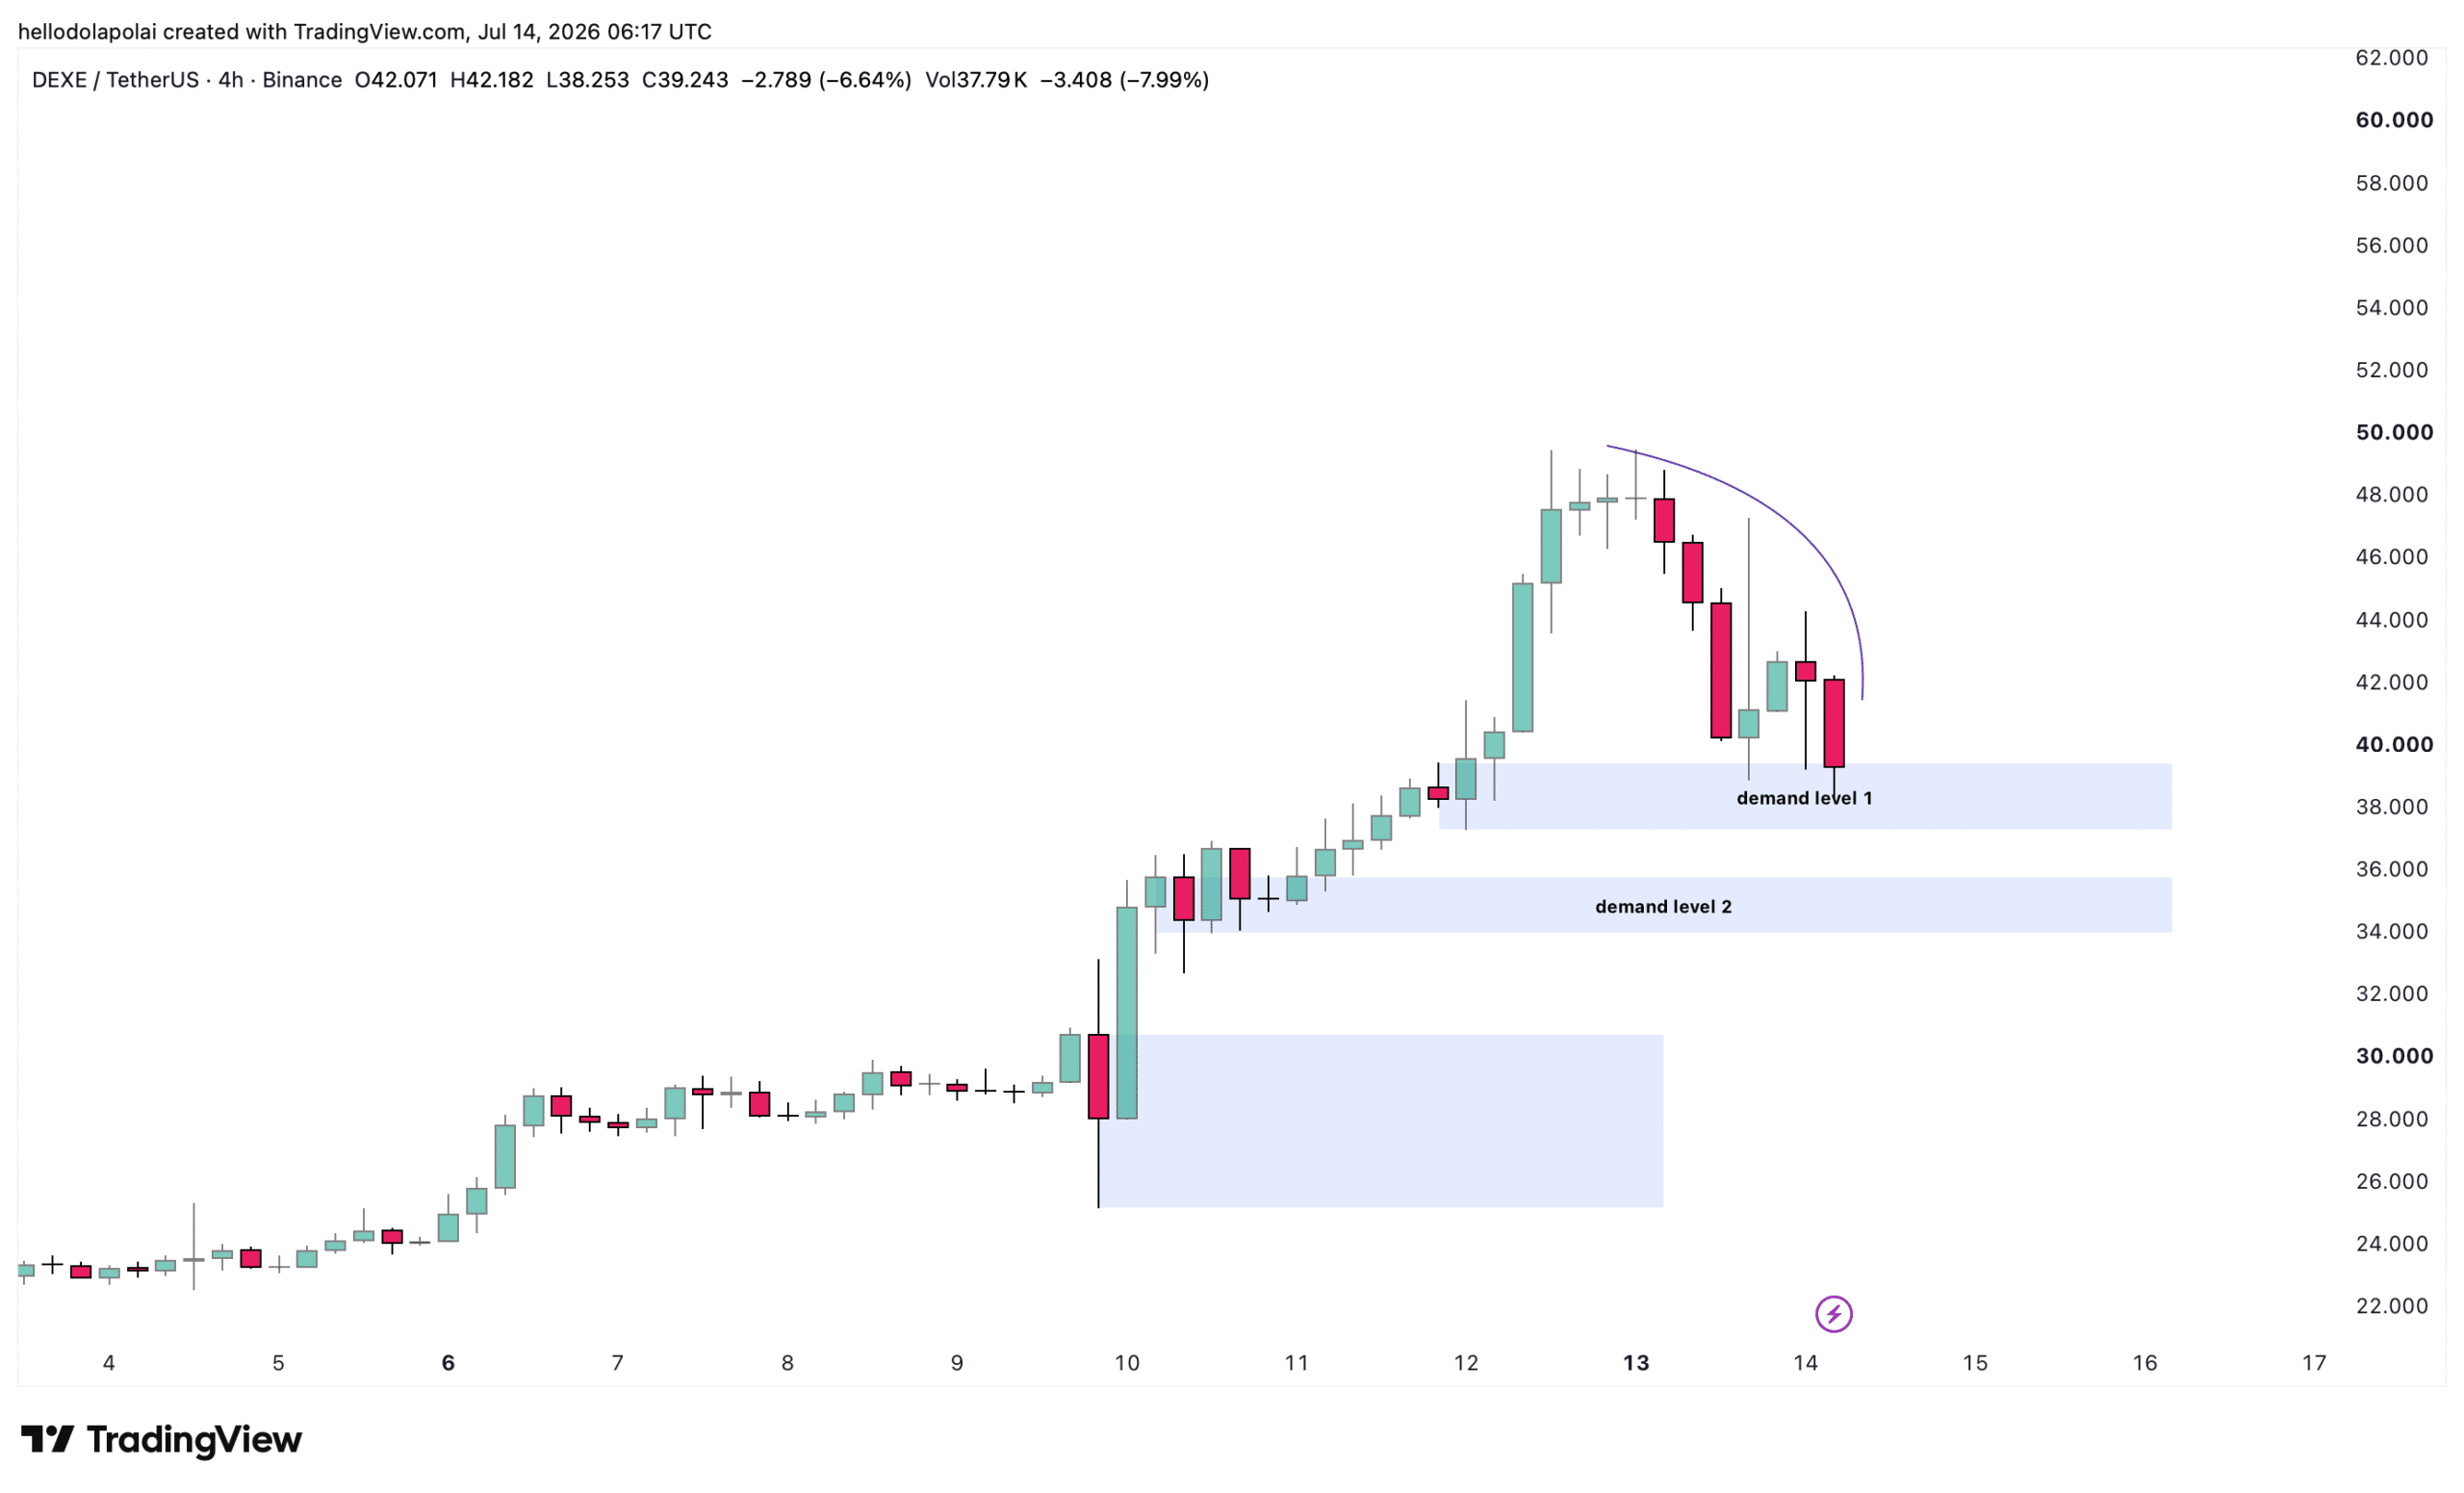
DeXe printed two telling doji candles in the early hours of the day.

The first, a gravestone doji, reflected intense sell pressure as price attempted to extend its upswing, while a dragonfly doji formed a few candles later and signaled bulls stepping back in.

Price currently sits decidedly bearish, and the near-term outcome hinges on the key demand zones mapped on the chart.
Source: TradingView

Demand zone 1 offers the first line of support, and a sufficient bounce there could send price swinging upward to clear the overhead liquidity marked by the curved line on the left.

Should selling pressure keep mounting and that level give way, demand zone 2 stands ready to cushion price and absorb the pressure that has weighed on the asset for most of the day.

Demand zone 1 holding remains the likelier scenario, and volume data supports that read, with volume down 36% over the period.

Declining volume alongside a falling price often signals that the momentum driving the move is weak, which opens room for buyers to take control.

Indicators point to a slowdown rather than a reversal

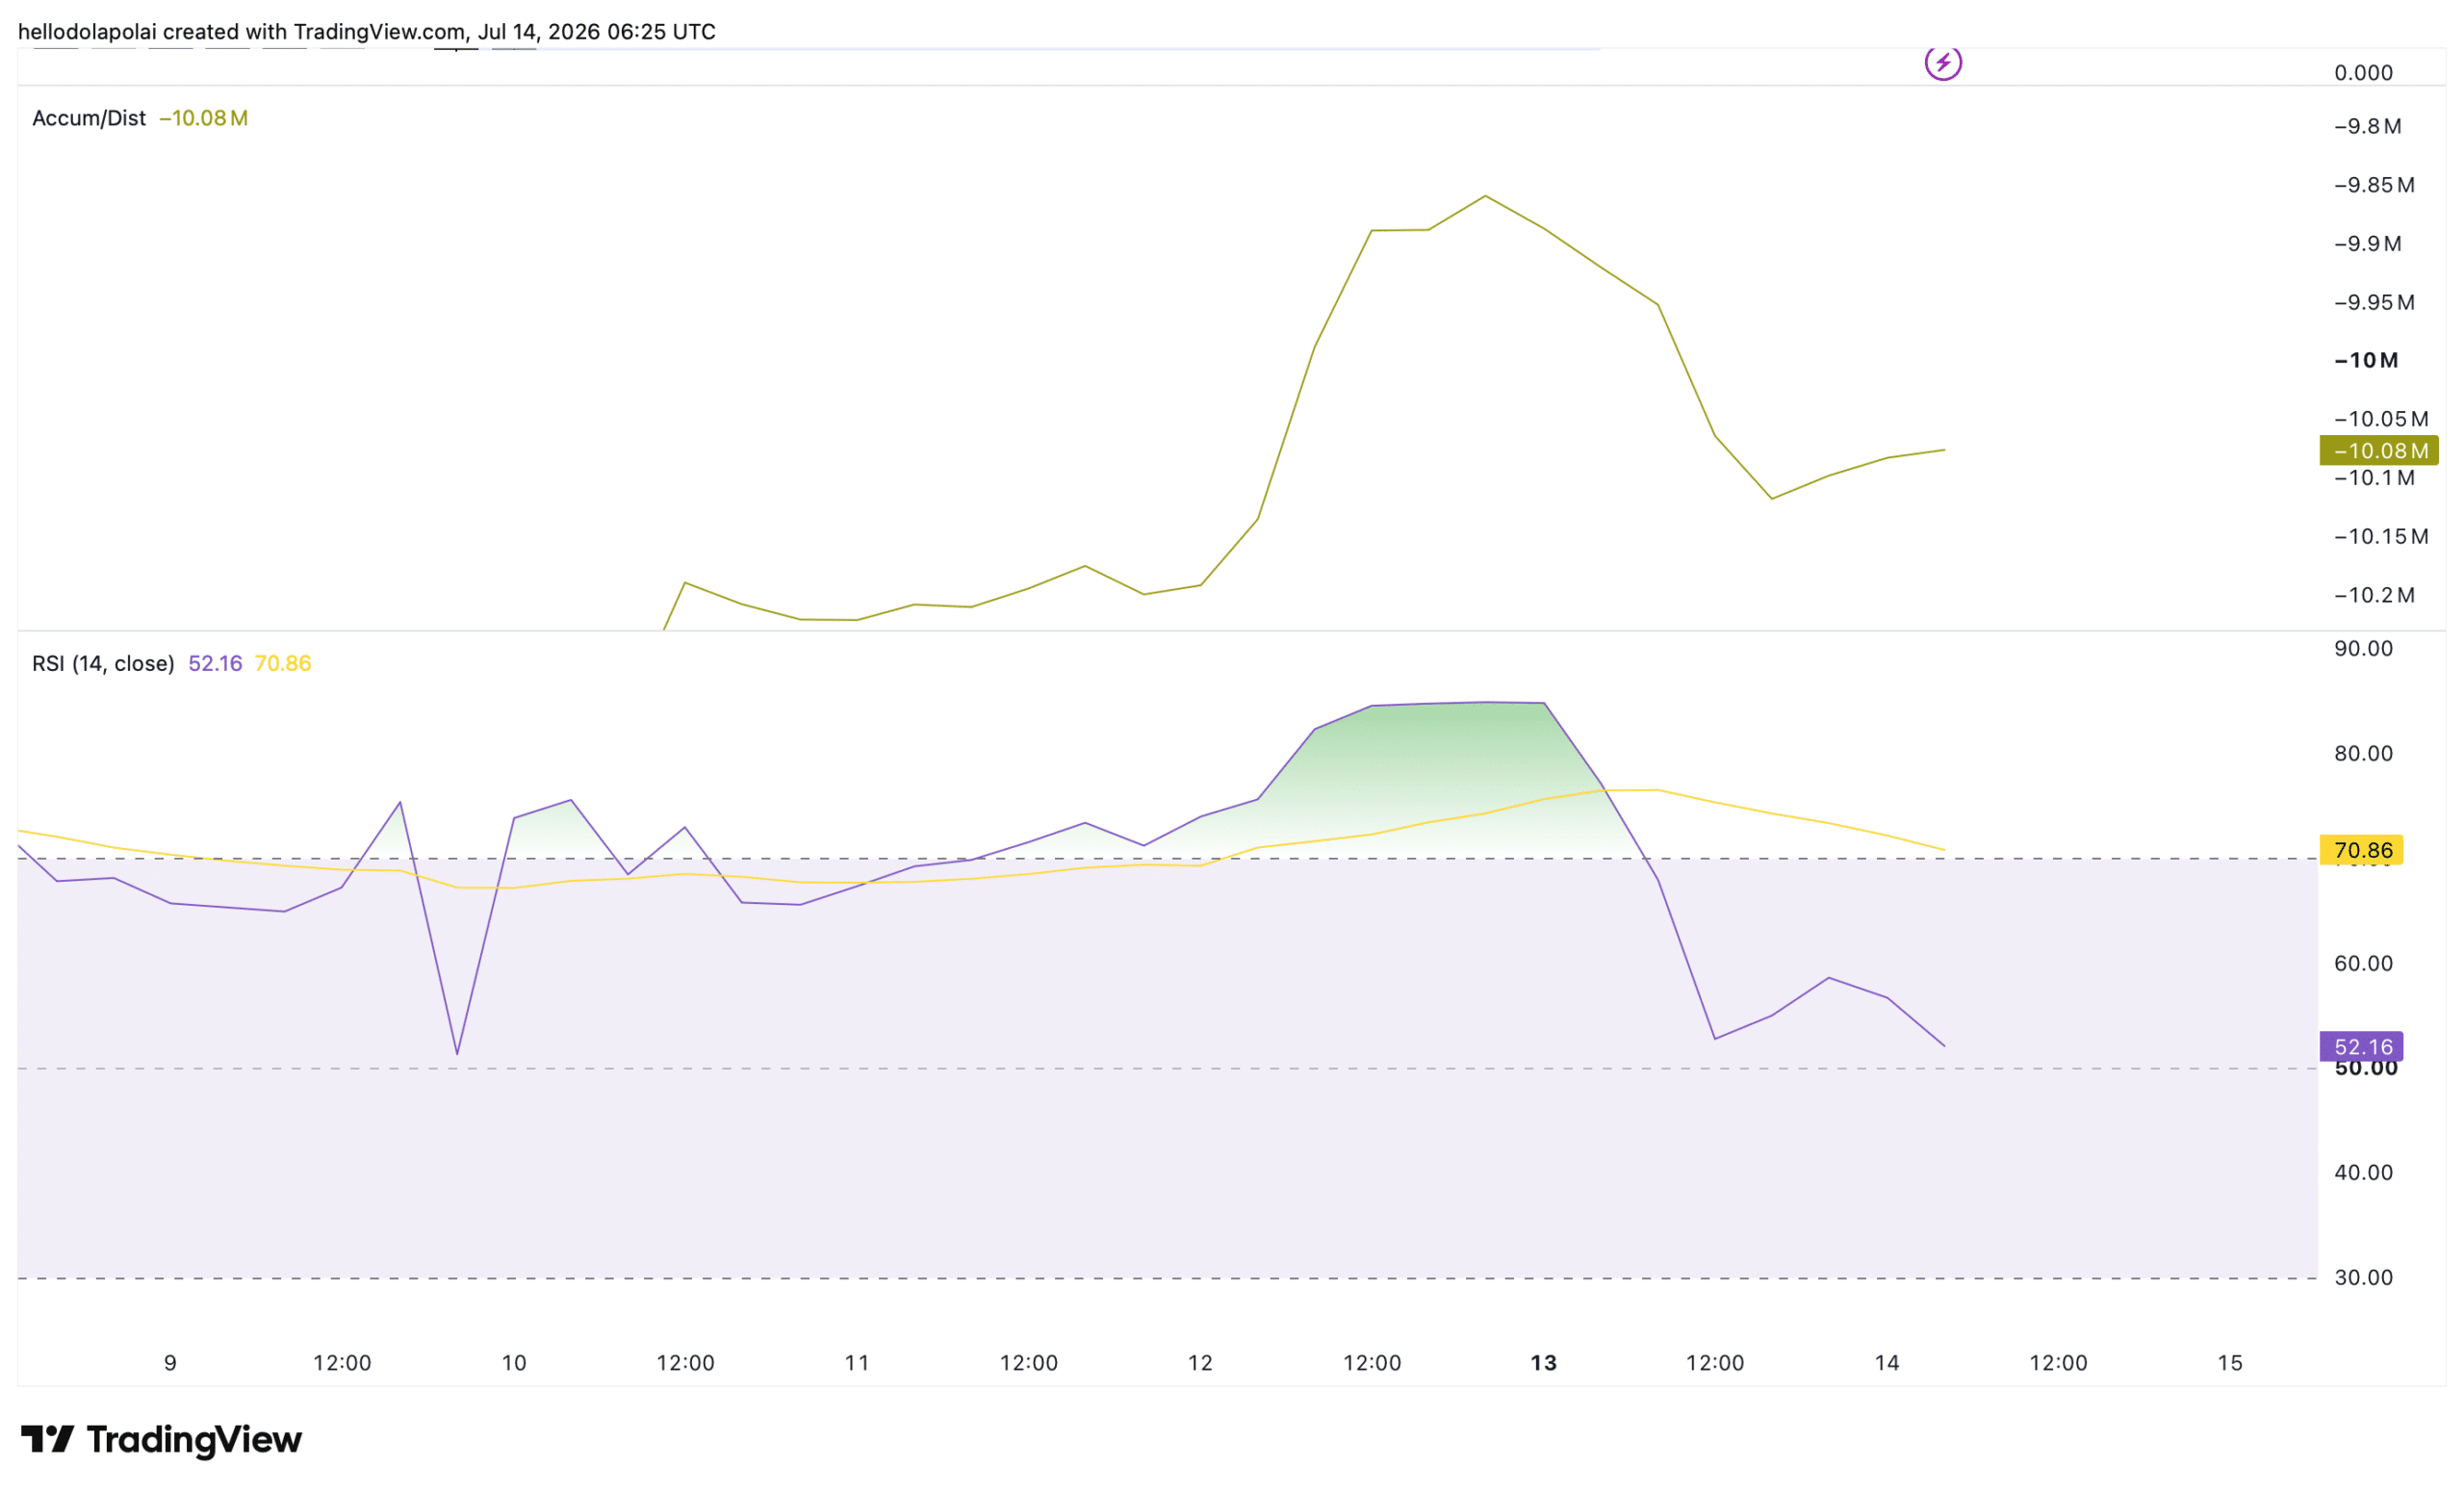
Momentum indicators aren’t fully aligned with the bearish price action, and the Accumulation/Distribution (A/D) indicator captures that tension.

The A/D line weights each period’s volume by where price closes within its range, serving as a proxy for whether an asset is being accumulated or distributed.

At the time of this report, it was trending slightly upward even as prices fell, a divergence that suggests a modest step-up in buyer activity within the period.
Source: TradingView

Likewise, the relative strength index (RSI) is holding within the bullish 50 to 70 band at a reading of 52.

The RSI measures the speed and magnitude of recent price moves, and a reading sitting right on the midline points to neutral, relaxed sentiment rather than a decisive bearish shift.

The balance suggests the price is likely to settle around this level, which coincides with the demand zone.

Sell pressure eases across the Spot market

Spot market data points to easing sell pressure so far. Spot netflow hit its highest net sales on the 12th of July as sellers dominated and net inflows reached $5.38 million.

Although sellers still hold the upper hand, the netflow has plunged to just $391,000, more than ten times below the earlier reading.
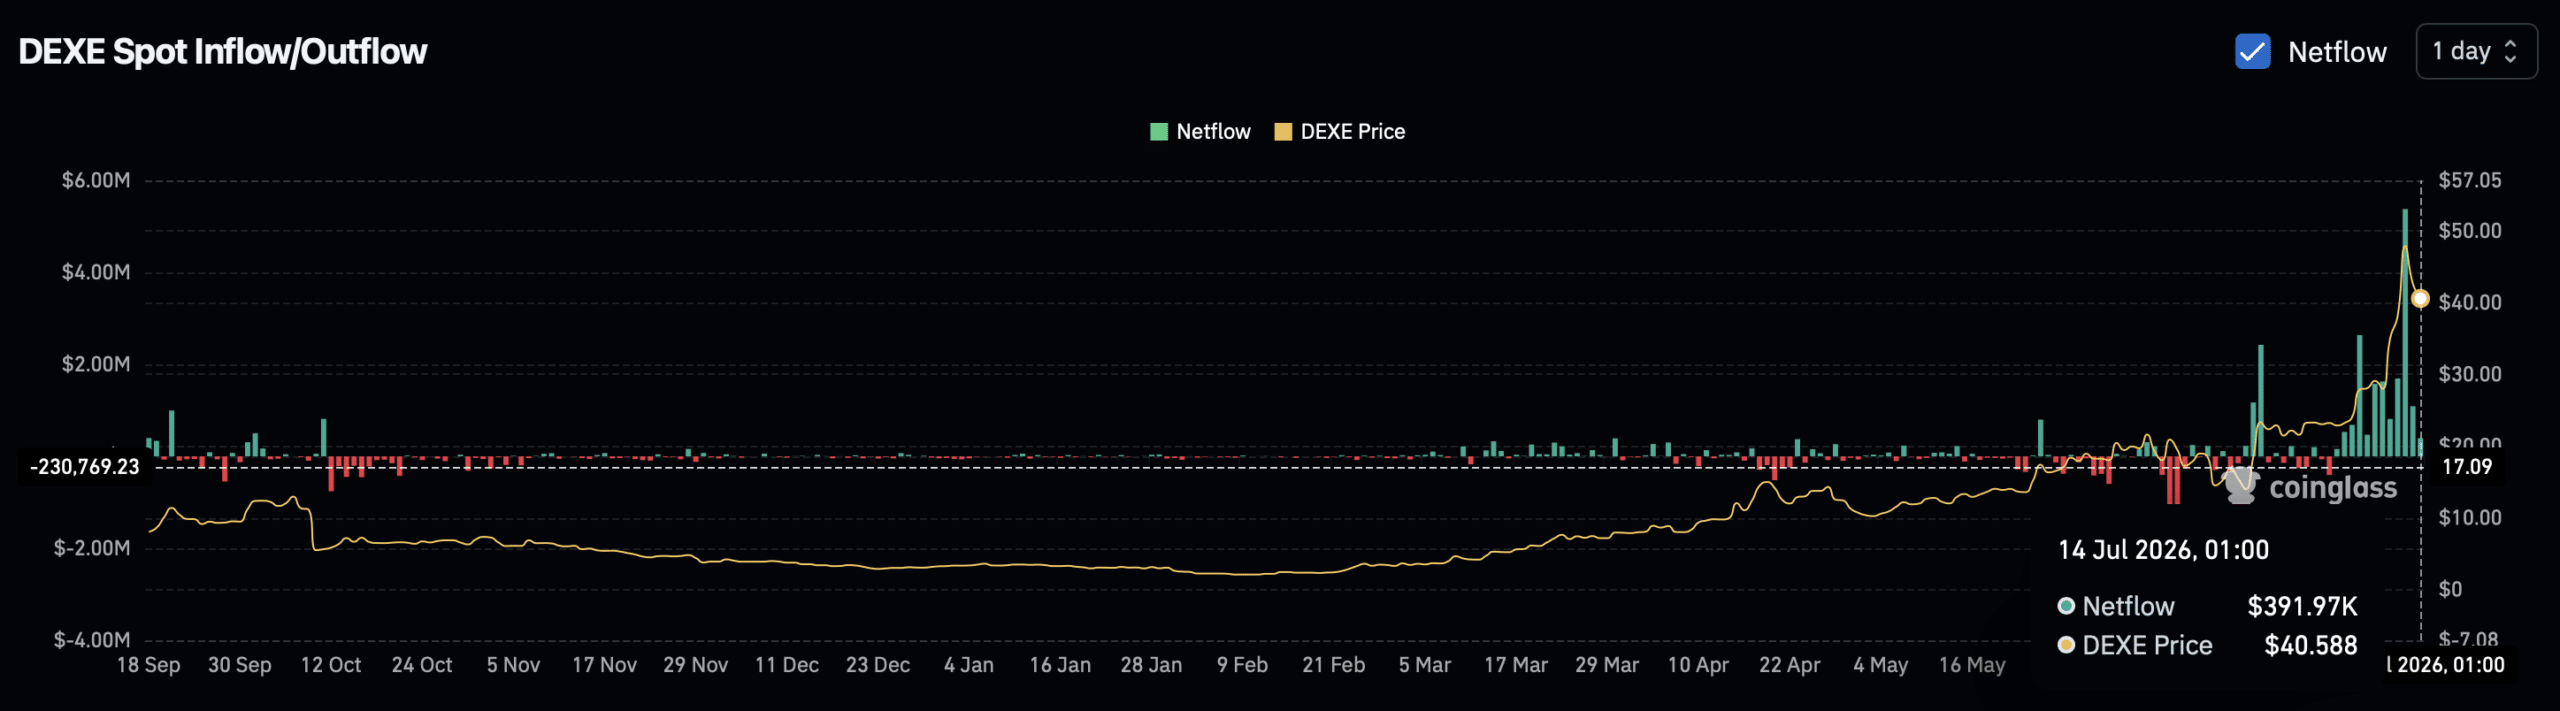
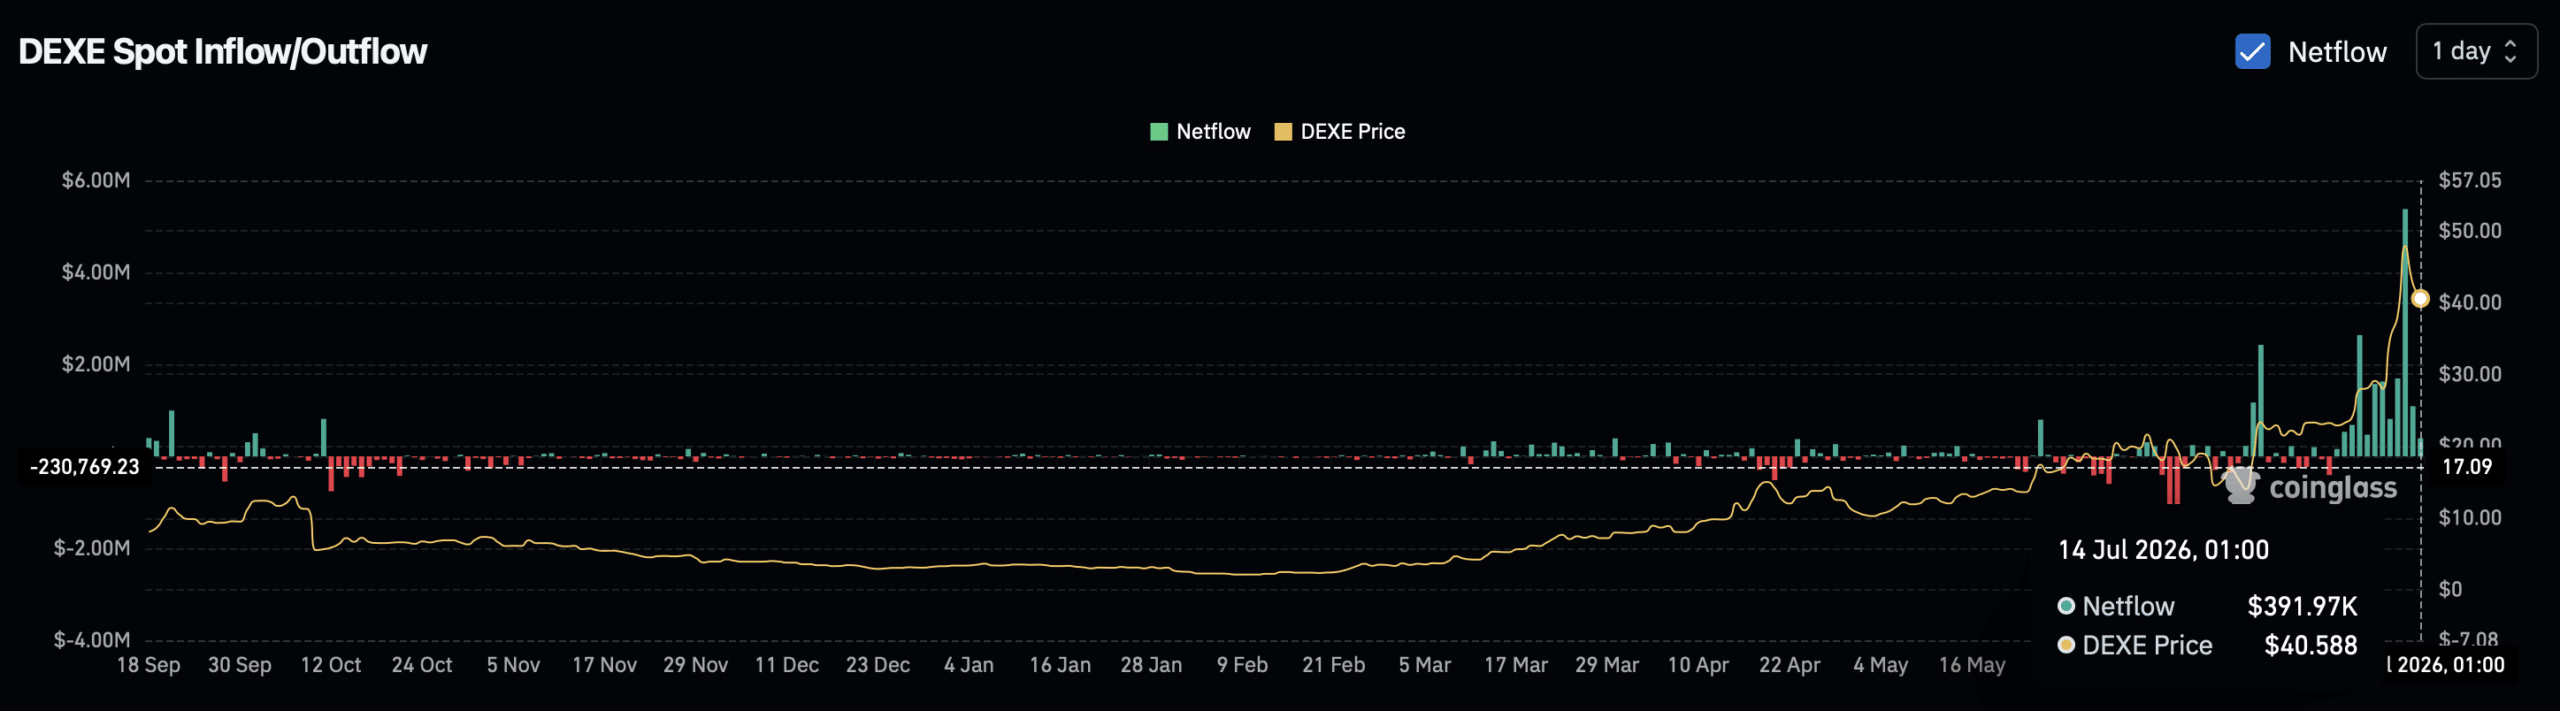
Source: CoinGlass

This matters because it shows seller strength has weakened sharply on a netflow basis while buyers step in.


Final Summary

  • DeXe has surged more than 1,000% over the past six months, and the current 13% dip looks more like profit-taking after a strong run than a shift in trend.
  • Selling has cooled sharply over the last day, with net sales down more than tenfold from the July 12 peak, a sign that buyers may be stepping back in.


热门币种推荐

相关问答

QWhat are the two key demand zones mentioned in the article that could influence DeXe's price?

AThe article mentions Demand zone 1 as the first line of support, and Demand zone 2 as a secondary cushion should selling pressure increase and break the first level.

QWhat do the doji candles (gravestone and dragonfly) observed on DeXe's chart indicate?

AThe gravestone doji indicated intense sell pressure as price attempted to rise, while the dragonfly doji signaled that bulls were stepping back in, exposing a standoff between buyers and sellers.

QWhy does the article suggest the current pullback might be temporary based on trading volume data?

AVolume decreased by 36% alongside the falling price, which often signals weak momentum behind the move and opens room for buyers to take control, suggesting a potential temporary pullback rather than a trend reversal.

QWhat is the significance of the divergence between the A/D (Accumulation/Distribution) line and the price action?

AThe A/D line was trending slightly upward even as prices fell, a divergence suggesting a modest increase in buyer activity (accumulation) during the period, indicating underlying strength.

QWhat key data point from the spot market suggests sell pressure is easing for DeXe?

ANet sales (netflow) have plunged dramatically, from $5.38 million on July 12th to just $391,000, a drop of more than tenfold, indicating seller strength has weakened sharply.

你可能也喜欢

SpaceX交易权限现已开放:WEEX上线SPCXON交易对

2026年6月,SpaceX完成了史上最大规模的IPO,但大量投资者因券商限制、开户障碍和地域壁垒而无法参与。加密货币交易所WEEX推出了解决方案SPCXON/USDT现货交易对。SPCXON是一种基于Ondo代币化股票框架构建的产品,旨在为美国以外的合格交易者提供追踪SpaceX经济收益的途径,以USDT结算,交易便捷,无传统券商门槛。 SpaceX IPO定价为135美元,首日收盘接近161美元,随后一度冲高至225美元,公司估值约1.75万亿美元。看涨理由基于星链收入增长、无可匹敌的发射频率以及星舰里程碑。看跌观点则认为,其估值已达营收的90-110倍,且存在流通股稀少和即将到来的内部持股解锁等风险。 需注意,SPCXON提供的是价格敞口,而非股票所有权,不包含投票权和直接股息。其价格可能相对净资产价值出现溢价或折价,交易者需关注价差。 WEEX平台整合了包括SpaceX、MicroStrategy和Micron在内的多种代币化股权产品,用户可在统一账户内交易加密货币和股权敞口。平台还提供高达400倍杠杆的加密货币期货交易。 WEEX成立于2018年,全球用户超过620万,提供超过1200个现货交易对,并设有1000 BTC保护基金。平台亦提供跟单交易和AI工具等功能。 免责声明:本文内容不构成投资建议。

TheNewsCrypto45分钟前

SpaceX交易权限现已开放:WEEX上线SPCXON交易对

TheNewsCrypto45分钟前

Gate 研究院:加密金融产品掀起“华尔街化”浪潮,是竞争还是融合?

2009年比特币的创世区块暗含对传统金融体系的批判,其理想是建立去中心化、去中介、去银行的点对点金融系统。然而十七年后,比特币现货ETF获批、贝莱德等巨头发行相关产品、CME推出受监管衍生品、RWA(真实世界资产)和代币化国债市场快速增长等现象,显示传统金融正系统性地介入加密资产的发行、定价、托管和分销环节,引发了加密市场是否“华尔街化”的讨论。 文章认为,这并非单方面的吞并,而是加密体系与传统金融的双向融合与互补。加密领域提供无许可开放性、24小时交易和可编程结算,但缺乏合规通道、机构级托管和主流分销网络;传统金融则拥有牌照、信任、资金和渠道,但受限于交易时间、跨境门槛和结算效率。双方正朝彼此的核心优势靠拢。 这种融合体现为两条路径:一是以Gate为代表的加密交易所,逐步从提供代币化美股、CFD差价合约,发展到接入真实股票、港股、韩股交易,成为连接加密账户与传统券商基础设施的前端入口;二是以Robinhood为代表的传统券商,通过收购加密交易所、推出股票代币和建设自有Layer 2,将加密资产和链上代币化产品整合进其平台。两者的共同目标是争夺下一代综合金融账户的入口,让用户在一个界面内交易多种资产。 同时,RWA和链上国债作为资产层的融合正在加速。尽管规模尚小,但代币化国债等产品为链上提供了低波动收益资产,并吸引JP摩根、贝莱德等传统机构参与,测试未来资本市场的底层结算方式。 最终,加密与华尔街并非谁征服谁,而是在共同塑造一个更高效、全球化的统一资本市场。用户未来或将在同一个账户中自由交易比特币、股票、ETF、链上国债等多种资产,体验无缝的跨资产配置。去中心化的理想仍在底层协议中延续,而在应用层,一个融合了双方优势的新金融形态正在形成。

marsbit1小时前

Gate 研究院:加密金融产品掀起“华尔街化”浪潮,是竞争还是融合?

marsbit1小时前

交易

现货

热门文章

如何购买DEXE

欢迎来到HTX.com!我们已经让购买DeXe(DEXE)变得简单而便捷。跟随我们的逐步指南,放心开始您的加密货币之旅。第一步:创建您的HTX账户使用您的电子邮件、手机号码注册一个免费账户在HTX上。体验无忧的注册过程并解锁所有平台功能。立即注册第二步:前往买币页面,选择您的支付方式信用卡/借记卡购买:使用您的Visa或Mastercard即时购买DeXe(DEXE)。余额购买:使用您HTX账户余额中的资金进行无缝交易。第三方购买:探索诸如Google Pay或Apple Pay等流行支付方法以增加便利性。C2C购买:在HTX平台上直接与其他用户交易。HTX场外交易台(OTC)购买:为大量交易者提供个性化服务和竞争性汇率。第三步:存储您的DeXe(DEXE)购买完您的DeXe(DEXE)后,将其存储在您的HTX账户钱包中。您也可以通过区块链转账将其发送到其他地方或者用于交易其他加密货币。第四步:交易DeXe(DEXE)在HTX的现货市场轻松交易DeXe(DEXE)。访问您的账户,选择您的交易对,执行您的交易,并实时监控。HTX为初学者和经验丰富的交易者提供了友好的用户体验。

1.2k人学过发布于 2024.04.16更新于 2026.06.02

如何购买DEXE

相关讨论

欢迎来到HTX社区。在这里,您可以了解最新的平台发展动态并获得专业的市场意见。以下是用户对DEXE(DEXE)币价的意见。

活动图片












