The $75 line in the sand: Hyperliquid approaches a key decision point

ambcrypto发布于2026-07-03更新于2026-07-03

文章摘要

Bitcoin and most altcoins have been in a downtrend since October 2025, with recent gains seen as minor bounces. However, Hyperliquid (HYPE), a large-cap DEX token, has maintained a strong long-term bullish trend for over a year. Trading around $70.11, it was up 74% annually. On the weekly chart, the RSI shows potential for a bearish divergence if prices push past $72.1. Currently, HYPE trades within a one-month range of $53.35 to $74.78, having recently moved above key resistance levels. Despite some whale profit-taking, steady buying pressure, a rising OBV, and an RSI above 50 suggest upside momentum toward the critical $75 supply zone. For swing traders, the optimal risk/reward entry is not yet present. The key action will be a decisive breakout above or a bearish rejection from $75, which would signal the next major directional move.

Since October 2025, Bitcoin [BTC] and most of the altcoins have been trending downward. Many alts, even prominent ones, never really got a long-term uptrend going. The price gains in the past couple of days for BTC and other tokens were only a bounce within a downtrend.

Hyperliquid [HYPE] was one of the large-cap tokens whose long-term trend was firmly bullish.
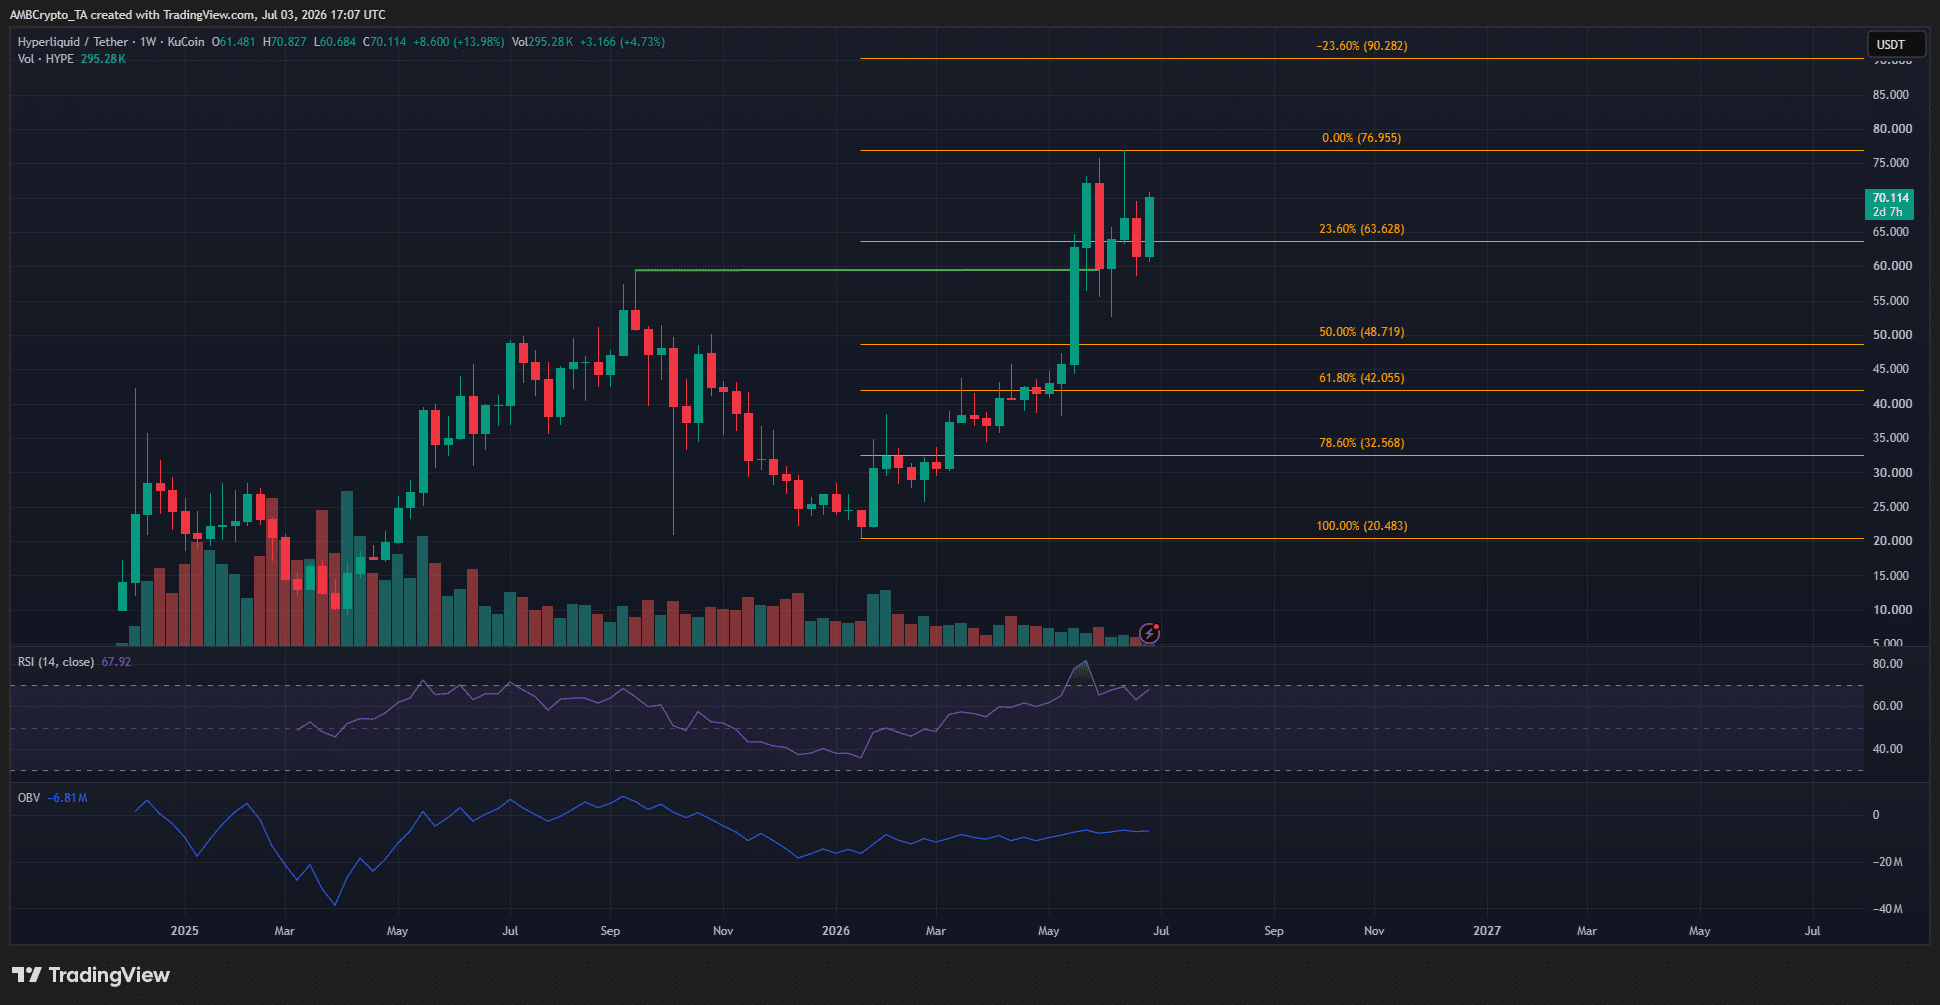
Source: HYPE/USDT on TradingView

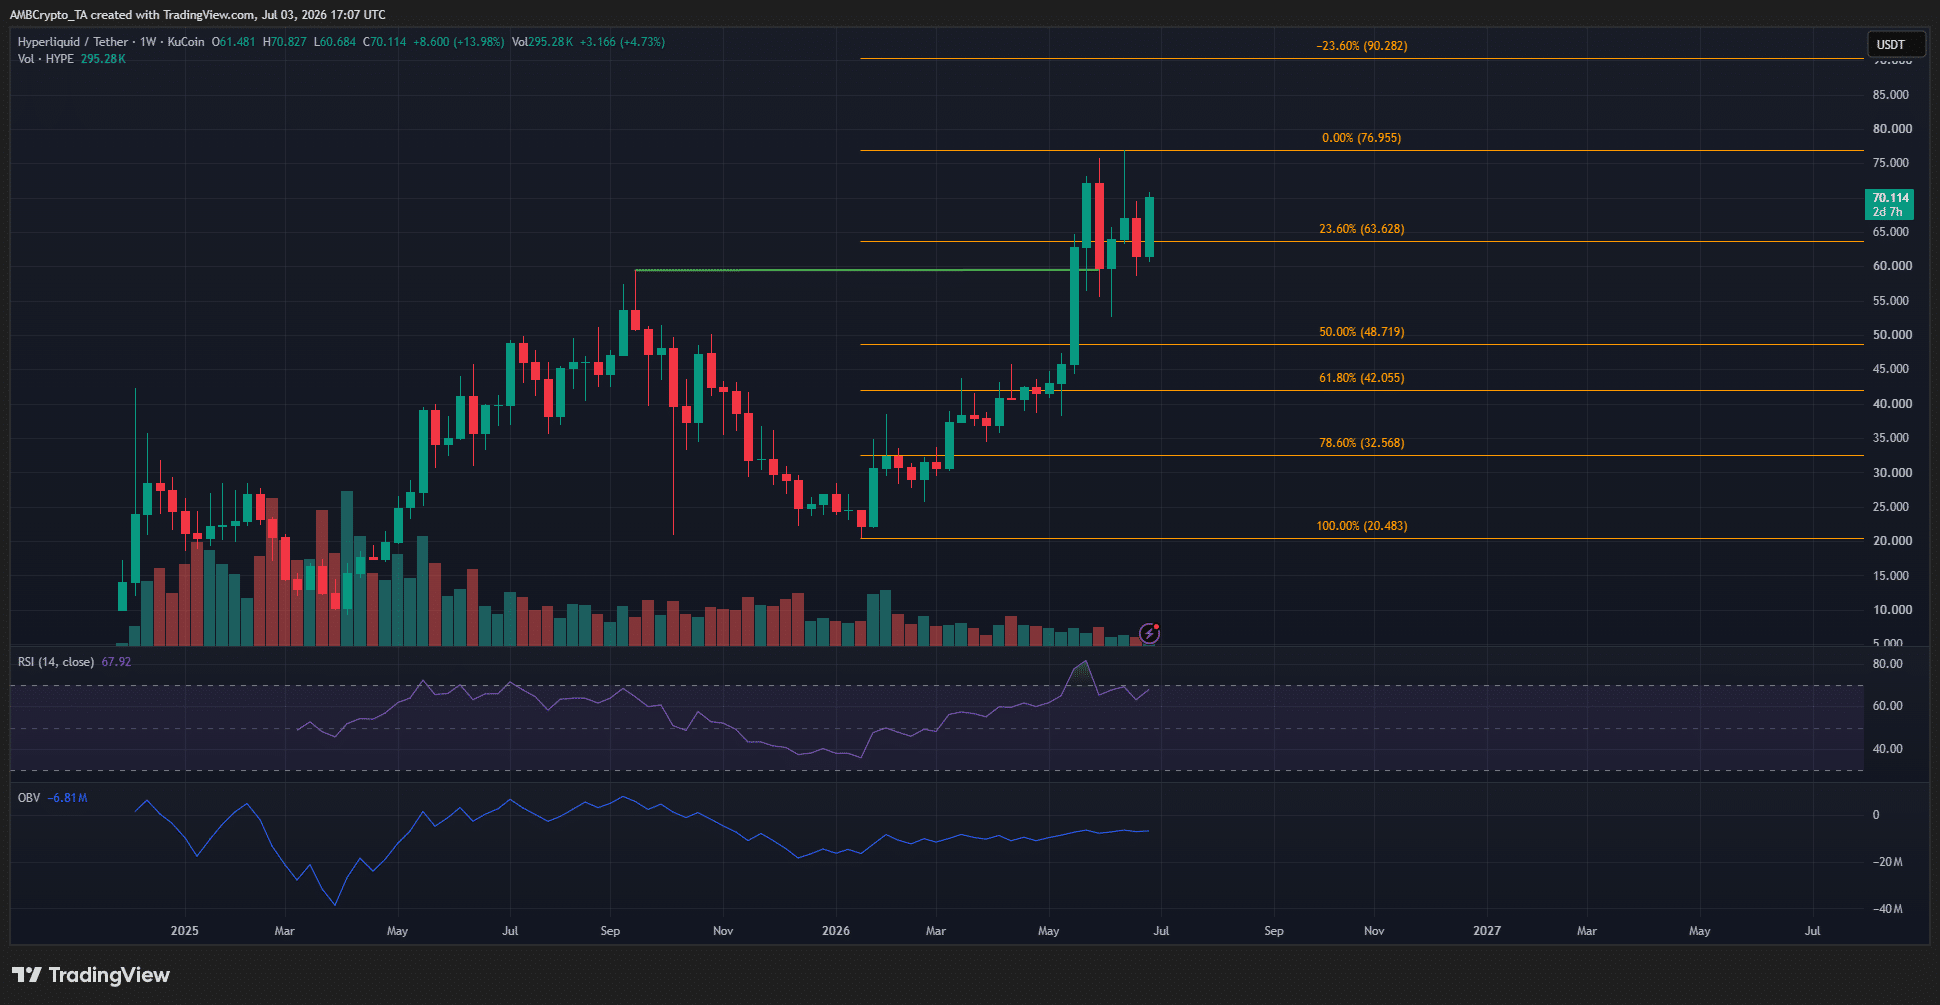
As the 1-week chart above highlights, the swing structure has been bullish for more than a year. It was trading at $70.11, and was up 7.51% in the past week and over 74% up in a year.

This cemented the long-term bullish trend, but the RSI was forming lower highs in recent weeks while HYPE bulls tried to push prices to new highs. Hence, a weekly session move beyond $72.1 would present a bearish divergence, though it doesn’t guarantee an immediate correction.

Here’s what traders and investors can expect from Hyperliquid token’s price action.

HYPE price prediction for July
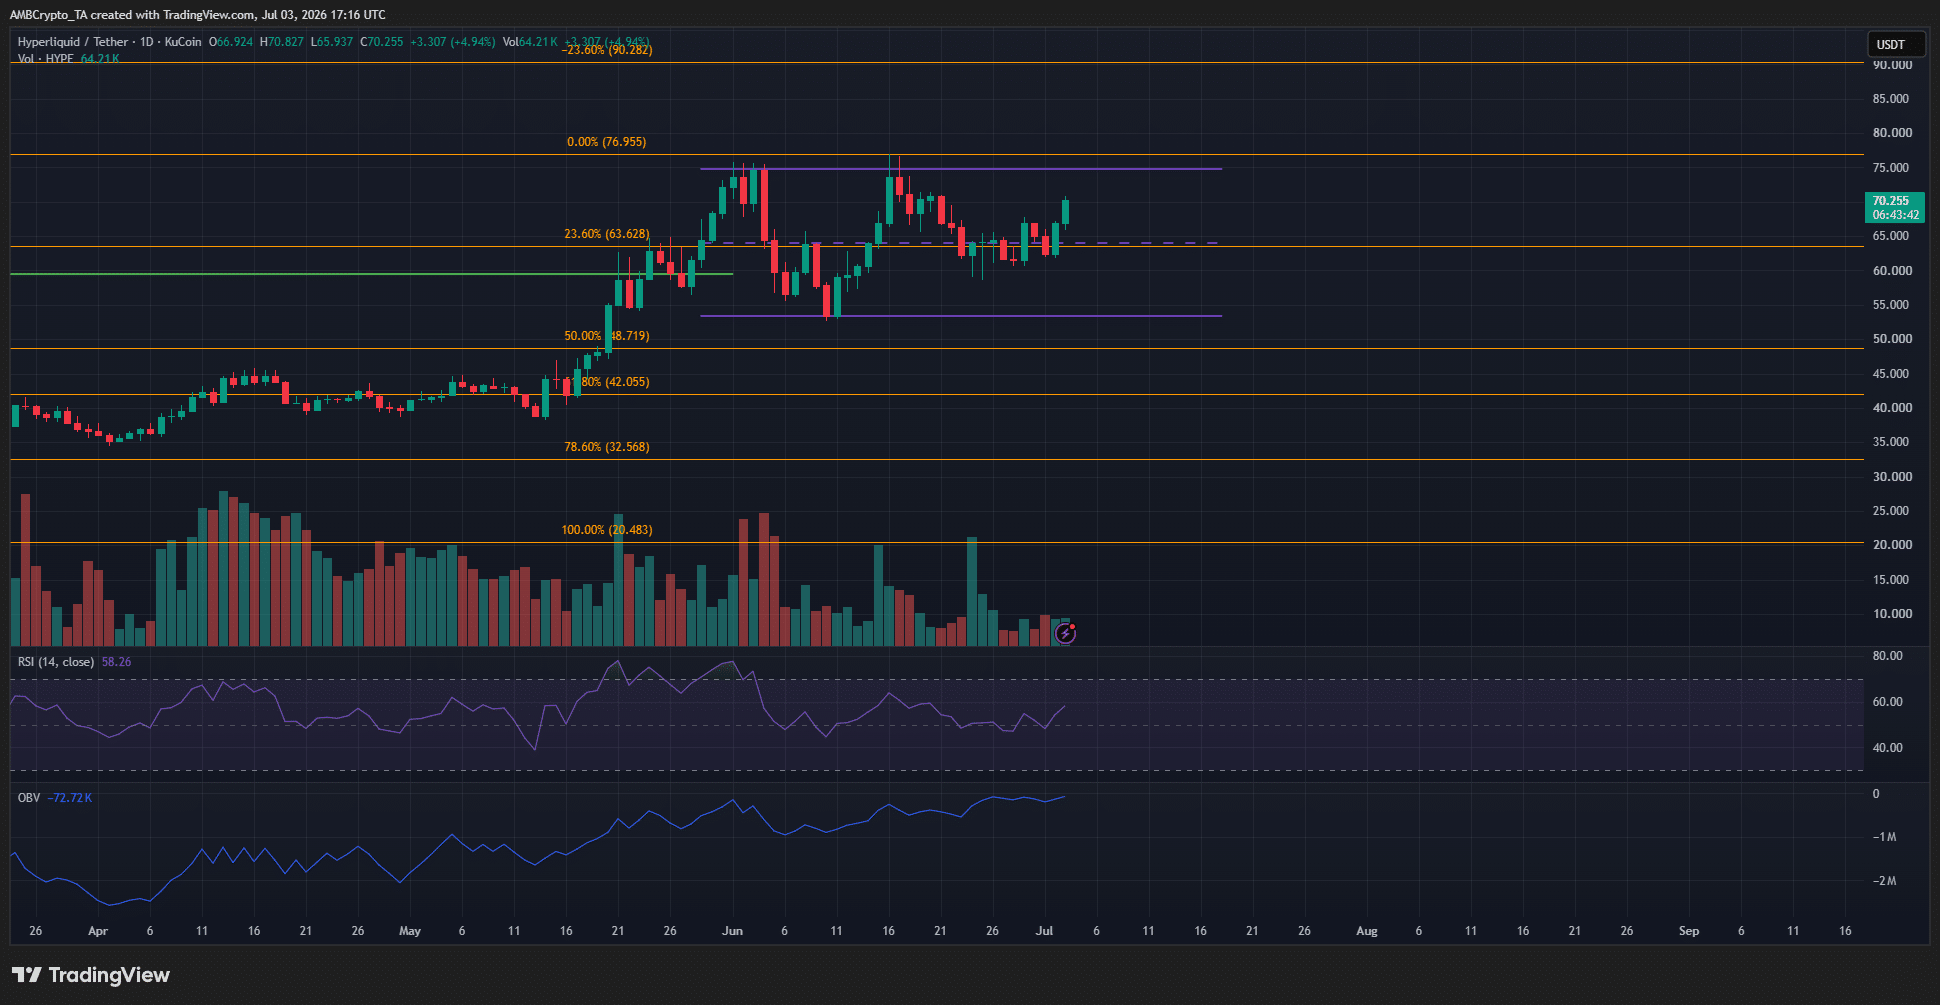
Source: HYPE/USDT on TradingView

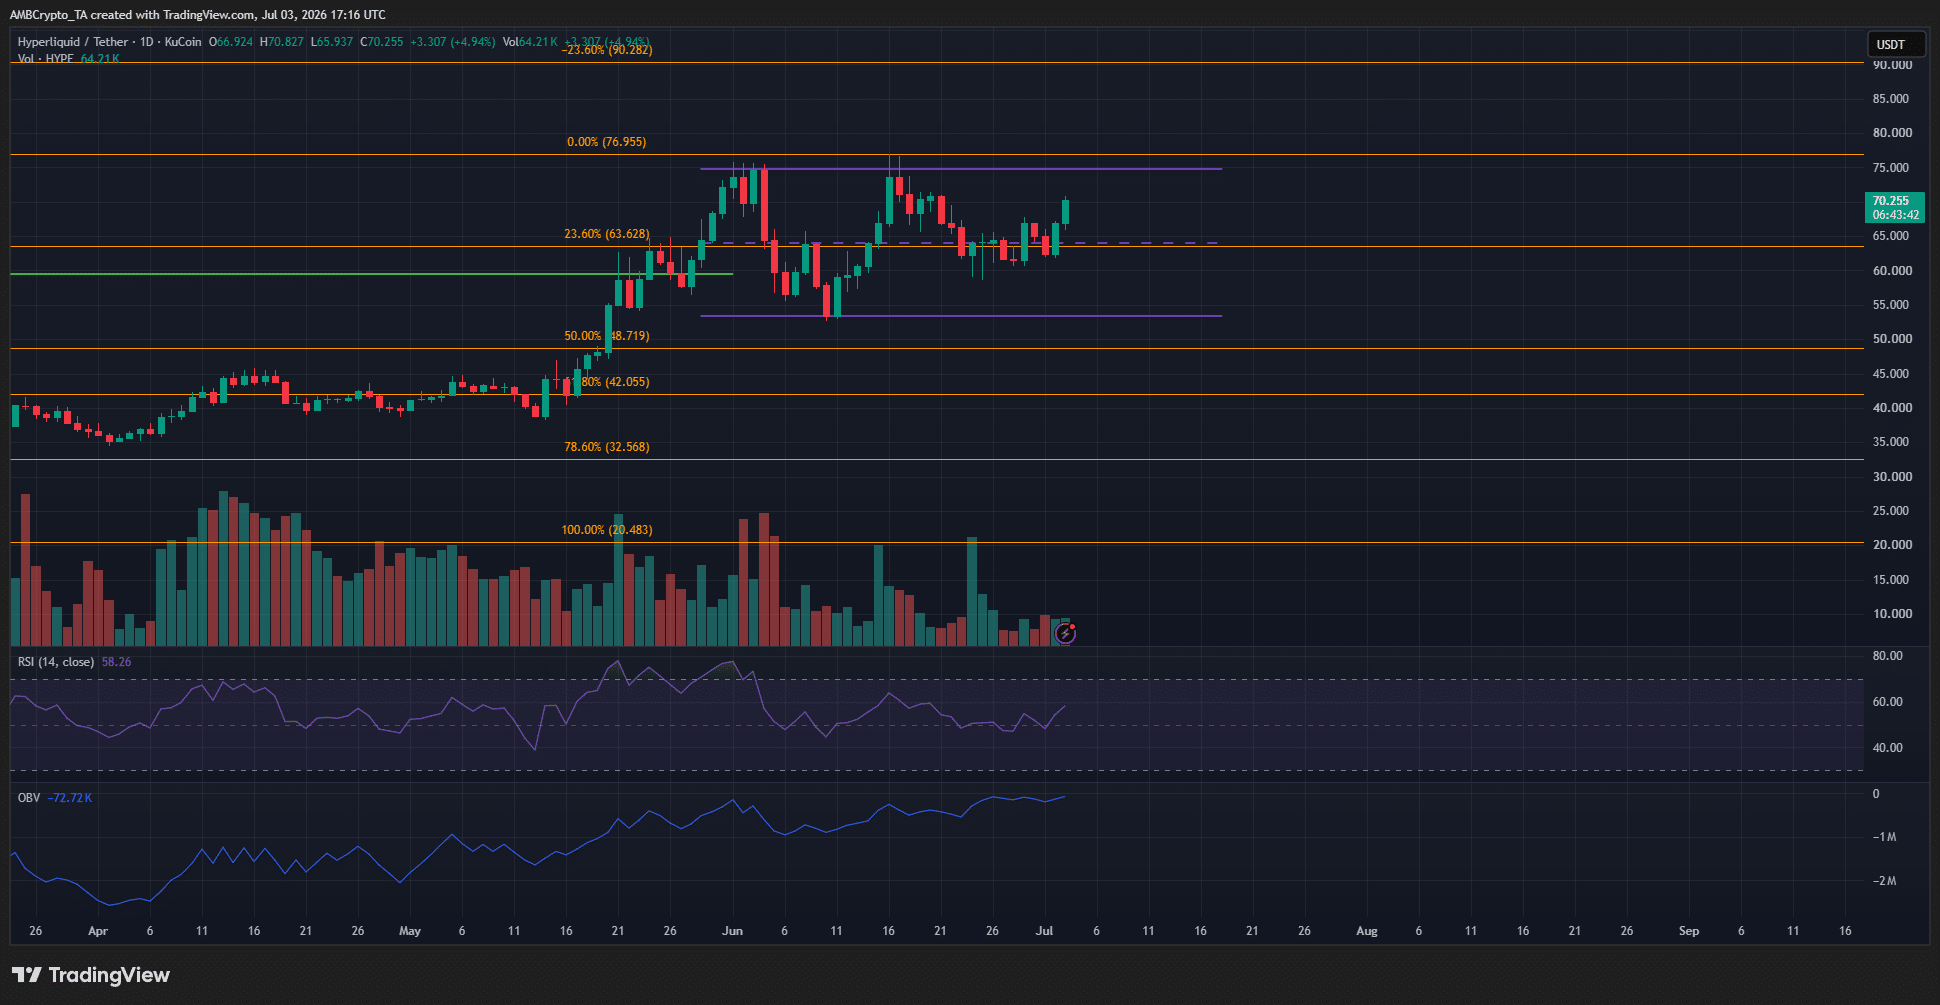
Over the past month of trading, the DEX token has formed a range [purple] between $53.35 and $74.78. At the time of writing, the price was above the mid-range resistance at $64.1 and also the short-term resistance zone at $67.2.

This upward push came despite some profit-taking by whales. The selling was being absorbed by the demand in the market.

Combined with the recent bullish momentum for Bitcoin, it appeared likely that HYPE can continue higher toward $75.

The OBV was climbing steadily, and the RSI remained above neutral 50. Together, they signaled steady buying pressure and intact bullish momentum.

Traders’ call to action- Wait
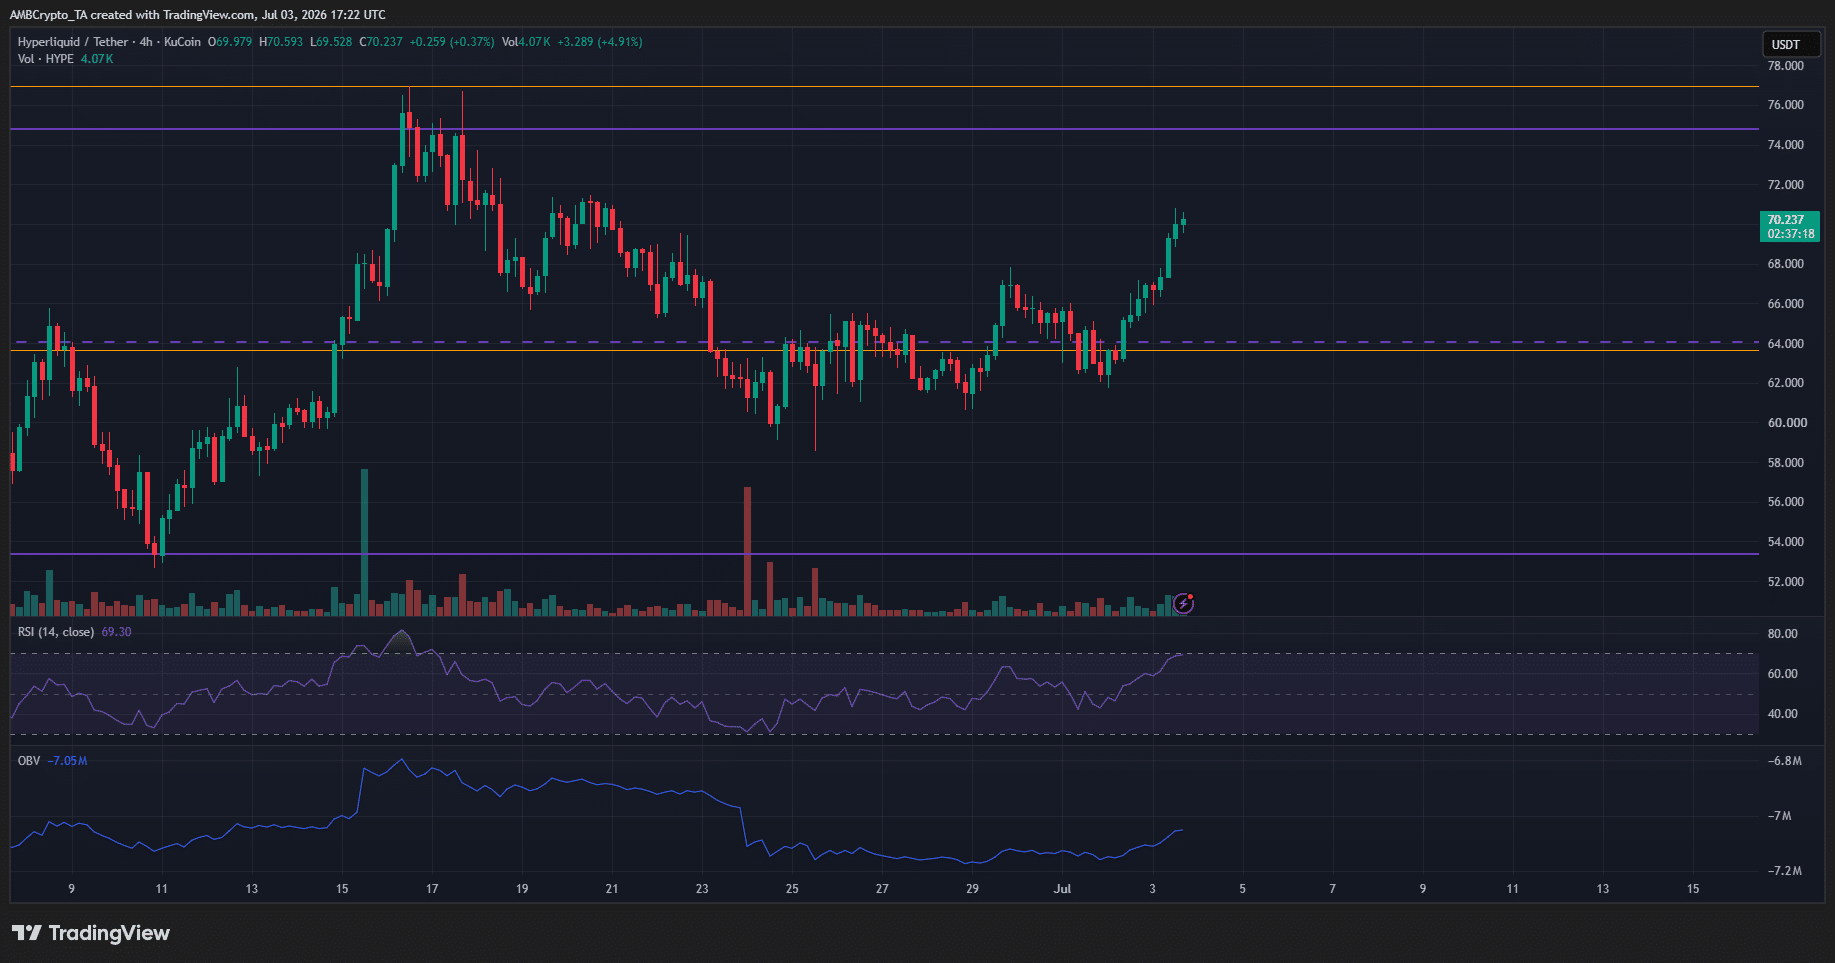
Source: HYPE/USDT on TradingView

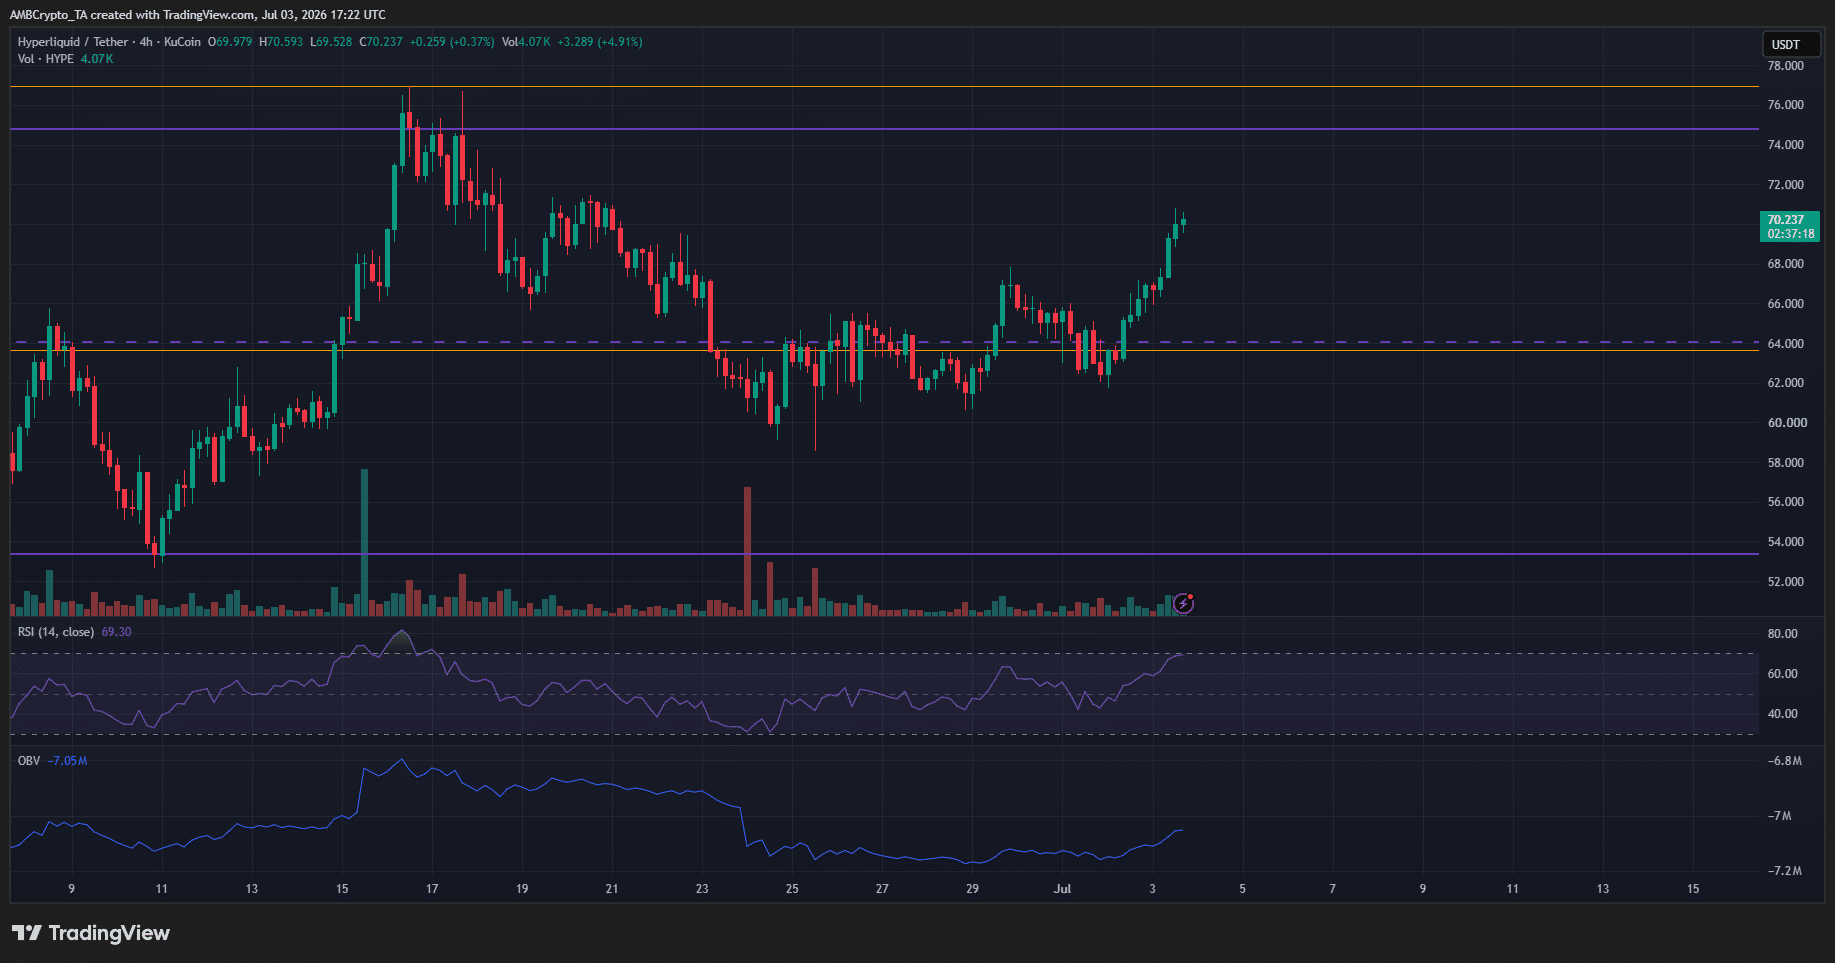
The range formation needs to be cleared for the next decisive higher timeframe move. Within this range, a test of either extreme can offer swing traders an opportunity to enter.

Right now, this opportunity was not at hand. The risk-to-reward was not ideal for swing traders at the time of writing.

The technical indicators favored short-term upside. Therefore, a move toward the $75 supply zone and a bearish reaction from there can be used to sell the token, targeting the mid-range and range-low support levels.


Final Summary

  • Hyperliquid was one of the only large-cap crypto assets that maintained a long-term bullish trend.
  • The $75 supply zone was vital for swing traders. A breakout past, or a rejection from, this area would be a signal for traders to place directional bets.


热门币种推荐

相关问答

QWhat is the key price level for Hyperliquid (HYPE) mentioned in the article, and why is it significant for traders?

AThe key price level is $75. It is a significant supply zone. A breakout above this level or a rejection from it would signal traders to place directional bets, as it would help determine the next decisive move for the token's price.

QWhat has been the overall long-term trend for Hyperliquid (HYPE), and how does it differ from most other altcoins mentioned?

AHyperliquid (HYPE) has maintained a firmly bullish long-term trend for over a year. This contrasts with most other altcoins, which have been trending downward since October 2025 and never really established a sustained uptrend.

QAccording to the article, what do the On-Balance Volume (OBV) and RSI indicators suggest about HYPE's current market momentum?

AThe On-Balance Volume (OBV) is climbing steadily, and the Relative Strength Index (RSI) remains above the neutral level of 50. Together, these indicators signal steady buying pressure and intact bullish momentum for HYPE in the short term.

QWhat trading range has HYPE formed over the past month, and what are its key support and resistance levels?

AOver the past month, HYPE has formed a trading range between $53.35 (range-low support) and $74.78. Key levels within this range include the mid-range resistance at $64.1 and a short-term resistance zone at $67.2.

QWhat is the article's primary recommendation for traders regarding HYPE at the time of writing, and why?

AThe primary recommendation for traders is to wait. The article states that the risk-to-reward ratio is not ideal for swing traders at the current moment. It suggests waiting for a move toward the $75 supply zone and observing the market's reaction (breakout or rejection) to place a trade.

你可能也喜欢

交易

现货

热门文章

如何购买SAND

欢迎来到HTX.com!我们已经让购买The Sandbox(SAND)变得简单而便捷。跟随我们的逐步指南,放心开始您的加密货币之旅。第一步:创建您的HTX账户使用您的电子邮件、手机号码注册一个免费账户在HTX上。体验无忧的注册过程并解锁所有平台功能。立即注册第二步:前往买币页面,选择您的支付方式信用卡/借记卡购买:使用您的Visa或Mastercard即时购买The Sandbox(SAND)。余额购买:使用您HTX账户余额中的资金进行无缝交易。第三方购买:探索诸如Google Pay或Apple Pay等流行支付方法以增加便利性。C2C购买:在HTX平台上直接与其他用户交易。HTX场外交易台(OTC)购买:为大量交易者提供个性化服务和竞争性汇率。第三步:存储您的The Sandbox(SAND)购买完您的The Sandbox(SAND)后,将其存储在您的HTX账户钱包中。您也可以通过区块链转账将其发送到其他地方或者用于交易其他加密货币。第四步:交易The Sandbox(SAND)在HTX的现货市场轻松交易The Sandbox(SAND)。访问您的账户,选择您的交易对,执行您的交易,并实时监控。HTX为初学者和经验丰富的交易者提供了友好的用户体验。

940人学过发布于 2024.03.29更新于 2026.06.02

如何购买SAND

相关讨论

欢迎来到HTX社区。在这里,您可以了解最新的平台发展动态并获得专业的市场意见。以下是用户对SAND(SAND)币价的意见。

活动图片