Bitcoin Price Could See Another Crash, But What Is The Long-Term Prognosis?

bitcoinist发布于2026-04-20更新于2026-04-20

文章摘要

Bitcoin recently surpassed $78,000, reigniting bullish sentiment and expectations of reaching six figures. However, analyst Behdark warns of a potential price crash before any sustained recovery. He suggests current optimism may be misleading, possibly a tactic by market makers to attract buyers before a downturn. Technical analysis indicates bearish patterns, such as a triangle or diamagnetic formation, signaling a likely decline. Key resistance levels to watch are $77,000 and $80,552, where a reversal may occur. If a correction happens, support levels are identified near $72,800, $67,885, and $67,677, with a break below possibly leading to a further 10% drop. The long-term outlook remains above the $60,000 cycle support, suggesting eventual recovery after a short-term dip.

With the Bitcoin price clearing $78,000 last week, it has triggered bullish sentiment in the crypto market once again. This move has also led to forecasts that the Bitcoin price is headed back for the 6-figure mark. However, not everyone is following this school of thought and believes that the rally will continue. Crypto analyst Behdark has debunked the bullish predictions, forecasting that the cryptocurrency’s price is actually headed lower before recovering.

How Low Will The Bitcoin Price Go?

Despite the increase in price, the crypto analyst has predicted that it is likely that the Bitcoin price crashes first from here. The bullish sentiment in the market, Behdark believes could be misleading for investors, as this could be a deliberate ploy by market makers to actually get the most people involved before crashing the price again.

As the analyst explains, the underlying Bitcoin structure is still very bearish, especially given the fact that the digital asset looks to be forming a triangle or diamagnetic pattern. The latter is a complex corrective pattern, meaning that it can often be clouded in recoveries before crashing down further again.

In either case, both of these patterns point to a high possibility that the Bitcoin price would go down first before up. Thus, it is likely that there would be opportunities to buy the cryptocurrency lower before eventually waiting for the run-up.

Source: TradingView

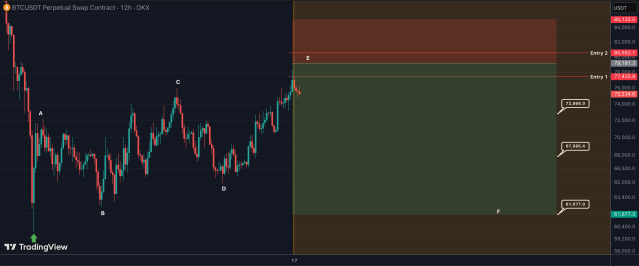
With this, the crypto analyst has identified the major levels that investors should watch out for that could be the best time to actually short the cryptocurrency. Mainly, two levels are of the most interest as these are where the bears could make their stand in terms of establishing resistance.

The first of these is just above $77,000 as the price continues to struggle with declining momentum. Next is the $80,552 level, where there is likely the most resistance to the current rally, thus making them the points that could trigger a downward corrective move.

Once the decline begins, then the first stop would be just above $72,800 for the first support level. Next is the $67,885 level for better support, but a break of this would eventually lead to another 10% crash. The last major level is $67,677, which still lies above the established cycle support of $60,000.

BTC price falls again | Source: BTCUSD on Tradingview.com

相关问答

QWhat is the main argument presented by crypto analyst Behdark regarding the current Bitcoin rally?

ABehdark argues that the current Bitcoin rally is misleading and could be a deliberate ploy by market makers to attract investors before crashing the price again, as the underlying structure remains bearish with patterns suggesting a downward correction is likely.

QWhat two price levels does Behdark identify as potential resistance points that could trigger a downward move?

AThe two resistance levels identified are just above $77,000, where momentum is declining, and $80,552, which is expected to offer the strongest resistance to the current rally.

QAccording to the analysis, what are the key support levels if Bitcoin's price begins to fall?

AThe first support level is just above $72,800, followed by $67,885. A break below $67,885 could lead to a 10% crash, with the last major support at $67,677, which is above the cycle support of $60,000.

QWhat pattern does Behdark suggest Bitcoin is forming, and what does it indicate?

ABehdark suggests Bitcoin is forming a triangle or diamagnetic pattern, which is a complex corrective pattern often marked by false recoveries before further declines, indicating a high probability of price dropping before rising again.

QWhat is the long-term prognosis for Bitcoin after the potential crash mentioned in the article?

AThe long-term prognosis implies that after the potential crash, there will be opportunities to buy Bitcoin at lower prices before eventually expecting a run-up, indicating eventual recovery and growth despite short-term bearish outlook.

你可能也喜欢

交易

现货
合约

热门文章

加密市场宏观研报:《GENIUS Act》法案取得重大进展,BTC突破历史新高,后市全新展望

2025年5月22日,比特币价格正式突破11万美元大关,创下历史新高。在政策面、宏观经济、资金面与投资者结构共同作用下,一场结构性牛市浪潮正在展开。而此轮上涨背后的核心驱动,是美国《GENIUS稳定币法案》的实质性进展以及多项利好的叠加。本文将从政策端突破、宏观环境转向、链上与ETF资金结构、交易行为演化,以及重点受益赛道五大维度,全面解析此轮BTC再创新高的深层逻辑,并前瞻下半年市场的潜在趋势。

1.4k人学过发布于 2025.05.22更新于 2025.05.22

加密市场宏观研报:《GENIUS Act》法案取得重大进展,BTC突破历史新高,后市全新展望

相关讨论

欢迎来到HTX社区。在这里,您可以了解最新的平台发展动态并获得专业的市场意见。以下是用户对BTC(BTC)币价的意见。

活动图片