Excerpt
Bitcoin’s struggle below key cost-basis levels reflects fading demand and continued long-term holder distribution. While volatility has cooled and options positioning looks balanced, the market’s calm now hinges on the Fed meeting expectations, and any hawkish surprise could reignite volatility.
Executive Summary
- Bitcoin’s weekend rebound from the $107K–$118K supply cluster mirrored previous post-ATH relief rallies, but sustained sell pressure from long-term holders has limited follow-through.
- The market continues to struggle above the short-term holders’ cost basis (~$113K), a critical battleground between bull and bear momentum. Failure to reclaim this level raises the risk of deeper retracement toward the Active Investors’ Realized Price (~$88K).
- Short-term holders are exiting at a loss, while long-term holders remain heavy net distributors (~–104K BTC/month), signaling waning conviction and ongoing supply absorption.
- Implied volatility has cooled sharply after October’s crash, with skew flattening and options flows reflecting controlled upside and measured downside hedging.
- The current calm in volatility hinges on the Federal Reserve’s next decision. A dovish outcome would preserve stability, but any hawkish surprise could reignite volatility and downside protection demand
On-chain Insights
A Familiar Rebound Pattern
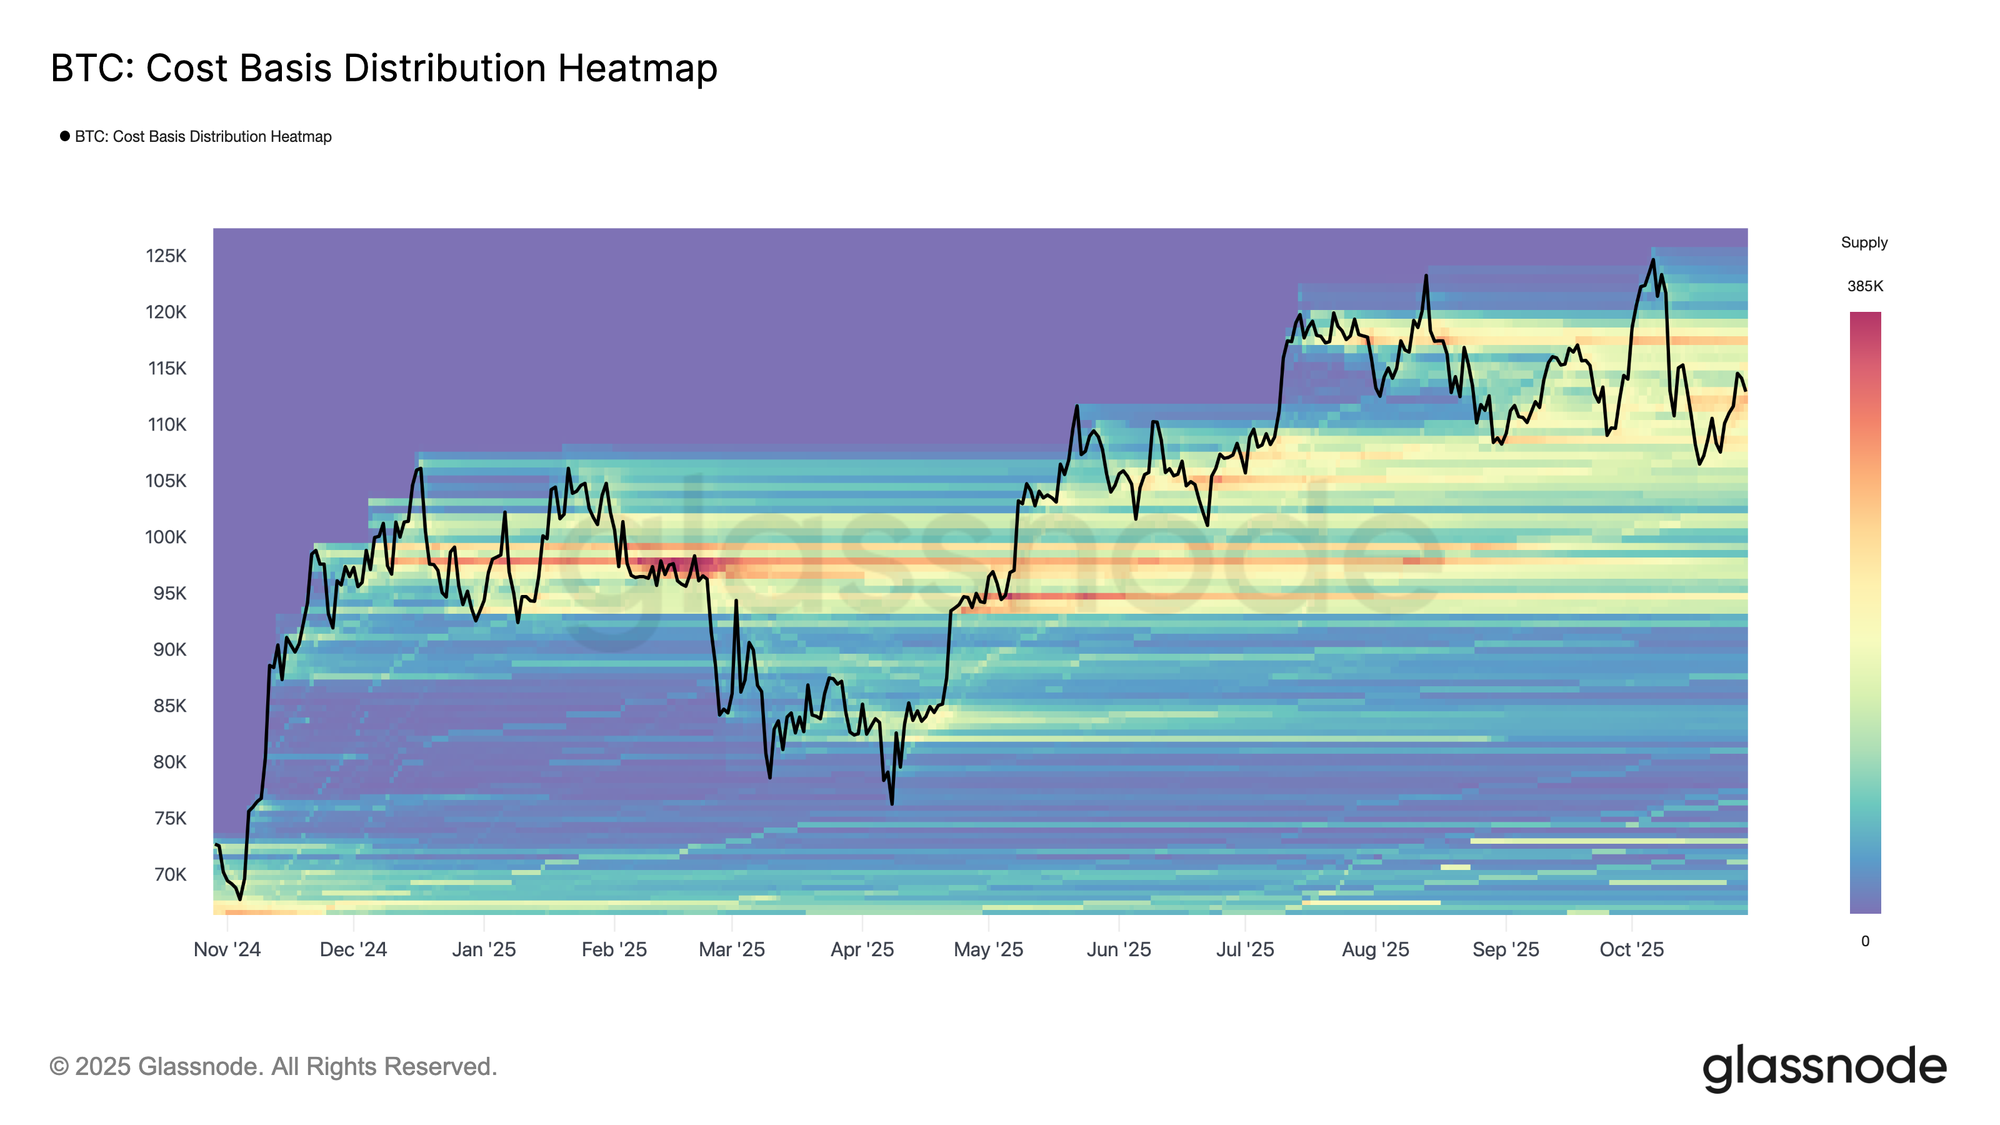
Over the weekend, Bitcoin staged a short-lived recovery after briefly dipping to the lower boundary of the top-buyers’ supply cluster, spanning $107K–$118K. According to the Cost Basis Distribution Heatmap, the price rebounded from the midline near $116K before retracing to around $113K.
This structure closely mirrors the post-ATH bounce patterns observed in Q2–Q3 2024 and Q1 2025, where temporary rallies emerged as demand was quickly absorbed by overhead supply. In the current instance, renewed selling from long-term holders has further amplified resistance at this supply zone, highlighting how profit-taking at elevated levels continues to cap upward momentum.
Struggling to Hold the Line
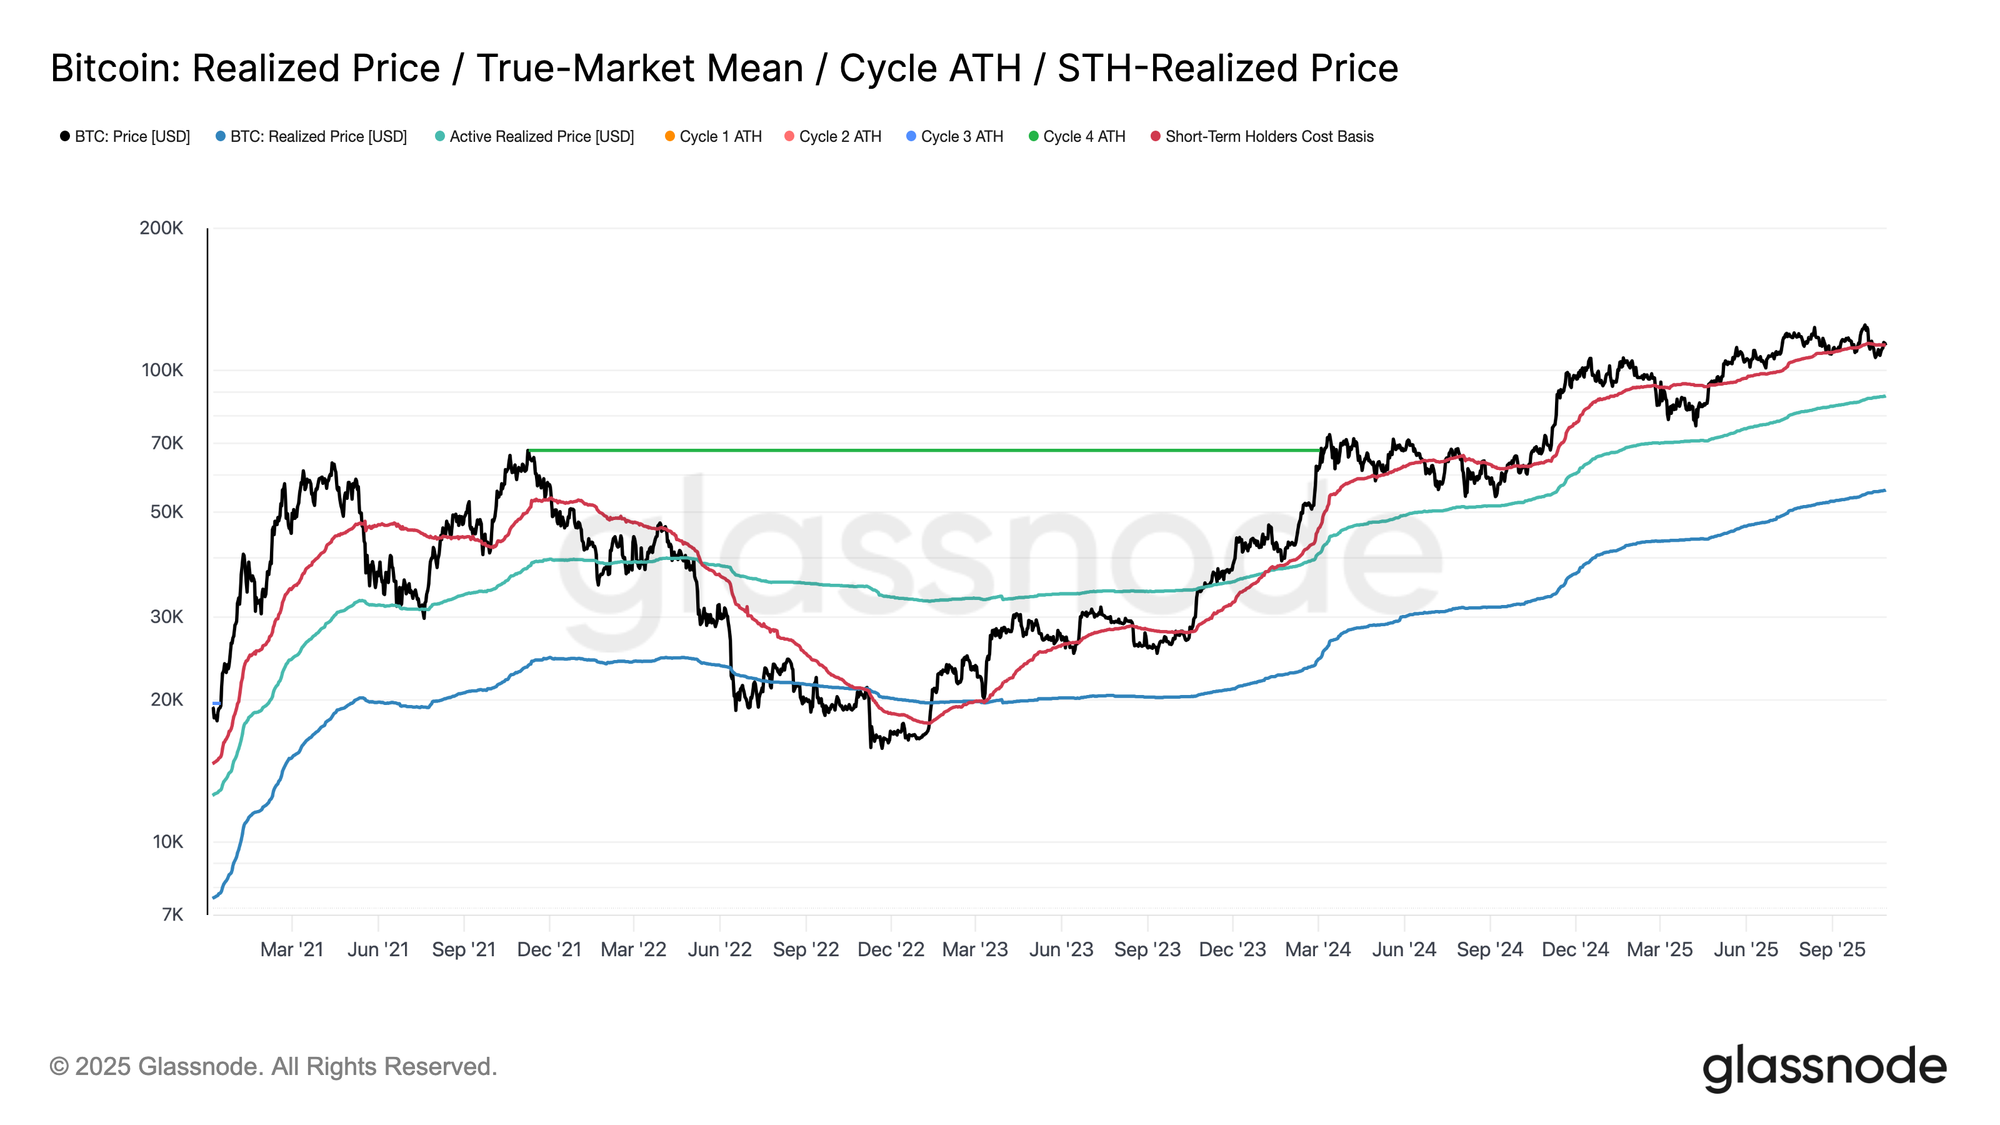
Following the weekend rebound, Bitcoin briefly reclaimed the short-term holders’ cost basis near $113.1K, a level often regarded as the dividing line between bullish and bearish momentum. Sustaining this threshold typically signals that demand is strong enough to absorb ongoing sell pressure. However, failure to remain above it, especially after spending six months consistently trading higher, suggests that demand is waning.
Over the past two weeks, Bitcoin has struggled to close a weekly candle above this key level, raising the risk of further weakness ahead. Should this phase persist, the next significant support lies around the Active Investors’ Realized Price at $88K, a metric that reflects the cost basis of actively circulating supply and often marks deeper corrective phases in prior cycles.
Short-term Holder Pressure
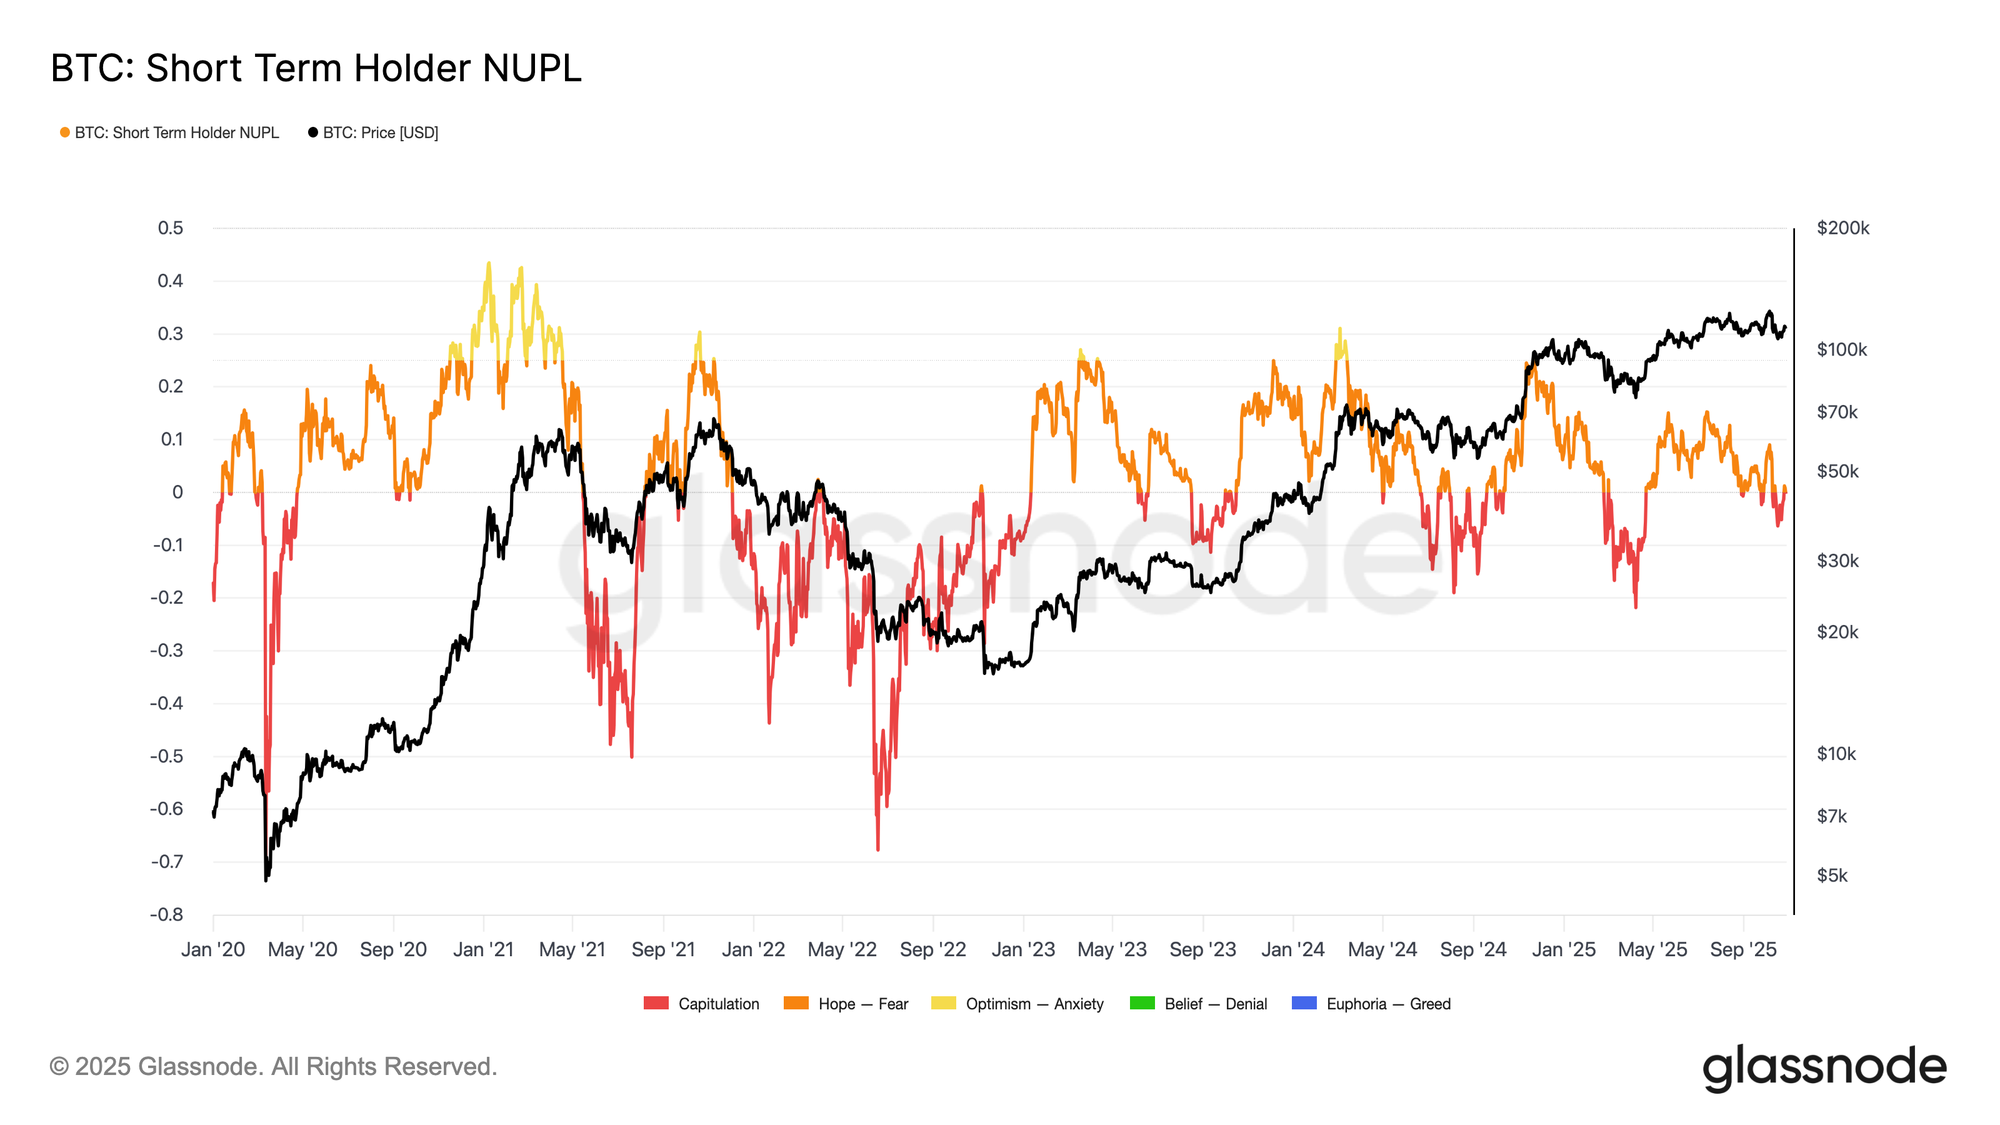
Extending the analysis to investor sentiment, further market weakness would likely be driven by short-term holders—the top buyers now exiting at a loss. The Short-Term Holder Net Unrealized Profit/Loss (STH-NUPL) metric helps gauge this stress by measuring unrealized profit or loss as a share of market cap.
Historically, deep negative values have coincided with capitulation phases that precede market bottom formation intervals. The recent drawdown to $107K pushed STH-NUPL to –0.05, a mild loss compared to the –0.1 to –0.2 range typical of mid-bull corrections, or below –0.2 during deep bear market lows.
As long as Bitcoin trades within the $107K–$117K top-buyer cluster, the market remains in a delicate balance, not yet in full capitulation, but with time working against the bulls as conviction continues to erode.
Long-Term Holders Distribution
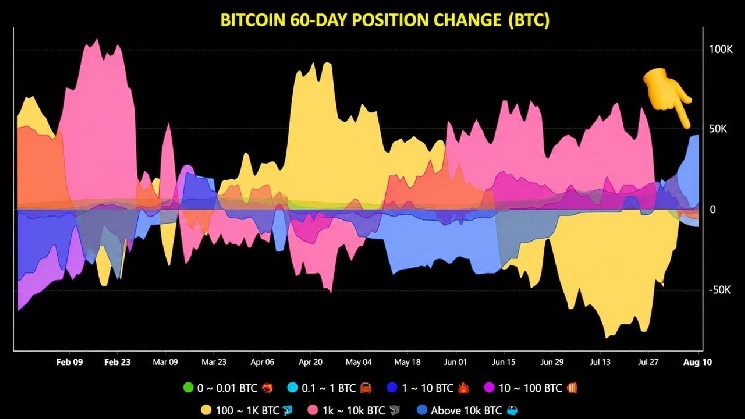
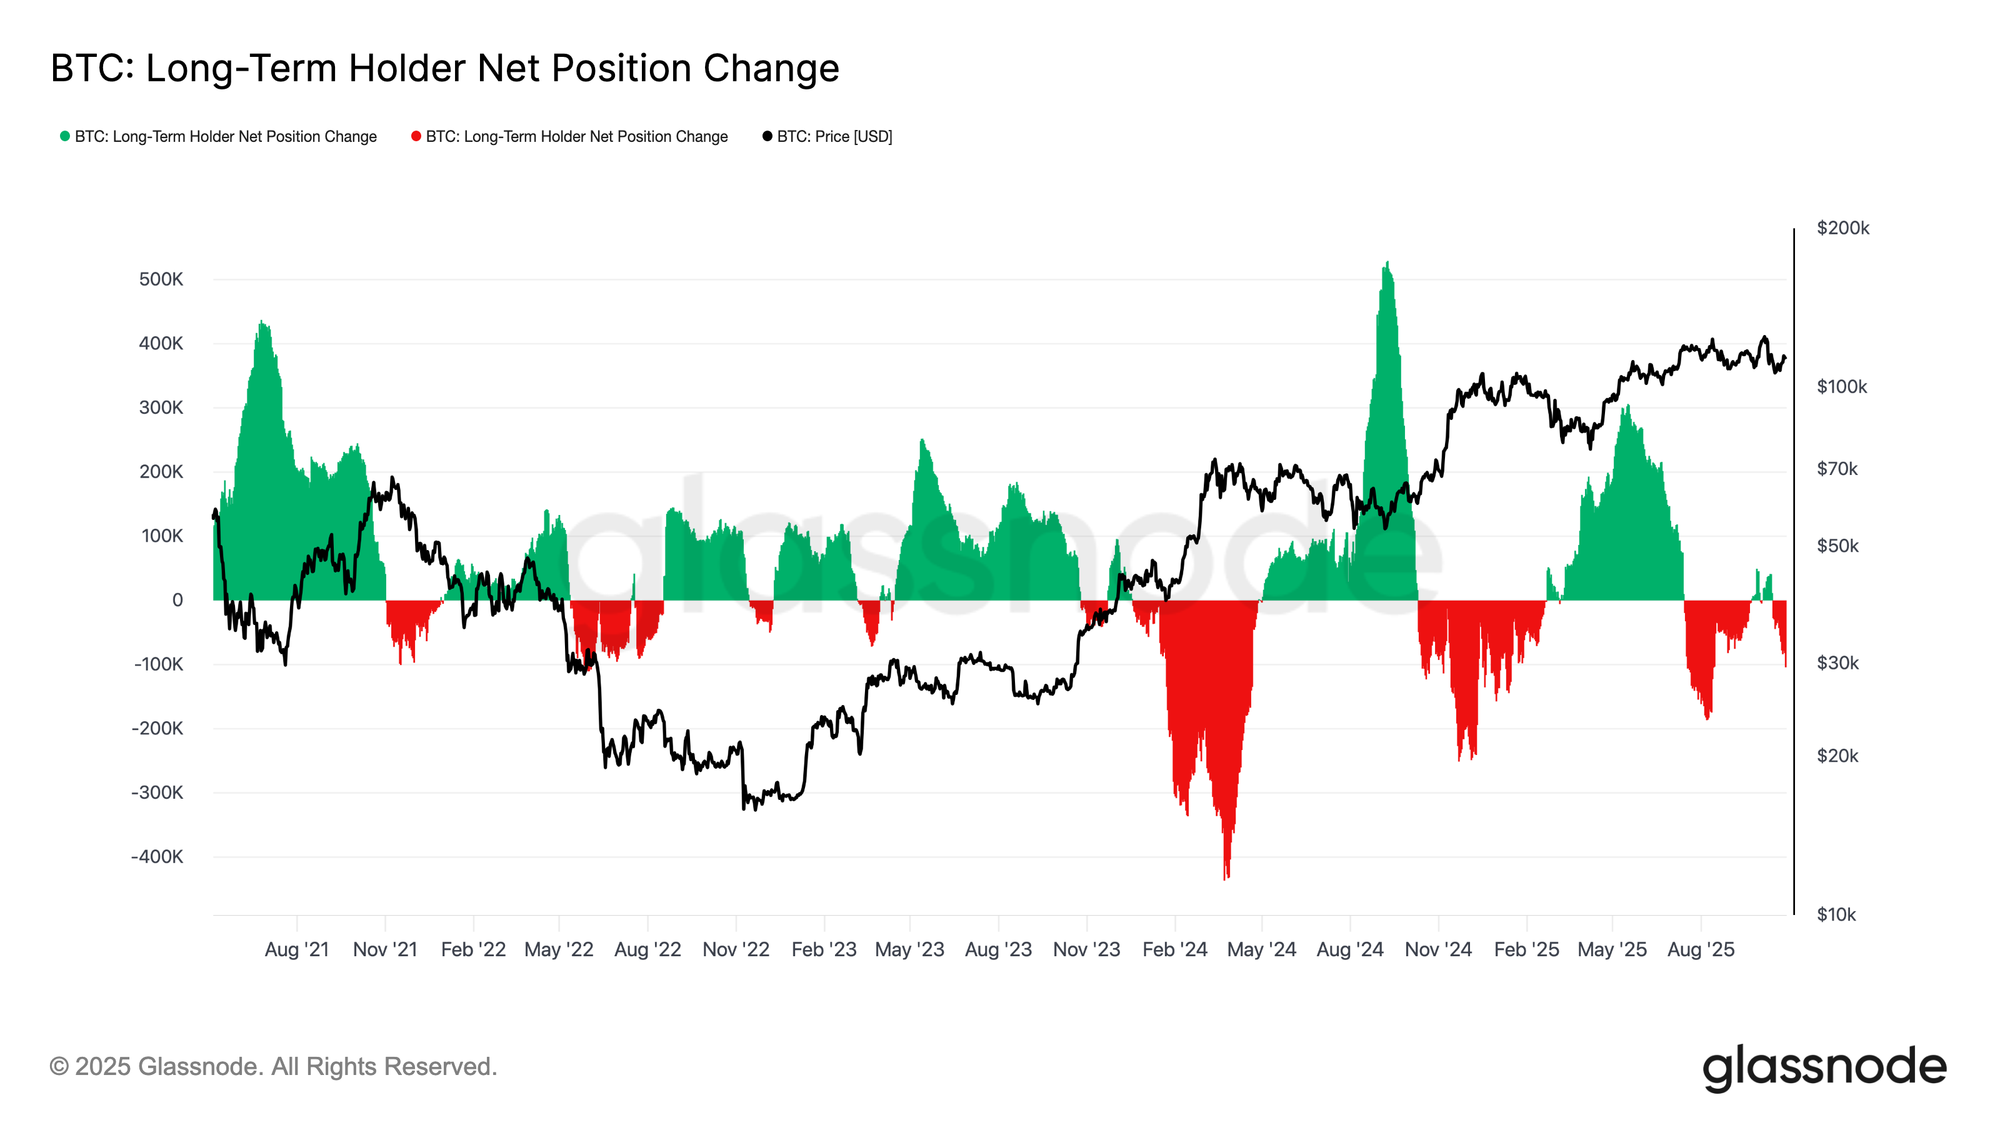
Building on earlier observations, persistent selling by long-term holders (LTHs) continues to weigh on market structure. The Long-Term Holder Net Position Change has declined to –104K BTC per month, highlighting the most significant wave of distribution since mid-July.
This ongoing sell pressure aligns with the broader signs of exhaustion seen across the market, as seasoned investors continue to realize profits into weakening demand.
Historically, major market expansions have begun only after long-term holders transition from net distribution to sustained accumulation. Therefore, a return to positive net inflows within this cohort remains a key prerequisite for restoring market resilience and setting the foundation for the next bullish phase. Until such a shift occurs, distribution from long-term investors will likely keep price action under pressure.
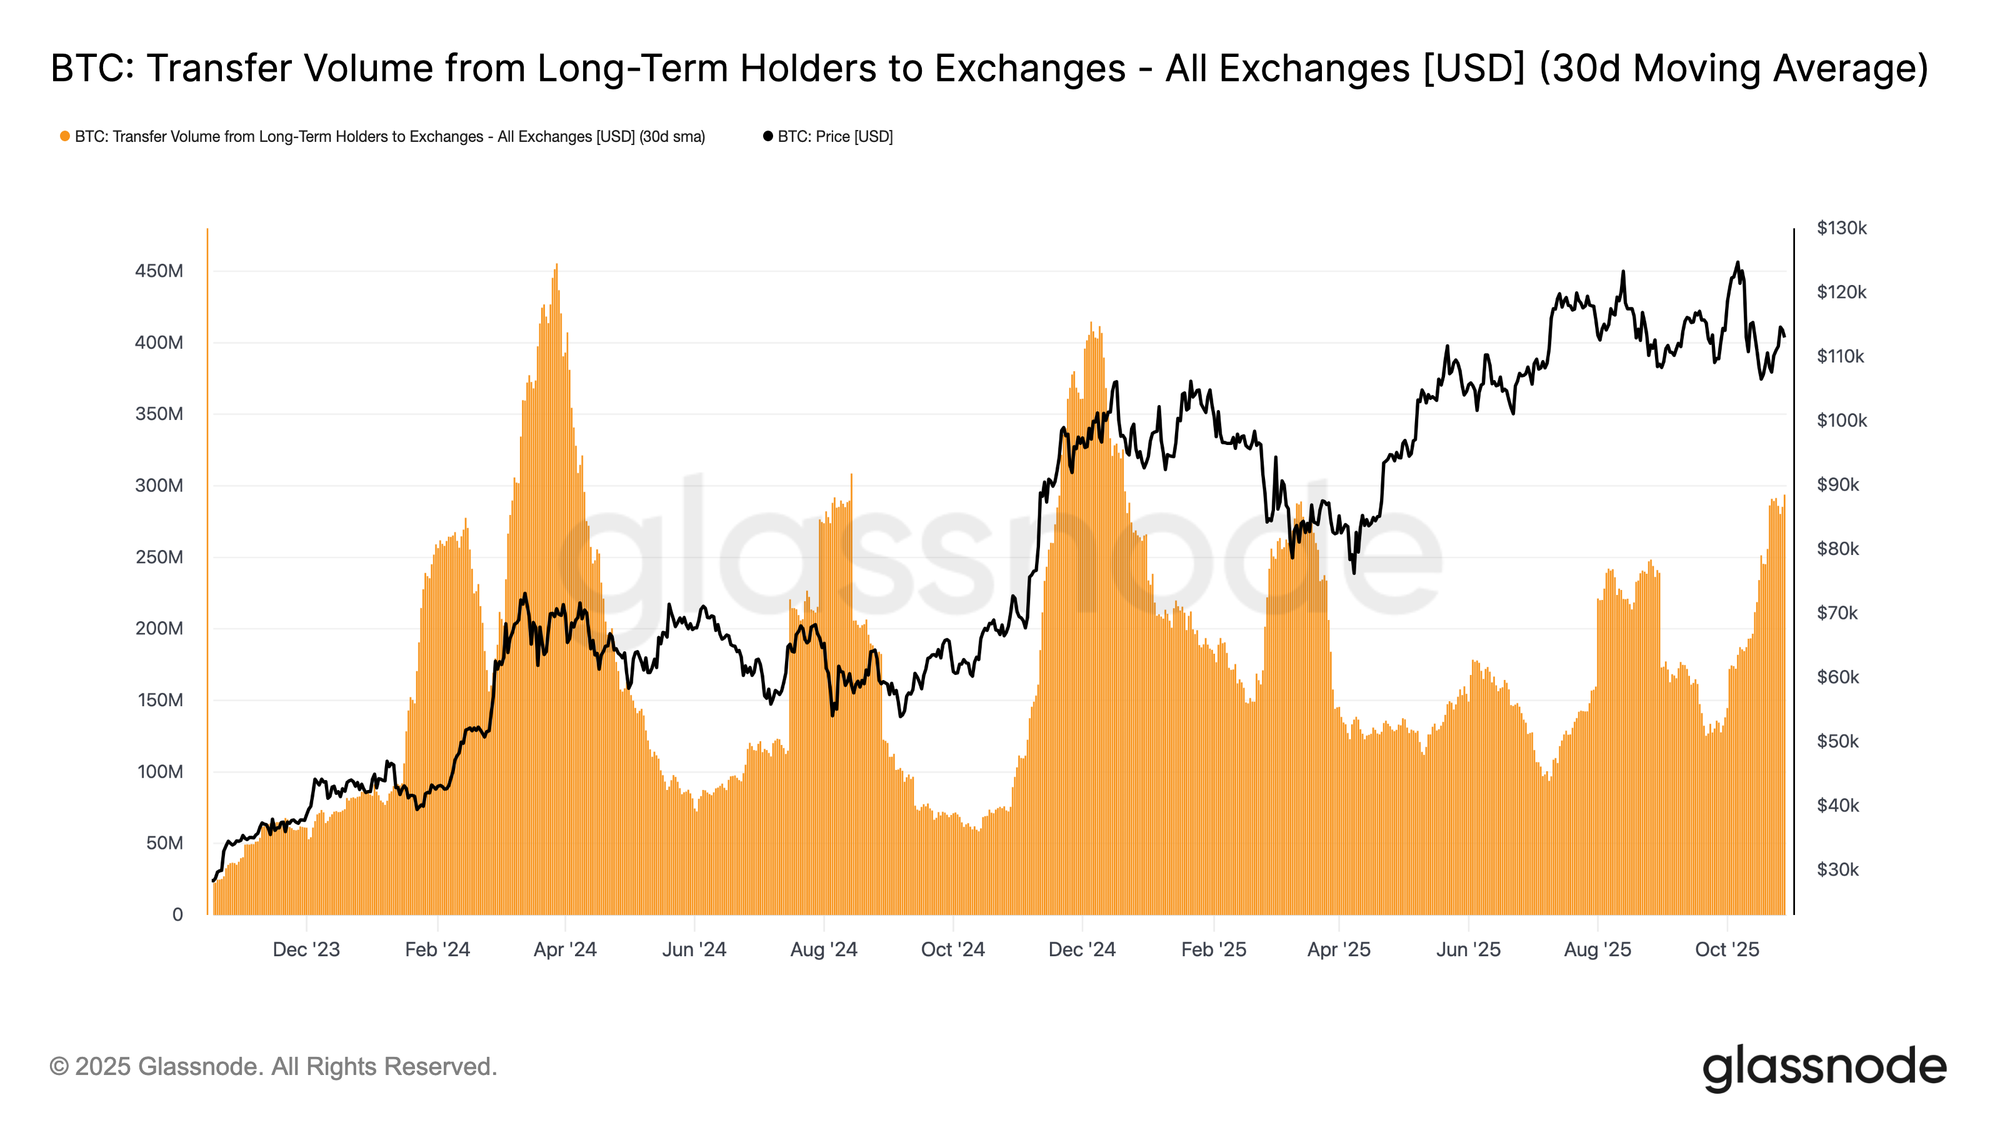
To gauge the intensity of long-term holder selling, we can turn to the Transfer Volume from LTHs to Exchanges (30D-SMA), which captures the value of coins moved by seasoned investors for potential sale. This metric has surged to around $293M per day, more than double the $100M-$125M baseline that prevailed since November 2024.
Such elevated transfer activity indicates sustained profit realization by long-term investors, adding consistent sell-side pressure. The current pattern closely resembles August 2024, a period marked by long-term holders heated spending while price momentum is slowing down. Unless this transfer flow subsides, it will remain difficult for spot demand to absorb the ongoing distribution, leaving the market vulnerable to further cooling in the weeks ahead.
Off-chain Insights
Front End Calms Down
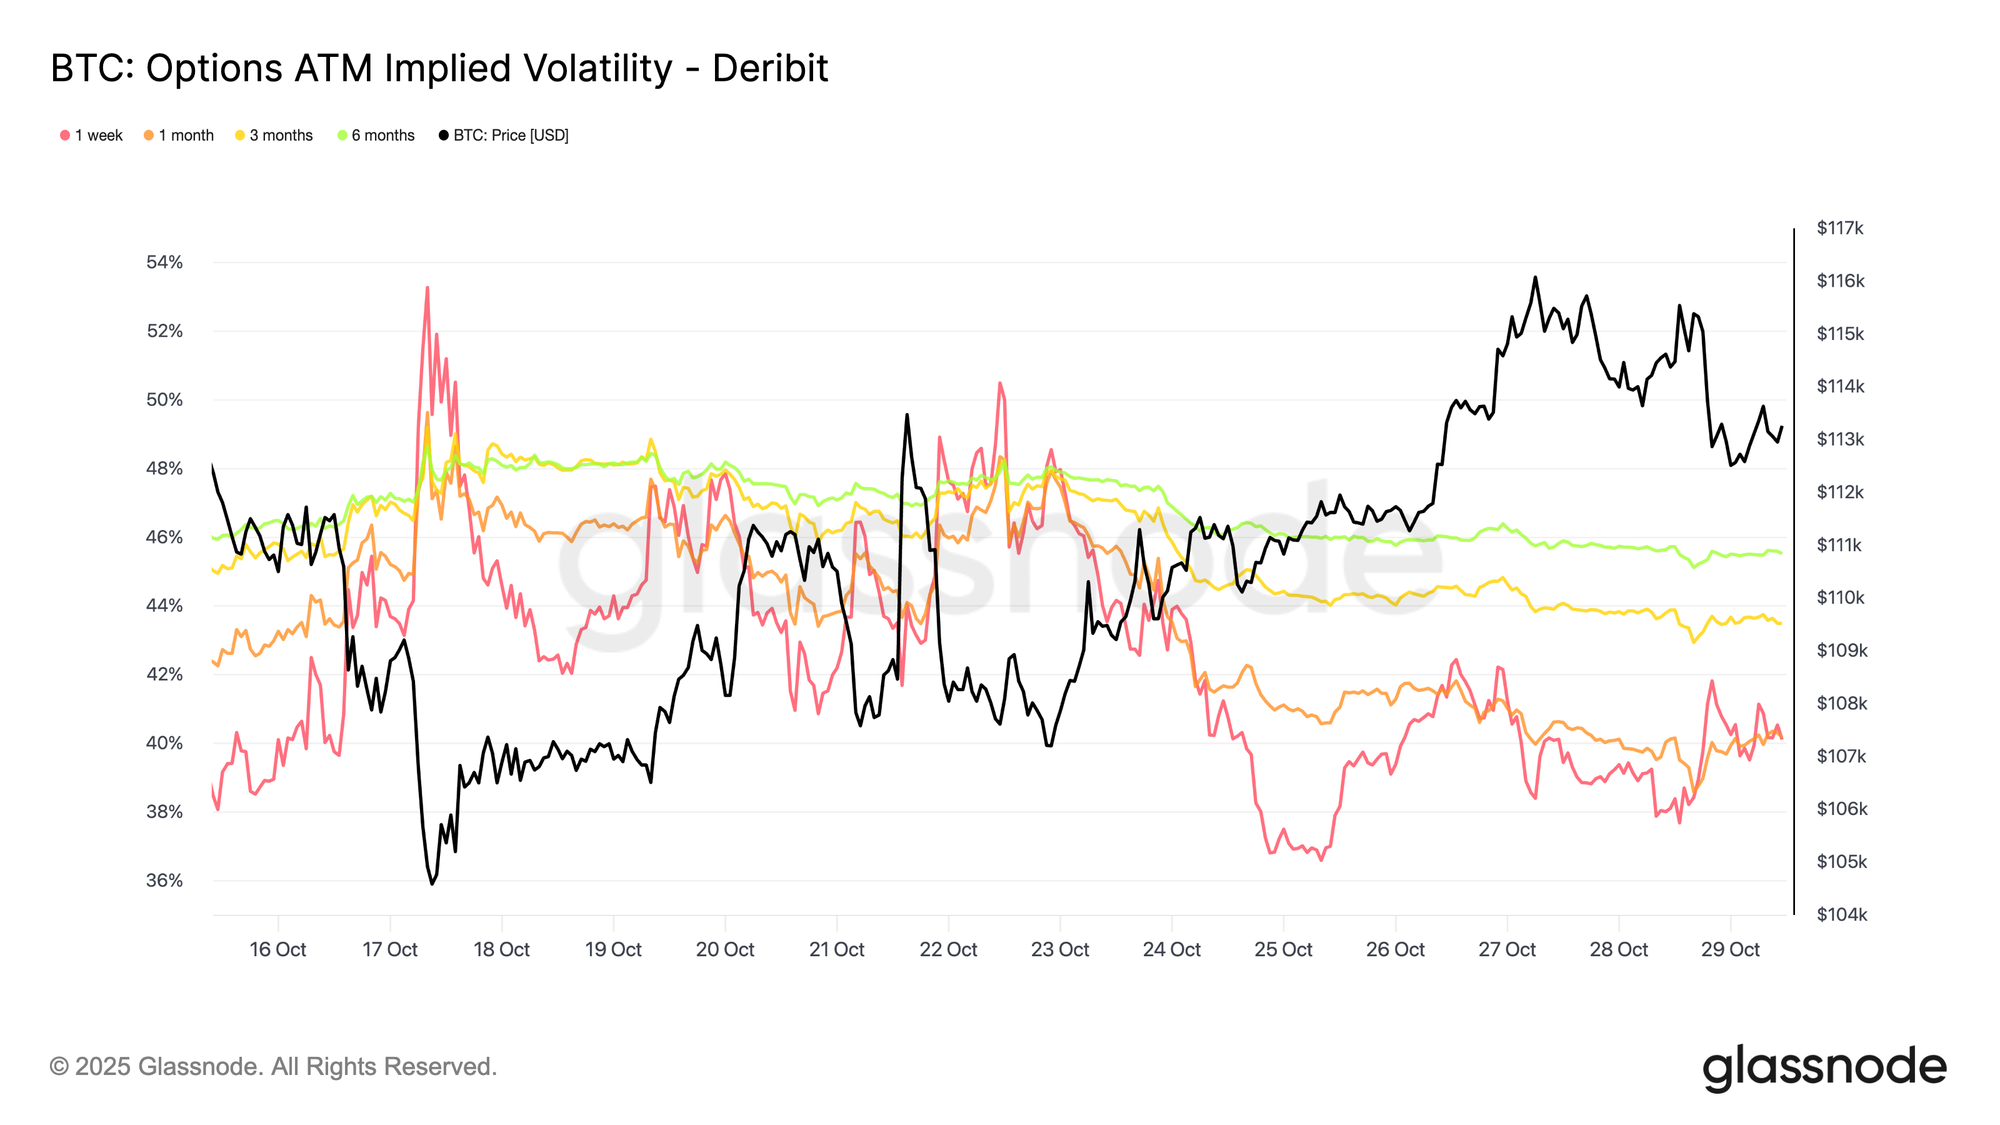
Transitioning to the options market, recent data shows that volatility stress following the 10 October crash continues to unwind. Bitcoin’s 30-day realized volatility has eased to 42.6%, down slightly from 44% last week, reflecting calmer price action. Meanwhile, implied volatility, which represents traders’ expectations, has declined more sharply as participants unwind downside hedges and reduce demand for protection.
Shorter-dated maturities have seen the largest adjustment, with 1-week at-the-money implied volatility dropping over 10 vol points to around 40%, while 1-month to 6-month tenors slipped only 1–2 points, holding near the mid-40s. This flattening of the term structure suggests traders expect fewer near-term shocks.
The curve also implies a gentle grind higher in expected volatility toward ~45% over the next few months rather than shock-style spikes.
Skew Resets Lower
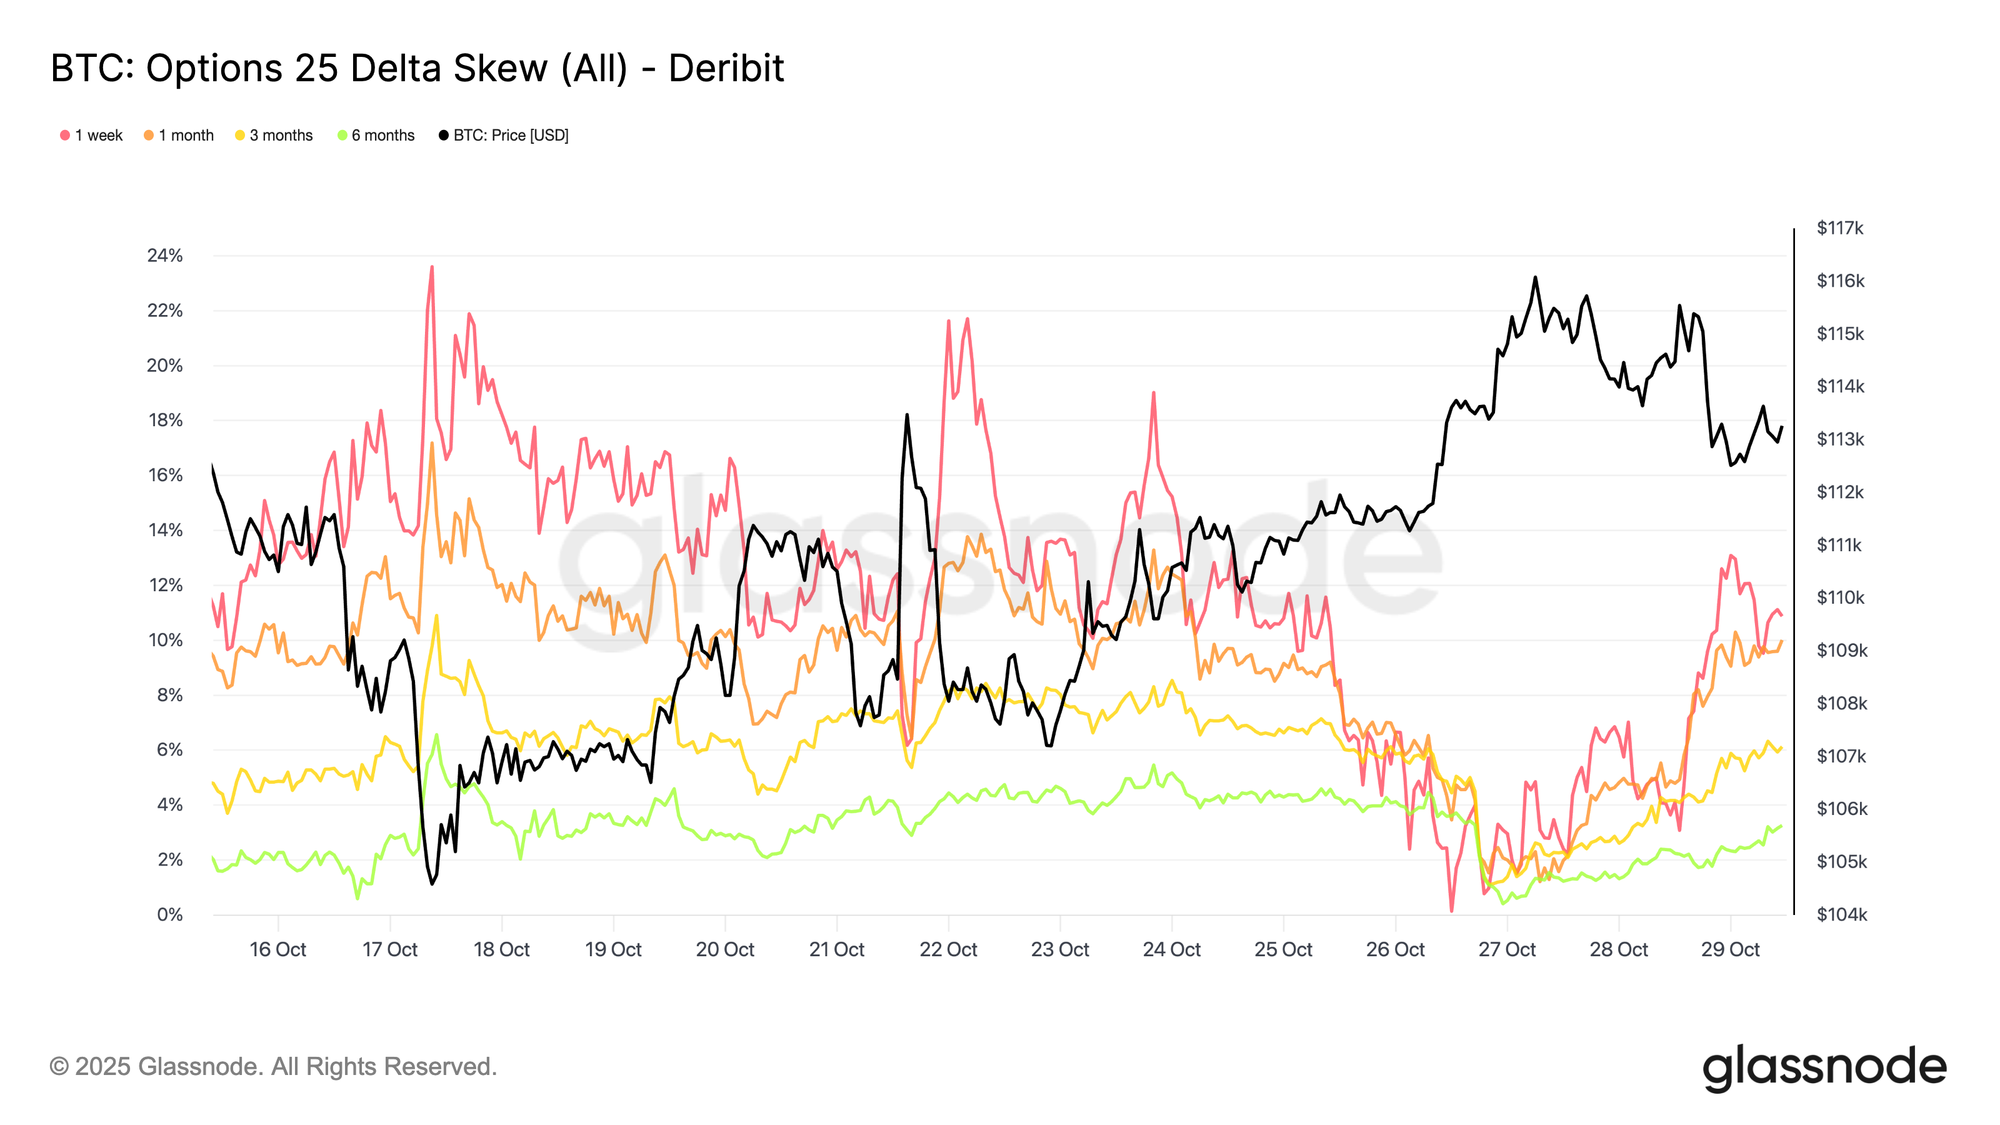
The easing in implied volatility has also translated into a notable shift in 25-delta skew, which measures the relative cost of puts versus calls. A positive skew indicates that puts are trading at a premium. Following the October washout, 1-week skew surged above 20%, signalling extreme demand for downside protection. Since then, it has collapsed toward neutral, rebounding slightly but with much lower intensity.
Longer-dated maturities, such as the 1-month and 3-month tenors, have also reset sharply, showing only a modest put premium. This shift indicates that traders have removed a significant portion of their downside hedges. Positioning is now closer to “mildly bullish/two-sided” rather than “panic about new lows,” aligning with the broader stabilization seen in Bitcoin’s recent price action.
Selective Upside Positioning
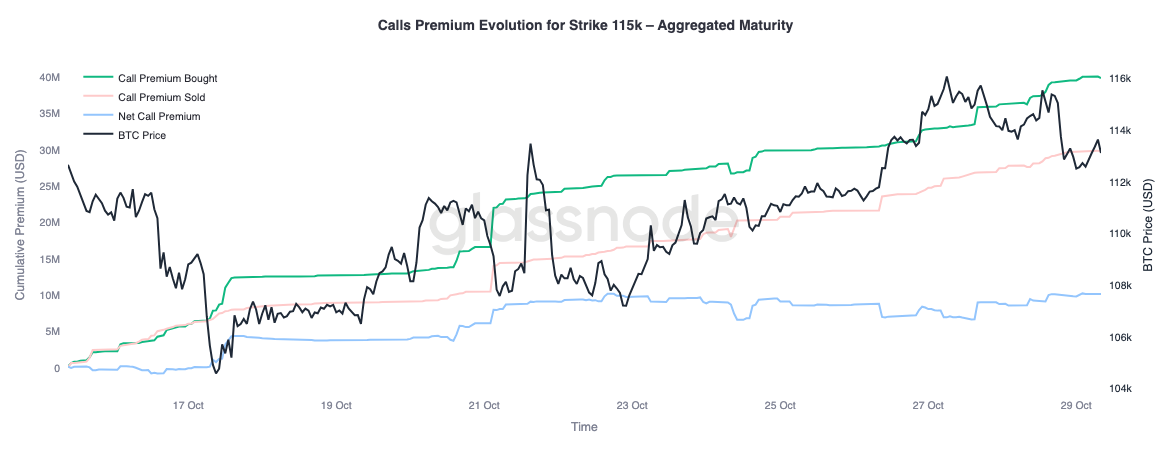
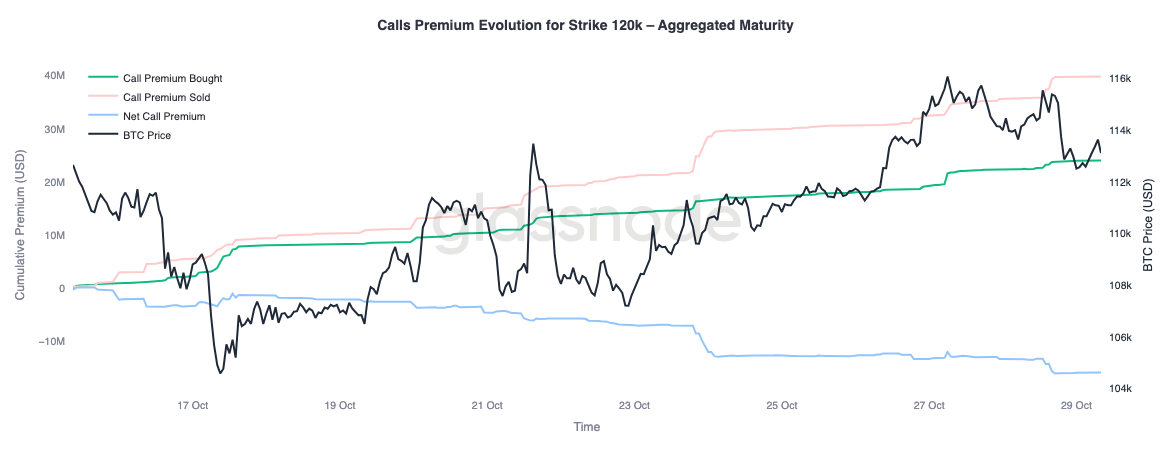
With skew normalizing, attention turns to where traders are allocating premium. Call activity now varies notably by strike. At the $115K strike, the net call premium bought remains positive, indicating that traders have consistently paid for near-term upside as the price has recovered over the past two weeks. In contrast, at the $120K strike, call premiums sold have outweighed buying, resulting in a negative net premium.
This setup reflects a “moderate rally, not full breakout” stance. Traders are willing to pay for gains closer to spot but are financing those positions by selling higher-strike calls. The resulting call spread structure suggests a cautiously optimistic view, seeking participation in further upside, but with limited conviction in a full retest of the all-time highs.
Market Prices Controlled Pullbacks
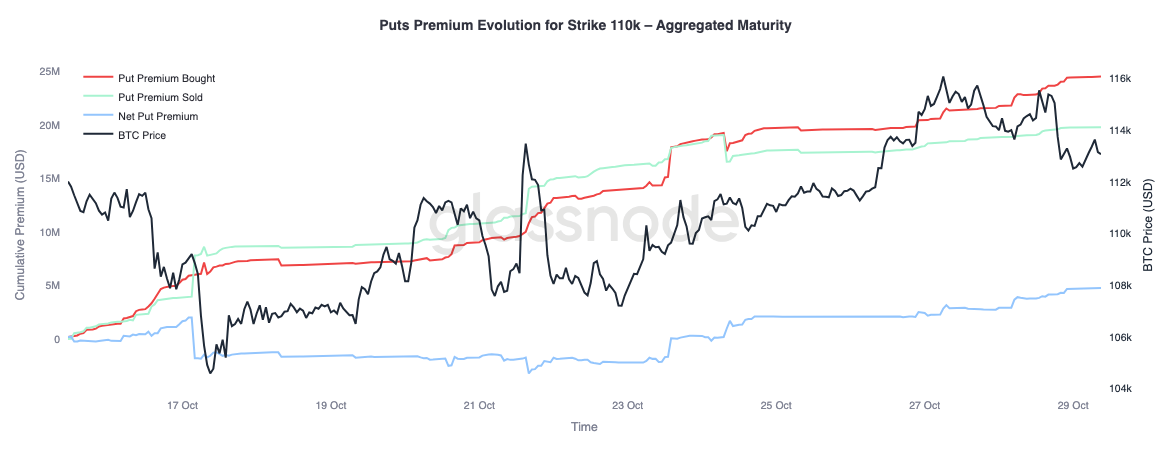
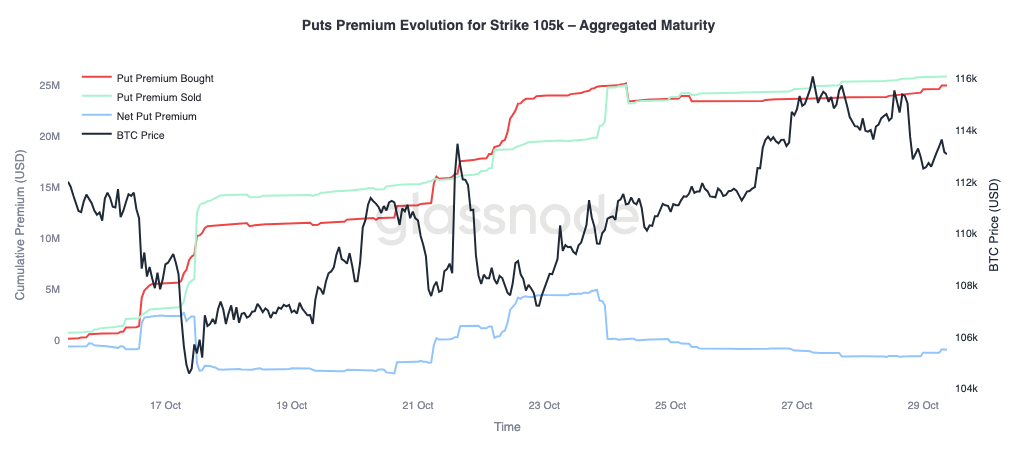
To round out the picture, we can turn to the put side of the market. Since October 24, traders have been buying $110K puts as Bitcoin pushed higher, signalling demand for near-term downside protection. Meanwhile, $105K puts have been sold more actively, suggesting that participants are comfortable collecting premiums by providing insurance at deeper strikes.
This contrast highlights a market expecting shallow pullbacks rather than another major liquidation wave. Traders appear to view consolidation near current levels as plausible (hedging at 110K) but see a full breakdown below $105K as less likely. The overall positioning supports the view that the worst of the October deleveraging is behind, with the market now focused on range trading and volatility harvesting instead of defensive hedging against another sharp selloff.
Conclusion:
The on-chain landscape continues to reflect a market in correction and recalibration. Bitcoin’s failure to hold above the short-term holders’ cost basis highlights fading momentum and sustained sell pressure from both short-term and long-term investors. Elevated long-term holder distribution and high transfer volumes to exchanges underscore a phase of demand exhaustion, suggesting the market may need extended consolidation to rebuild confidence. Until long-term holders shift back to accumulation, upside recovery will likely remain constrained.
Transitioning to the options market, implied volatility has dropped sharply at the front end, skew has normalized, and option flows now reflect controlled upside exposure and measured downside hedging. Structurally, the crypto options market appears to be transitioning from crisis mode to rebuild mode, suggesting improved stability.
However, the next major catalyst looms, the Federal Reserve meeting. A rate cut is mostly priced in, meaning that a dovish outcome would likely keep volatility subdued and skew balanced. Conversely, if the Fed delivers a smaller cut or maintains a hawkish tone, short-dated implied volatility could reprice higher, and 25-delta skew may widen as traders rush back to buy protection. In essence, the market’s current calm is conditional, steady for now, but fragile if the Fed deviates from expectations.
Disclaimer: This report does not provide any investment advice. All data is provided for informational and educational purposes only. No investment decision shall be based on the information provided here, and you are solely responsible for your own investment decisions.
Exchange balances presented are derived from Glassnode’s comprehensive database of address labels, which are amassed through both officially published exchange information and proprietary clustering algorithms. While we strive to ensure the utmost accuracy in representing exchange balances, it is important to note that these figures might not always encapsulate the entirety of an exchange’s reserves, particularly when exchanges refrain from disclosing their official addresses. We urge users to exercise caution and discretion when utilizing these metrics. Glassnode shall not be held responsible for any discrepancies or potential inaccuracies.
Please read our Transparency Notice when using exchange data.