Bitcoin prices are currently hovering above $107,000 following a bullish trading week during which the premier cryptocurrency gained by 4.89%. Interestingly, this recent price rally has translated into a 1.06% gain on the monthly chart suggesting a hinting at a gradual shift in market control back to the bulls after several weeks of descending consolidation.
Notably, renowned market analyst with pseudonym Merlijn The Trader backs this emerging bullish momentum, having identified a bull flag pattern on the Bitcoin daily chart, alongside a positive MACD crossover.
Bull Flag Pattern Signals Strong Upside Potential For Bitcoin
The bull flag is a classic bullish continuation pattern indicating a price rally is likely to persist despite ongoing consolidation. As seen in the chart shared by Merlijn, this bullish chart pattern begins with a sharp price rally i.e. the flagpole which is seen when Bitcoin kickstarted an uptrend in early April with prices climbing aggressively from around $74,000 to over $110,000 in late May.
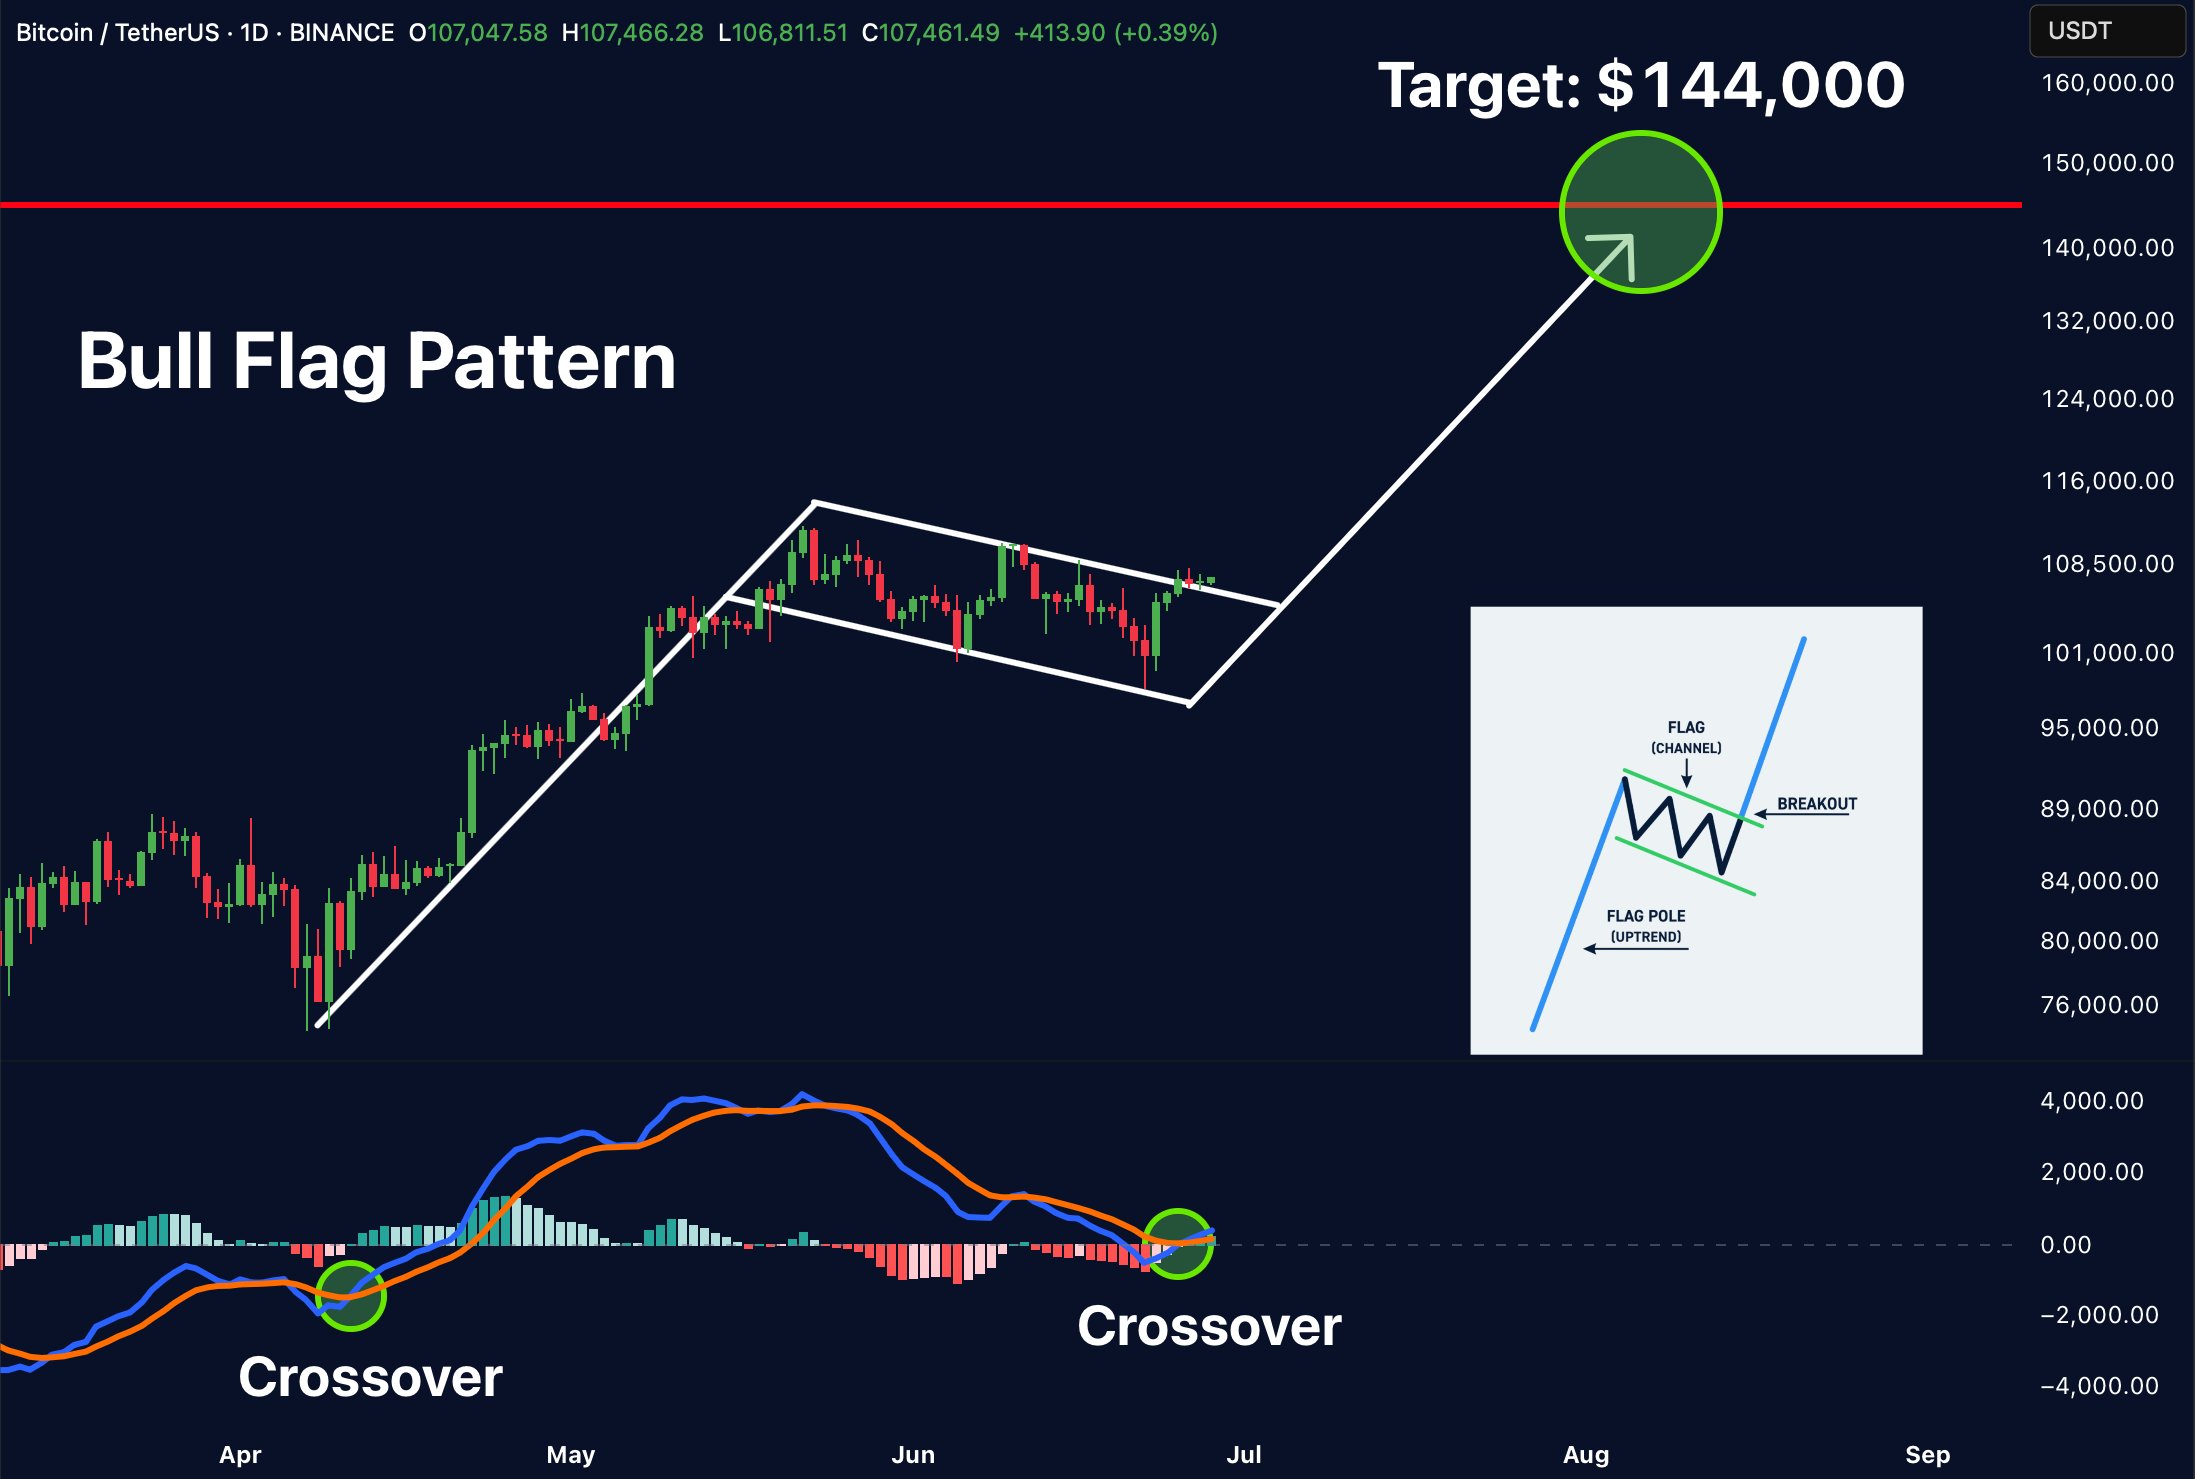
The flagpole is followed by the flag/pennant which is a period of price consolidation that forms a downward or sideways-sloping channel. This price movement is from when Bitcoin reached a new all-time high on May 22 till now with prices largely consolidating within a descending channel between $101,000 – $110,000. The flag is usually interpreted as brief cooling-off period before momentum resumes in the direction of the original trend.
Interestingly, recent candle movement shows a breakout from the bull flag upper boundary indicating the uptrend may soon resume. Based on Merlijn’s analysis, if the breakout is confirmed with a decisive close, the measured move for the new price rally, which is usually similar to the length of the initial flagpole points toward a target of $144,000 i.e. a potential 34% on current market prices.
In supporting this bullish case, the market analyst has also observed a recent crossover on the Moving Average Convergence Divergence (MACD) indicator. Notably, the MACD line (blue) has crossed above the signal line (orange) from below, often interpreted as a buy signal by traders. Interestingly, this marks the first positive crossover in June and comes when Bitcoin tests the upper band of the bull flag.
With both price action and technical indicators hinting at an impending breakout, Merlijn nudges investors to front-run this rally or risk FOMO once the move is fully underway. However, all market participants are advised to do their due diligence before making investment decisions.
Bitcoin Price Overview
At the time of writing, Bitcoin exchanges hands at $107,485 after a minor 0.03% gain in the last day.

Related Posts