Bitcoin has been bleeding for the last 48 hours. The wider crypto industry has been struggling to get over the immense choppiness. Over the last week, BTC traded between the levels of $33,000 and $28,000 respectively, today however, the king coin nosedived unhealthily.
Selling pressure zoomed up and BTC lost its long standing $28,000 support mark because of that. Currently the coin has broken below the $25,000 price mark, BTC has not traded below this mark ever since December 2020.
This level had fuelled a massive rally after December 2020 but BTC has continued to dip below the $25,000 mark at the time of writing. Financial markets including the traditional ones have also suffered lately while crypto continued to take massive setbacks one after the other.
The Terra collapse along with other scams across the wider crypto industry has continued to cause downfall across the industry. With BTC consistently surrendering to the bears, it is a matter of time till it touches its next crucial price support level.
Bitcoin Price Analysis: One Day Chart
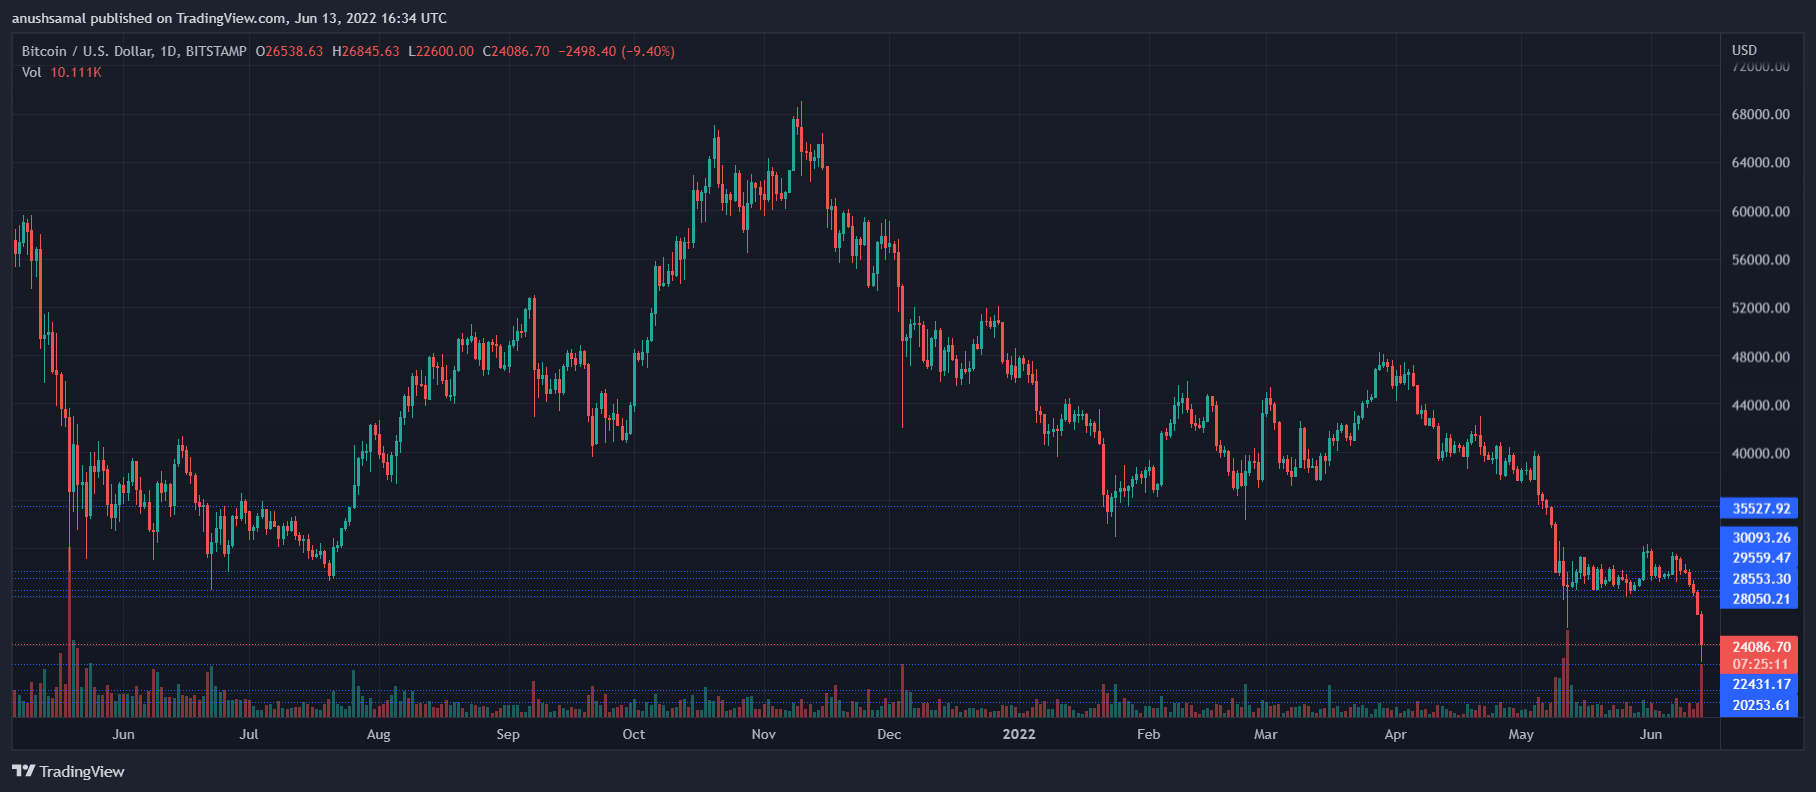
Bitcoin was priced at $23,000 on the one day chart | Source: BTCUSD on TradingView BTC plunged significantly over the last 24 hours and was trading at $24,000. In just one day alone the coin fell by 14%. It hasn’t revisited this level ever since the end of 2020. The immediate crucial support level for the coin is at $22,000. If sellers are determined BTC can fall to $20,000 too.
Major resistance for Bitcoin stood at $28,000. The amount of BTC traded in the last session saw a massive spike as reflected on the volume bars. The volume bar was also red in colour which is a mark of bearishness.
Technical Analysis
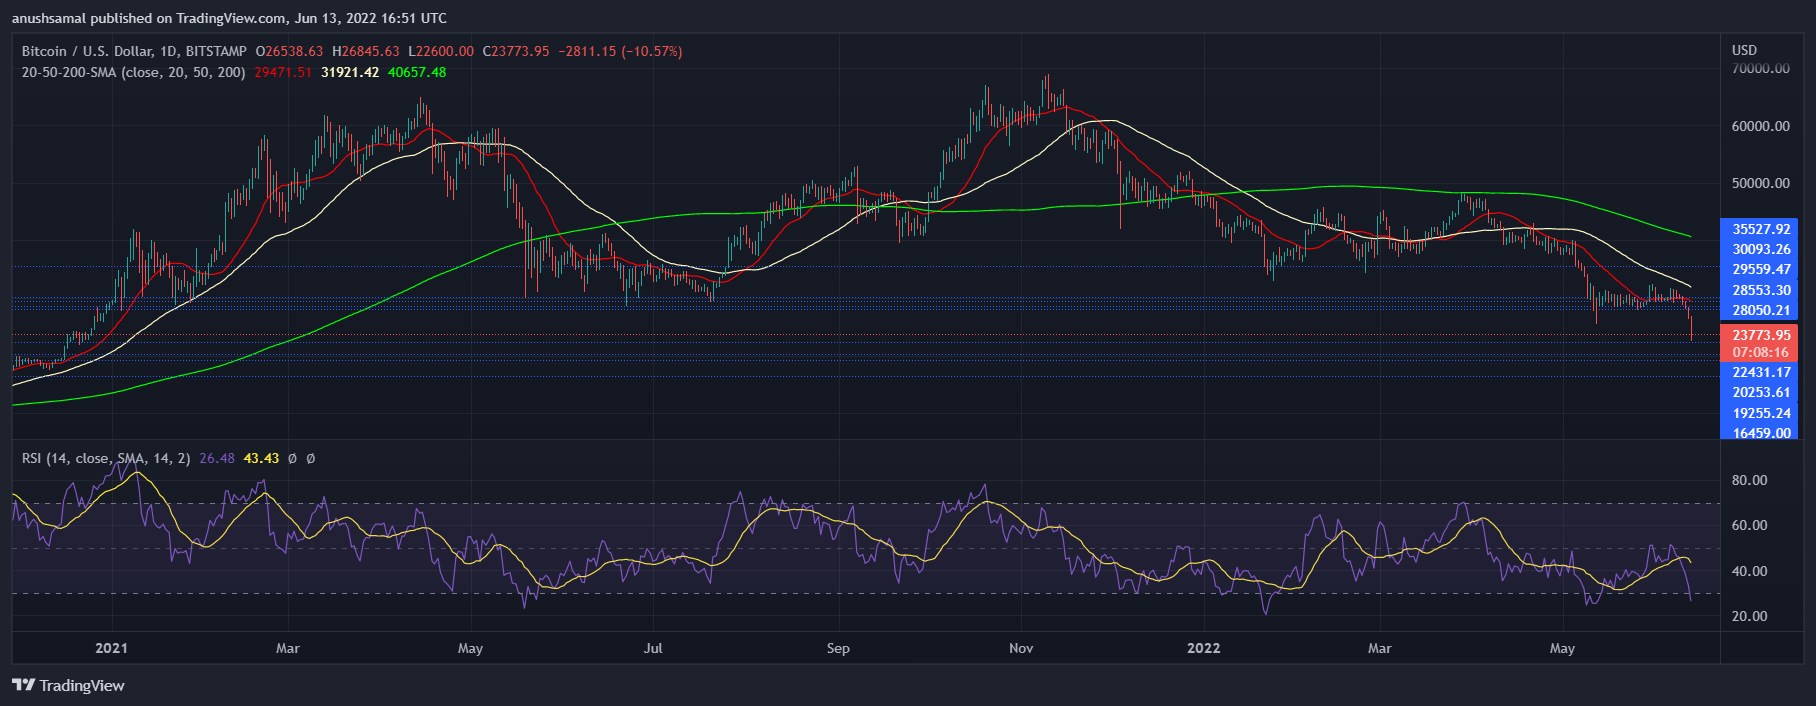
Bitcoin was oversold on the one day chart | Source: BTCUSD on TradingView Selling pressure was high as BTC continued to bleed in the last 48 hours. Previously when BTC was trading laterally, buying strength was attempting to return to the market. Right after the consolidation the coin broke below the crucial support level and buyers started to exit the market.
Correspondingly, the price of Bitcoin was seen below the 20-SMA line, which signifies bearishness. This meant that sellers were driving the price momentum of the coin at the time of writing.
Similarly, the Relative Strength Index was below the 20-level and that signifies heavy oversold conditions of the market. Usually, after a period of extreme selling pressure, the market observes a correction.
In case of a correction, price of BTC could attempt to trade above the $25,000 mark and move near the $26,000 level.

Bitcoin flashed sell signal on the one day chart | Source: BTCUSD on TradingView Bollinger Bands determine the price volatility of the market and the coin fell outside of the bands. The bands opened up which indicated that price volatility was on the rise. A fall from inside the Bollinger Bands could also hint at a price reversal.
Buying strength has to come back into the market for that to happen. Awesome Oscillator which displays a price momentum and also indicates a change in that, reflected a change towards bearish price momentum.
The indicator also flashed red histograms and that meant sell signal for the coin. The growing bar also hinted at increased selling power, however, a change in price can be expected given the sharp increase in the number of sellers.