Data shows the Bitcoin MVRV ratio has gone down recently, but the metric’s value is still above the historic bottom zone.
Bitcoin MVRV Ratio Observes Decrease, But Value Still Greater Than 1
As explained by an analyst in a CryptoQuant post, BTC may still have room for further decline before the bottom is in.
The “MVRV ratio” is an indicator that measures the ratio between the Bitcoin market cap and the crypto’s realized cap.
The market cap is simply calculated by multiplying the total number of coins currently in circulation with the current BTC price.
The realized cap is different in that instead of multiplying by the current price, each coin is instead multiplied by its value at the time it was last sold/moved.
Coming back to the MVRV ratio, what this indicator tells us is whether the current price of the crypto is fair or not.
When the value of this metric goes up, it means the market cap is outpacing the realized cap at the moment, leading to investors having more motive to sell the coin.
On the other hand, lowering values of the ratio imply there is now decreasing motive for selling in the Bitcoin market.
Now, here is a chart that shows the trend in the BTC MVRV ratio over the history of the crypto:
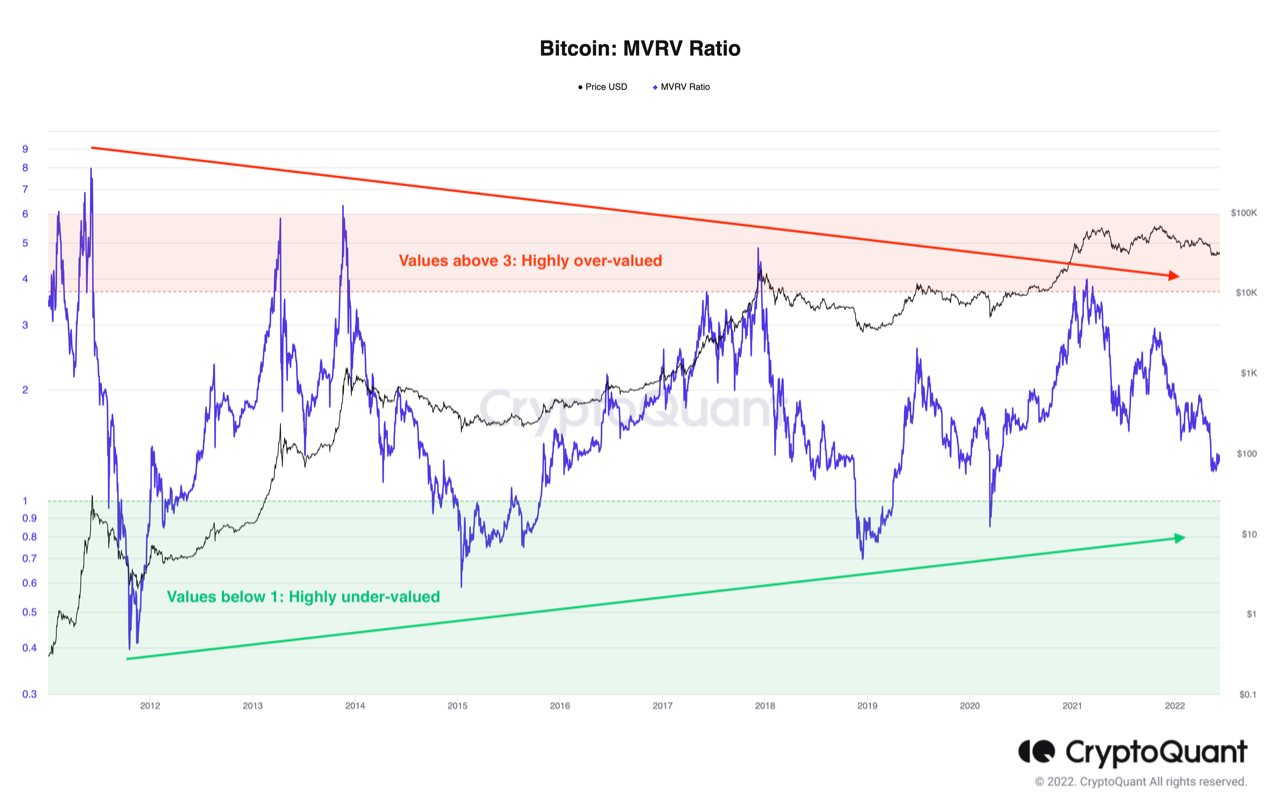
The value of the indicator seems to have been going down recently | Source: CryptoQuant
As you can see in the above graph, the quant in the post has marked the different zones of the Bitcoin MVRV ratio.
Historically, whenever the indicator has been above a value of three, tops in the price of the coin have formed. In this zone, the crypto is said to be highly overvalued.
On the other hand, bottoms have taken place in the zone below the value of one as the coin has been highly undervalued in such periods.
Looking at the chart, it seems like while the Bitcoin MVRV ratio has shown downtrend recently, the metric still has a value greater than one.
If past pattern is anything to go by, this would suggest that the coin may still have further room for decline before a bottom is found.
BTC Price
At the time of writing, Bitcoin’s price floats around $30.1k, up 1% in the last seven days. Over the past month, the crypto has lost 12% in value.
The below chart shows the trend in the value of the coin over the last five days.

Looks like the price of BTC has been trending sideways over the past two days | Source: BTCUSD on TradingView