1. Market trend: low rebound, creating trading opportunities
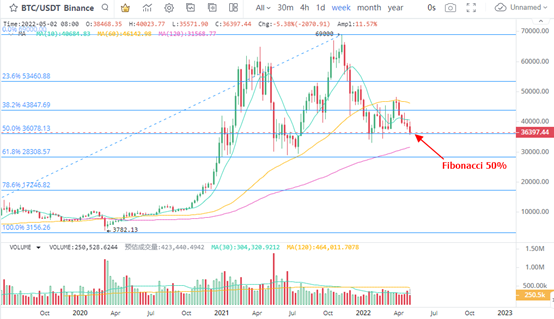
On the weekly K-line level, the decline of BTC has reached the key point of $36078 corresponding to 50% of Fibonacci. On May 5, BTC hit a minimum of US $35500 and once fell below 50% of Fibonacci in the short term, with clear signs of adjustment. Meanwhile, in terms of decline within one year, since the decline of US $57446 on May 5, 2021, the cumulative decline of BTC has expanded to 38%.
In terms of support worthy of attention, 61.8% of Fibonacci's support is more effective. It was recognized as a typical support line in mid-2021, and the corresponding price is US $28308. At present, the support corresponding to 50% is weak, and the risk of BTC falling near us $36078 increases.
Defensive investors can refer to US $28308 suggested by 61.8% Fibonacci as an important low suction point, and pay attention to the buying opportunities from this split line to US $36078 upward and US $17246 downward.
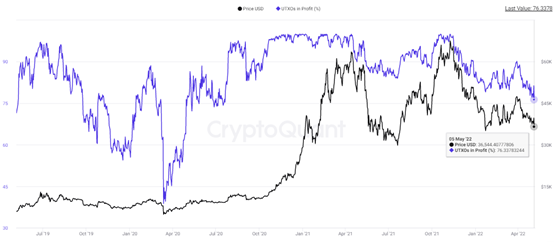
In terms of indicators, measuring the overall profit proportion of BTC investors is very important to confirm trading opportunities. The decrease in the ratio of BTC's profitable utxo to the total utxo will reduce the selling pressure brought by profitable investors and increase the probability of BTC's bottom building success accordingly.
The latest data show that the utxo of BTC was 76.34% on May 22, indicating that most investors in transfer transactions still made profits. Historically, investors can effectively verify the bottom signal after their profitability has fallen to the range of 40% to 60%. Before that, investors who buy BTC at a low price can build positions in batches, so as to effectively avoid risks.
Considering that BTC has been adjusted for more than one year since 2021, the chip concentration of more than $30000 has increased. Therefore, in the phase of BTC's continued retreat, the reduction of investor profitability may appear in the near future.
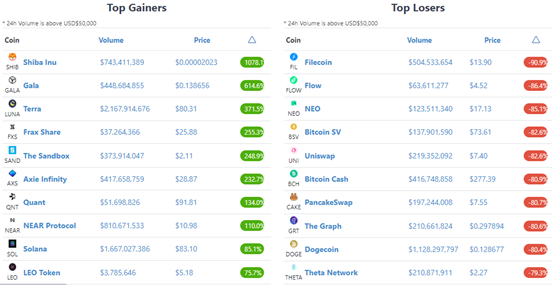
2. Rise and fall performance of top 100 currencies in market value within one year
Over the past year, among the top 100 currencies with market value, Shib has the highest increase, reaching 1078%. Secondly, gamefi concept currency Gala, algorithm stability currency Luna, FXS and meta universe concept sand all increased by more than 200%.
On the decline list, fil, flow and Neo fell by 90.9%, 86.4% and 85% respectively. In the bear market, when the decline reaches 80%, the maximum cash holding loss can also reach 80%. In this way, the increase required for breakeven can reach up to 500%. Therefore, in the face of the bear market, it is important to reduce positions and buy at a low price, so as to reduce losses and seize the opportunity to buy at a low price.
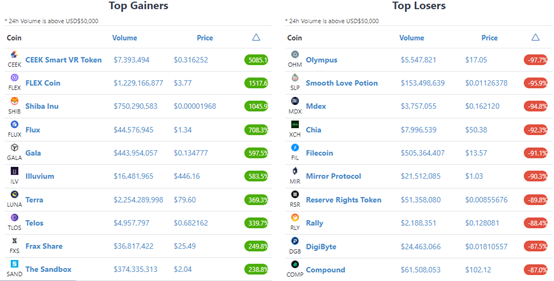
3. Rise and fall performance of top 300 currencies in market value within one year
Among the top 300 currencies by market value, the volatility intensity in the past year is higher. On the list of increase, the largest increase of the top 300 market value currencies was ceek, with 5085%, and the second highest flex increased by 1517%.
In terms of the decline list, among the top 10 currencies with the largest decline, comp has the smallest decline of 87%, and there are as many as 6 currencies with a decline of more than 90%. Only from the decline list, among the investors who have held money for a year, they have lost the most money on fil, XCH and comp. In terms of circulation market value, the circulation market value of fil, XCH and comp can reach US $2.732 billion, US $177 million and US $697 million. The larger the market value, the corresponding loss of circulation market value can reach US $24 billion, US $1.59 billion and US $6.2 billion respectively.