1. Market trend: the leverage ratio of BTC increases, and the risk of price decline increases
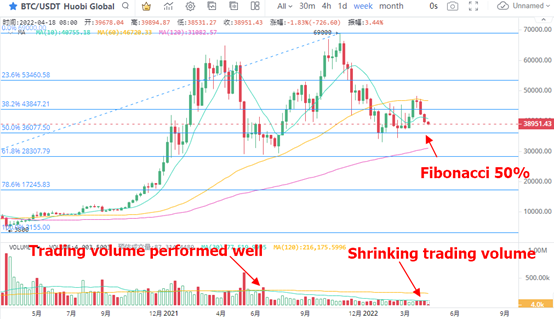
With the BTC price moving downward, the possibility of further falling below the support line in the near future is very high. Judging only from the trading volume and price performance, BTC does not support a new round of rebound. Compared with the trading volume in June 2021, the current weekly trading volume of BTC is sluggish, which may be the reason why it is difficult for BTC to rebound in the short term after breaking the position. At the beginning of July 2021, the weekly trading volume of BTC was relatively mild, especially more than twice the trading volume of BTC at the same point. Of course, not only the trading volume is shrinking, but also the number of active addresses on the BTC chain is running at a low level. Therefore, we can pay more attention to the long-term low absorption opportunities after withdrawal rather than short-term profit opportunities.
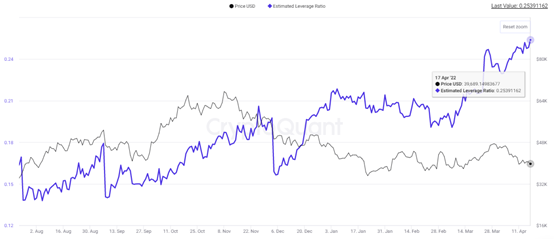
Among the important data changes of estimated leverage ratio, it can be seen that the index has reached the position of 0.254 on April 17, the highest value in two years. If BTC bulls fail to raise the price in the near future, under the premise of such a high leverage ratio, the downward movement of the price is bound to fall below the contract cost price of more investors and expand the scale of position explosion. Accordingly, the increase in the scale of position explosion will also quickly push the price down.
2. Interpretation of panic index:
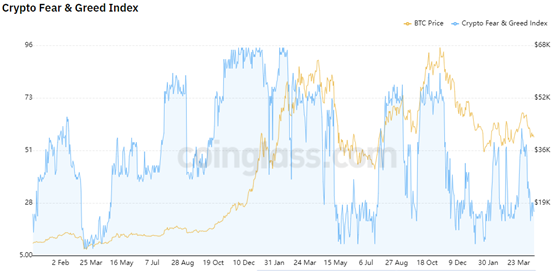
The recent performance of the panic index is weak. It has been lower than 50 since April 5, which indicates that investors' trading enthusiasm is not high. Compared with the performance of the panic index in the second half of 2021, the current panic index is more panic, so it can not be radical in the trading direction.
In the calculation of the panic index, the trading volume, volatility and bitcoin market value have 25%, 25% and 10% weights respectively. The current trading volume maintains a long-term contraction trend, limiting the rebound of the panic index. And the short-term BTC decline continues to expand, and the volatility is not high. In the position where the panic index is lower than 30, any change in price is worth the vigilance of bulls.
3. Dragon and tiger list:
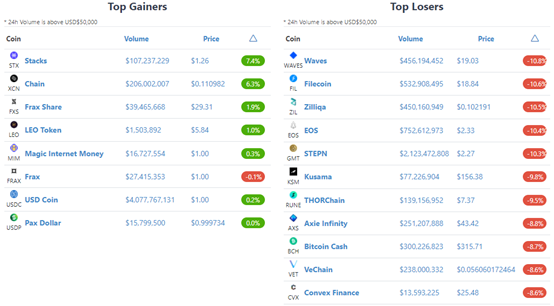
BTC led the continuation of the correction trend of mainstream currencies, and most sectors showed downward performance. In the increase list, the top currencies are STX, xcn and FXS. Among the falling rankings, waves, fil and ZIL have a large 24-hour decline of more than 10%.
Considering the continuation of the adjustment trend of mainstream currencies such as BTC and eth, the overall market is still dominated by callback. Most of the top gainers are the concept of stable currency. It is difficult to rebound in the near future. Pay more attention to the confirmation of the bottom, and then the low suction market.
STX
Stacks is a new Internet with decentralized applications, equipped with a complete set of open source development tools to build and guide the decentralized application and protocol ecosystem. Users have their own data, and the browser is everything they need to start. Stacks is the "Google" of the blockchain, in which the architecture is divided into three layers: the bottom layer of the blockchain - peer-to-peer network - data layer. The business model of stacks is very clear. Its goal is to become a blockchain browser. On this browser, users can create basic todo applications and build single page JavaScript applications.
In terms of price, STX rebounded during the period of high-volume short-term pulse, with a short-term 24-hour increase of 7.4%, and the trading volume increased by more than 7 times. While the short-term main force pulls the market, there is great uncertainty in the price performance. To catch up, you can choose to trade at a low suction point.
XCN
Chain is a cloud blockchain infrastructure that enables organizations to build better financial services from scratch. Chain launched chain core, a licensed and open source blockchain and sequence, whose ledger is a service product.
As a new currency listed on the fire currency exchange, xcn's short-term performance is still strong, and the price fluctuation intensity within the day has reached 4%. Xcn trading volume will remain relatively stable due to the shock.
FXS
FraX aims to become "the world's first decentralized stable coin, with some of its supply tokens supported by collateral and some stabilized by algorithms."
FraX protocol implements a dual token system: stable token FraX and protocol governance token FXS.
In the fourth quarter of 2021, with the release of FraX V2, FraX was adopted on a large scale and linked with the whole defi system. As of January 25, the FraX project fund pool earned an average of $500000 per day (annualized about $180 million) through the amo (algorithmic market making program) launched by the team in the early fourth quarter of 2021. During the same period, the supply of FraX climbed from less than $500 million to a staggering $2.6 billion.
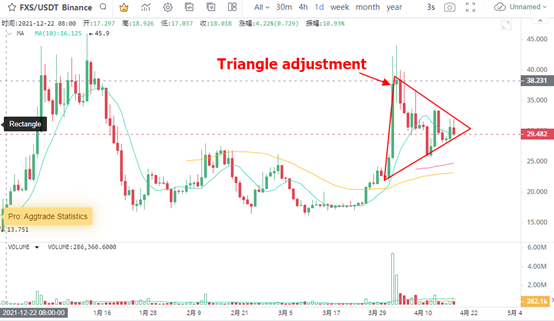
In terms of price, FXS retreated after the platform token Luna, which followed Terra algorithm to stabilize the currency, rebounded in the early stage, and the price is in the adjustment stage recently. Despite the 24-hour rise of 1.9%, FXS has not effectively left the adjustment area. In terms of lock up, FXS locked up $2.3 billion, with little change. Next, we can focus on the supporting effect of BTC stabilization on FXS. FXS is expected to have a strong price again after the overall market stabilizes.
Decline list
Among the decline list, waves and ZIL led the decline, with a 24-hour decline of 10.8% and 10.5%.
Wave has a large decline and expanded the decline space under the condition of large volume, indicating that the main force has typical shipping signs.
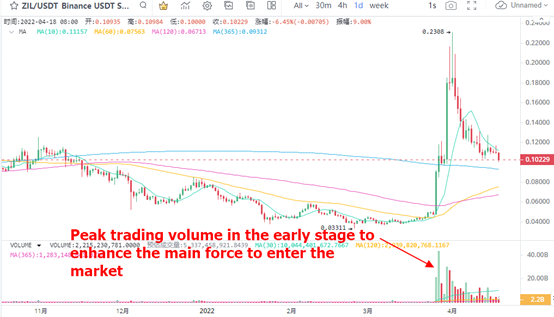
After ZIL released meta universe platform Metapolis, the price continued to rise strongly. It is reported that on April 2, ZIL will hold an event in Miami for the purpose of the Metapolis platform. Perhaps, the development of ZIL market is related to the good expectations of investors for its participation in metauniverse.
In terms of price performance, ZIL also rose and fell, but the decline in volume is more typical. In other words, ZIL may usher in a technical rebound after adjustment and expansion. Especially with the positive blessing, ZIL's massive rise since March 26 can not be ignored. This was the strongest bull rally ever.