The price of Bitcoin surged by an impressive 7% this week, allowing the cryptocurrency to break the previous channel it was trapped inside to push above $30,000 and hit a fresh ten-month high not seen since June 2022.
The move upward surprised many analysts, who were previously expecting BTC to pull back toward $25,000 before heading higher. Nevertheless, the swing higher has allowed BTC to break the previous structure and set fresh highs for 2023 as it looks to continue its recovery from its disastrous performance in 2022.
With Bitcoin heading higher, we decided to look at where the resistance is on the way back toward $40,000. Meanwhile, it seems that some traders are securing profits from this move and investing in the next memecoin sensation before it explodes higher.
Bitcoin Surges Beyond $30,000 as Bull Run Starts to Heat Up
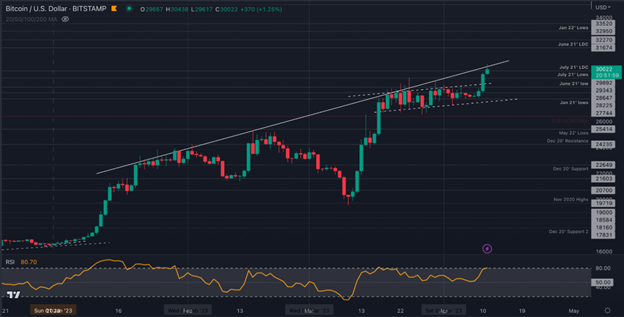
The price of Bitcoin is now up by a whopping 46% over the past month of trading. The cryptocurrency previously struggled to break resistance around $29,000 as it was stuck at this level since mid-March. The breakout occurred yesterday as BTC soared beyond $29,000 and continued higher to break $30,000.
Today, BTC continued upward to meet resistance at $30,300 – provided by a trend line that has been in play since January 2023. The latest move has revived the bullish narrative for BTC as traders believe that the number one ranked cryptocurrency can continue to surge through April as it makes its way toward $40,000.
The impressive growth for BTC in Q1 2023 has allowed the asset class to beat the average return of the five major stock indexes. While BTC surged by an impressive 170% over the period, the major stock indexes only managed to increase by an average value of 5.5%.
Are Global Macroeconomic Indicators Starting to Settle?
With the Silvergate Bank, Signature Bank, and Silicon Valley Bank collapse reminding investors about the fundamental weaknesses of the global economy, the narrative surrounding inflation might be starting to settle.
Over the past two years, rising costs of goods and services forced central banks worldwide to increase their interest rates to try and curb consumption. As a result, the US Federal Reserve started to hike interest rates at its most aggressive pace since the 1980s, pushing the current interest rate to around 5%.
Although we’re not yet out of the woods, there are hints that the inflation fear might be starting to ease. For example, the February CPI report – released last month – indicated that inflation in the US slowed from 0.5% to 0.4% monthly and from 6.4% to 6% yearly. As a result of this CPI report, BTC managed to surge past $26,000 to hit the previous resistance, beneath $29,000.
Now, traders will keep their eyes on the US CPI report, expected later this week. If the CPI suggests that inflation is heading back toward the Federal Reserve’s 2% target, we can expect BTC to continue its upward trajectory and head higher.
Bitcoin Indicator Hints at Bull Run Ahead
Bitcoin on-chain indicators are also starting to hint that a major bull run is incoming. For example, the aSORP (90D) metric (Average Spent Output Lifespan Ratio), which shows the average lifespan between when a Bitcoin is spent and when it is spent repeatedly, is starting to suggest that we are entering a bull market.
Typically, when the aSORP is above the value of one, it indicates that a bull market is incoming. Historically, this metric has signaled some impressive returns for traders in 2015, 2019, and 2020 – all of which produced remarkable returns.
The aSORP recently flipped above the value of one this week, indicating that Bitcoin could be about to experience a parabolic move higher.
MicroStrategy Pushes BTC Holdings up to 140,000, and Bitcoin Holders Rise
While Bitcoin was stuck beneath $29,000, the business intelligence firm spearheaded by Michael Saylor, MicroStrategy, announced that they bought another 1,045 BTC for a price of around $29.3 million.
These Bitcoins were purchased between March 24th and April 4th, indicating that MicroStrategy was purchasing when the price of BTC was struggling to break previous resistance as they foreshadowed the move higher. On average, MicroStrategy purchased the 1,045 BTC at a price of around $28,000.
The additional 1,045 BTC has now put the company’s BTC holdings to an astronomical 140,000 BTC – making it the largest holding by a company by a long mile.
While MicroStrategy continues to line its wallets, the overall number of “hodlers” continues to rise. According to data from Santiment, the total amount of Bitcoin holders has been rising at the fastest rate since early 2021;
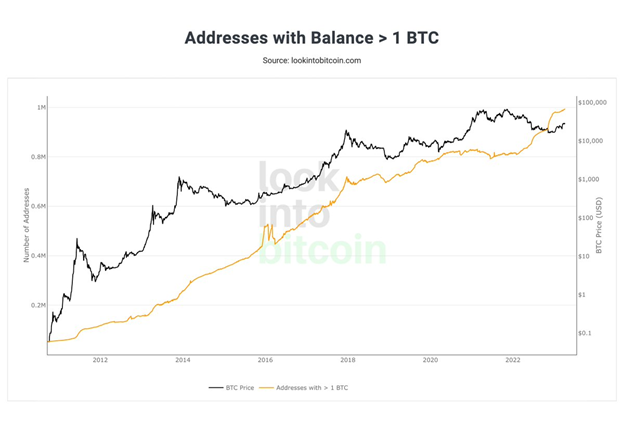
Looking further into this, the number of crypto wallets holding at least one Bitcoin also reached a new all-time high, getting very close to the 1 million milestone;
With the outlook looking extremely positive, where is the resistance on the way up toward $40,000?
BTC Price Prediction: Where is the Resistance Toward $40,000?
The daily chart below shows BTC from mid-January 2023 to the current price. The chart shows the trend line that has stalled the BTC price hike, which has been active since the start of January. A break above this trend line would indicate a parabolic move higher for BTC;
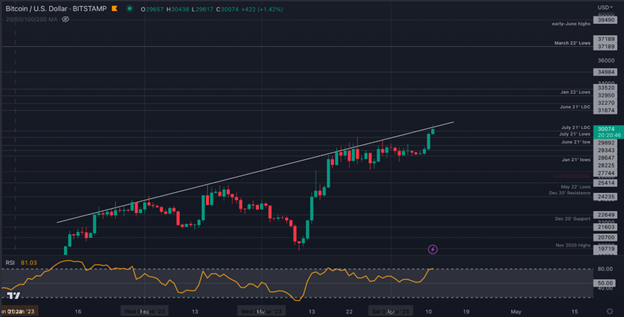
The consolidation period during the second half of March, between $29,400 and $27,000, has also created a great deal of support for the market if it starts to head lower.
Looking ahead, if the buyers manage to break the resistance provided by the trend line, the first level of higher resistance is expected at $31,000. This is followed by resistance at $31,650 (June 2021 low-day closing price), $32,270, and $32,950 (Jan 2022 lows). If the buyers continue to push beyond $33,000, additional resistance is expected at $33,500, $34,000, $35,000, and $37,190 (March 2022 lows). Finally, before being free to test the $40,000 level, BTC would have to challenge the June 2022 highs at $39,490.
On the other side, BTC’s first level of support lies at $30,000. This is followed by support at $29,890 (June 2021 lows), $28,230, $27,750 (Jan 2021 lows), and $26,500. Finally, added support is expected at $25,400 (May 2022 lows) and $24,235.