Ethereum price failed to clear the $1,925 resistance zone against the US Dollar. ETH is struggling to test $2,000 while Bitcoin gained pace and rallied above $30,000.
- Ethereum attempted a fresh increase but struggled above the $1,925 zone.
- The price is trading above $1,850 and the 100-hourly Simple Moving Average.
- There was a break above a bullish pattern with resistance near $1,860 on the hourly chart of ETH/USD (data feed via Kraken).
- The pair could correct lower but the bulls might remain active near $1,880.
Ethereum Price Tops Again
Ethereum’s price started a fresh increase above the $1,850 resistance zone, similar to Bitcoin. ETH price cleared a few hurdles near $1,880 to move into a positive zone.
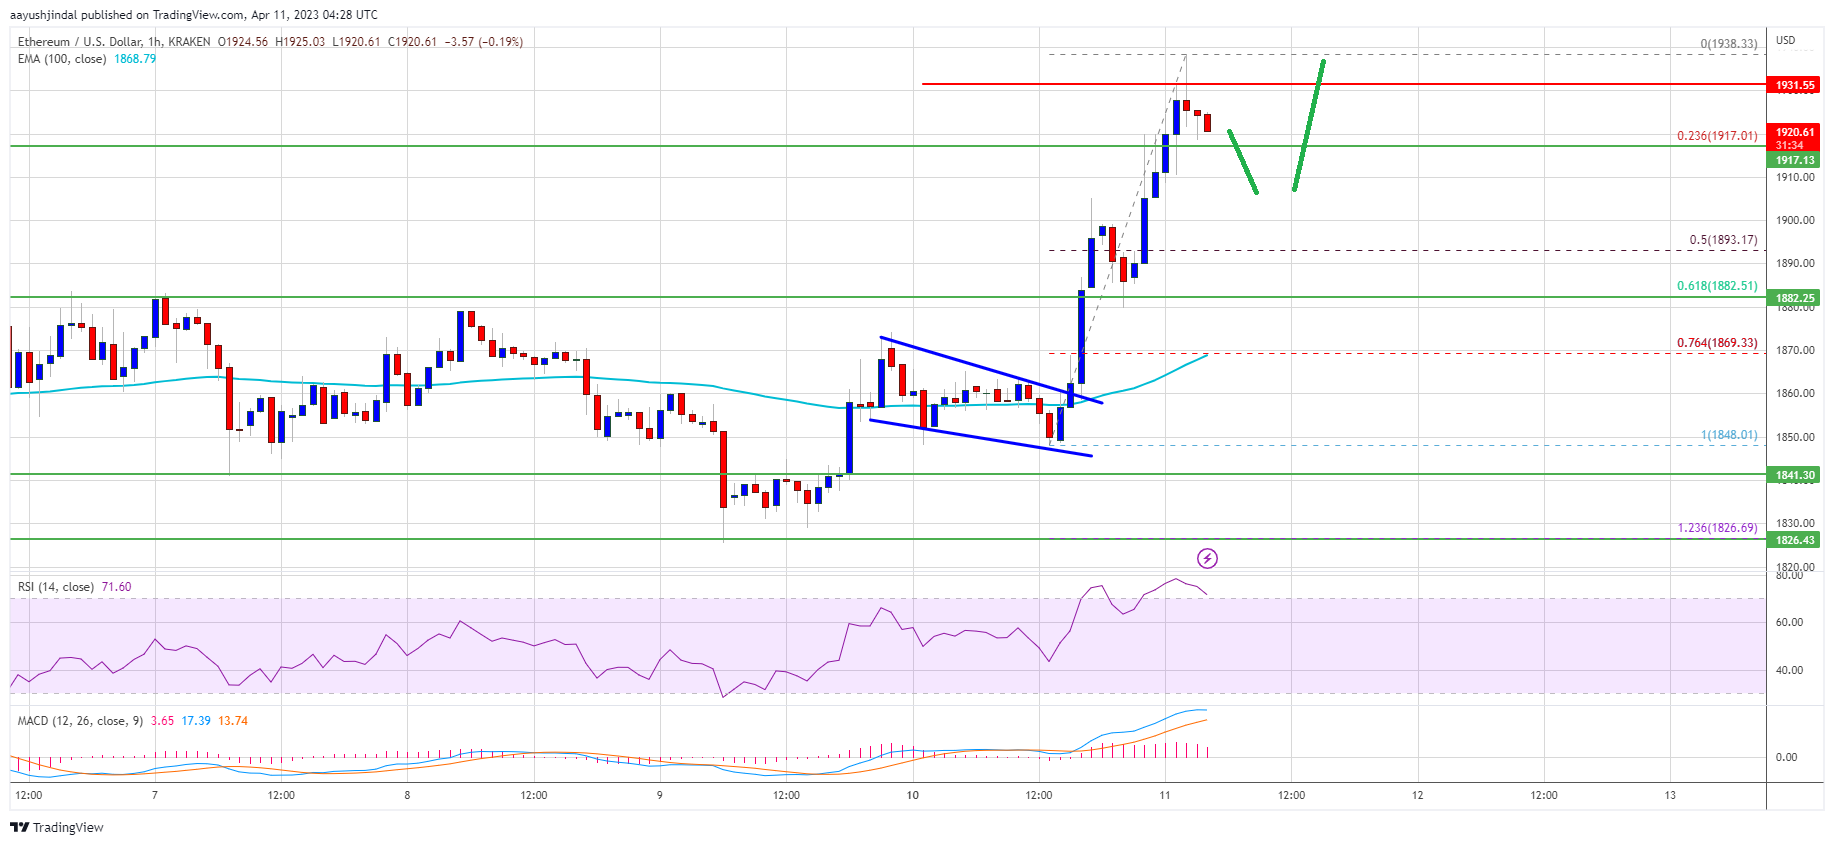
Besides, there was a break above a bullish pattern with resistance near $1,860 on the hourly chart of ETH/USD. The pair even spiked above the $1,925 resistance zone but the bears were active below $1,950. A high is formed near $1,938 and the price is now showing signs of rejection.
Ether price is still trading above $1,850 and the 100-hourly Simple Moving Average. It is slowly approaching the 23.6% Fib retracement level of the recent rally from the $1,848 swing low to the $1,938 high.
Source: ETHUSD on TradingView.com
On the upside, the price is facing resistance near the $1,925 level. The next major resistance is near the $1,940 zone. A clear move above the $1,940 resistance zone might send the price toward the $2,000 resistance. The next major resistance might be $2,120. Any more gains could set the pace for a test of the $2,200 resistance.
Fresh Drop in ETH?
If Ethereum fails to clear the $1,925 resistance, it could start a downside correction. Initial support on the downside is near the $1,900 level.
The next major support is near the $1,880 zone or the 61.8% Fib retracement level of the recent rally from the $1,848 swing low to the $1,938 high, below which ether price might decline toward the $1,850 level. The next key support is near the $1,840 zone. If there is a break below $1,840, the price might extend its decline toward $1,780.