Bitcoin price is trying to recover over the weekend but the current bounce lacks conviction. This suggests that dip buyers are nervous to load up before the release of January’s consumer price index data on Feb. 14 as that could boost short-term volatility.
Although the near term is uncertain, analysts at Delphi Digital expect the United States Federal Reserve to pivot to an accommodative policy later in the year and that could be favorable for risk assets.
Another bullish projection came from Pantera Capital CEO Dan Morehead who said that Bitcoin’s “seventh bull cycle” may have begun. Morehead highlighted that the decline from November 2021 to November 2022 lasted 376 days and that BTC price witnessed a 77% drawdown, in line with the median downdraft of 307 days and a median drawdown of 73% seen during earlier bear markets.
The analysts seem to be turning positive on Bitcoin for the long term but the near term remains uncertain.
Let’s study the charts of Bitcoin and select altcoins to spot the critical levels to watch out for.
BTC/USDT
Bitcoin nosedived to the strong support at $21,480 on Feb. 10. The zone between the 50-day simple moving average ($20,347) and $21,480 is likely to attract aggressive buying by the bulls.
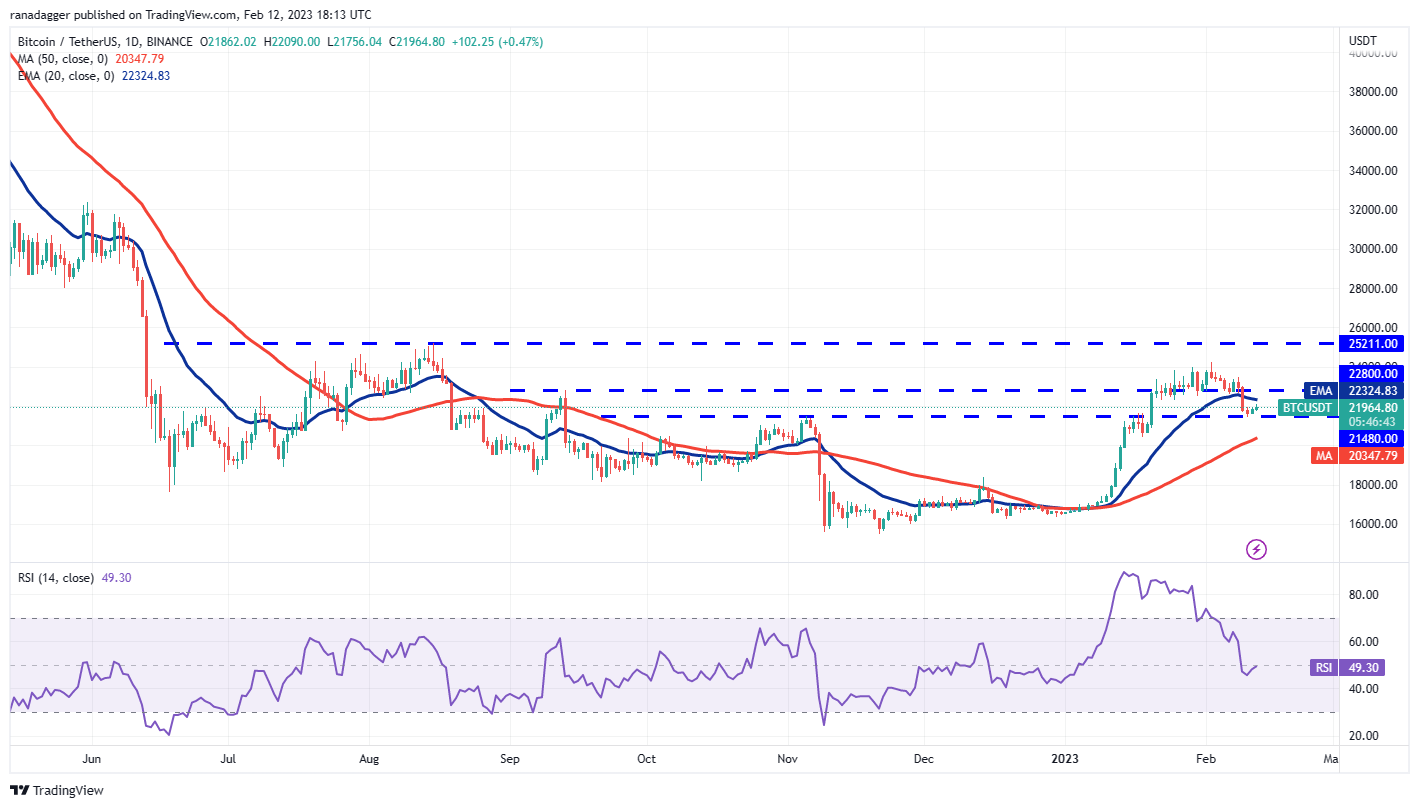
The first hurdle on the upside is the 20-day exponential moving average ($22,347). This needs to be crossed to suggest that bulls are back in the driver’s seat. There is a minor hurdle at $22,800 but if that is scaled, the BTC/USDT pair could retest $24,255.
The bears are expected to defend the $24,255 to $25,211 zone with all their might because if this obstacle is surpassed, the pair could signal a potential trend change.
Conversely, if the price slumps below the 50-day SMA, it will suggest that bears are back in the game. The pair could then revisit the vital support zone between $18,000 and $16,000.
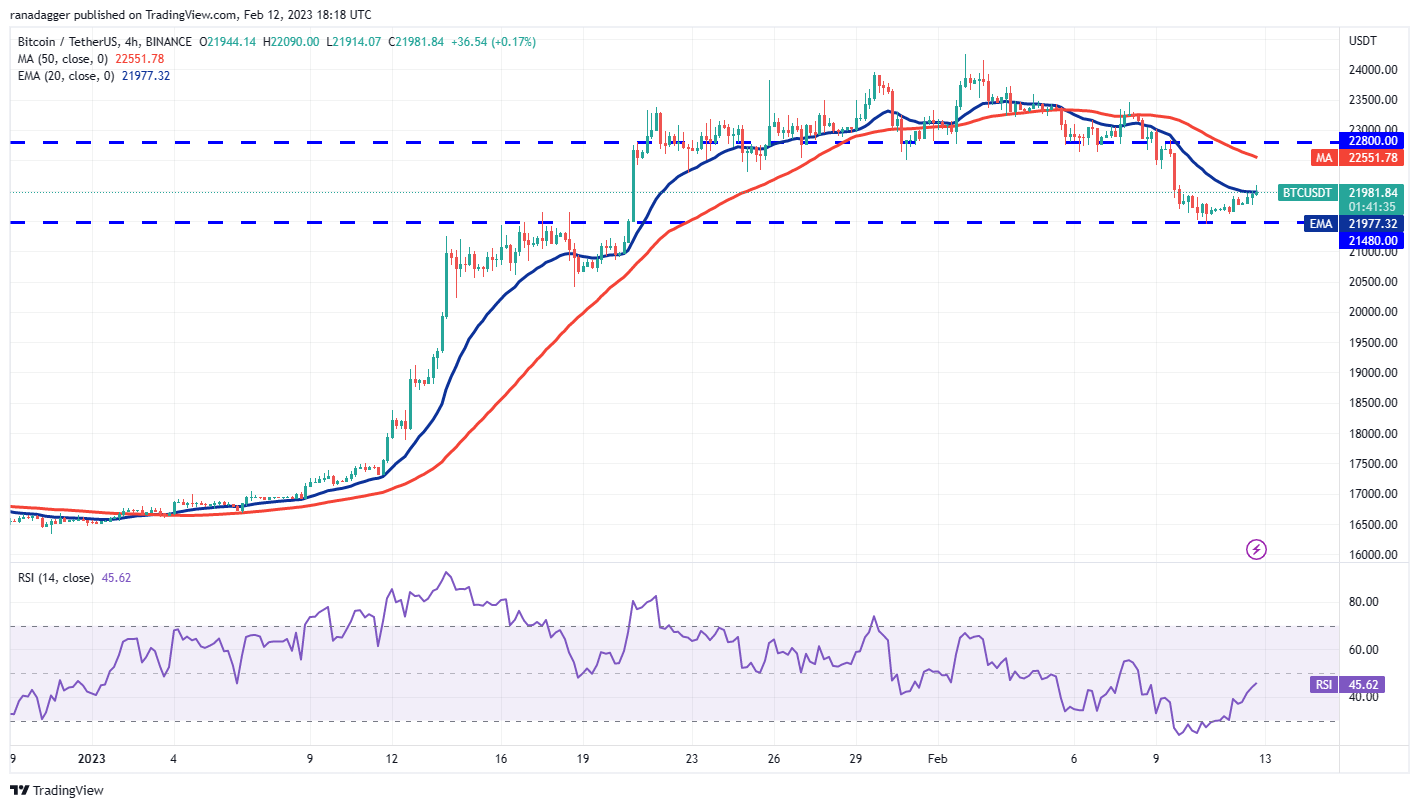
The 4-hour chart shows that the bulls are trying to start a rebound off $21,480 but are facing selling near the 20-EMA. If the price turns down from the current level and breaks below $21,480, the bears may attack the $20,000 psychological level with vigor.
The 20-EMA is flattening out and the relative strength index (RSI) is gradually rising toward the midpoint. This indicates that the short-term selling pressure may be easing.
If buyers drive the price above the 20-EMA, the pair could rise to $22,800 where the bears may mount a strong defense.
MATIC/USDT
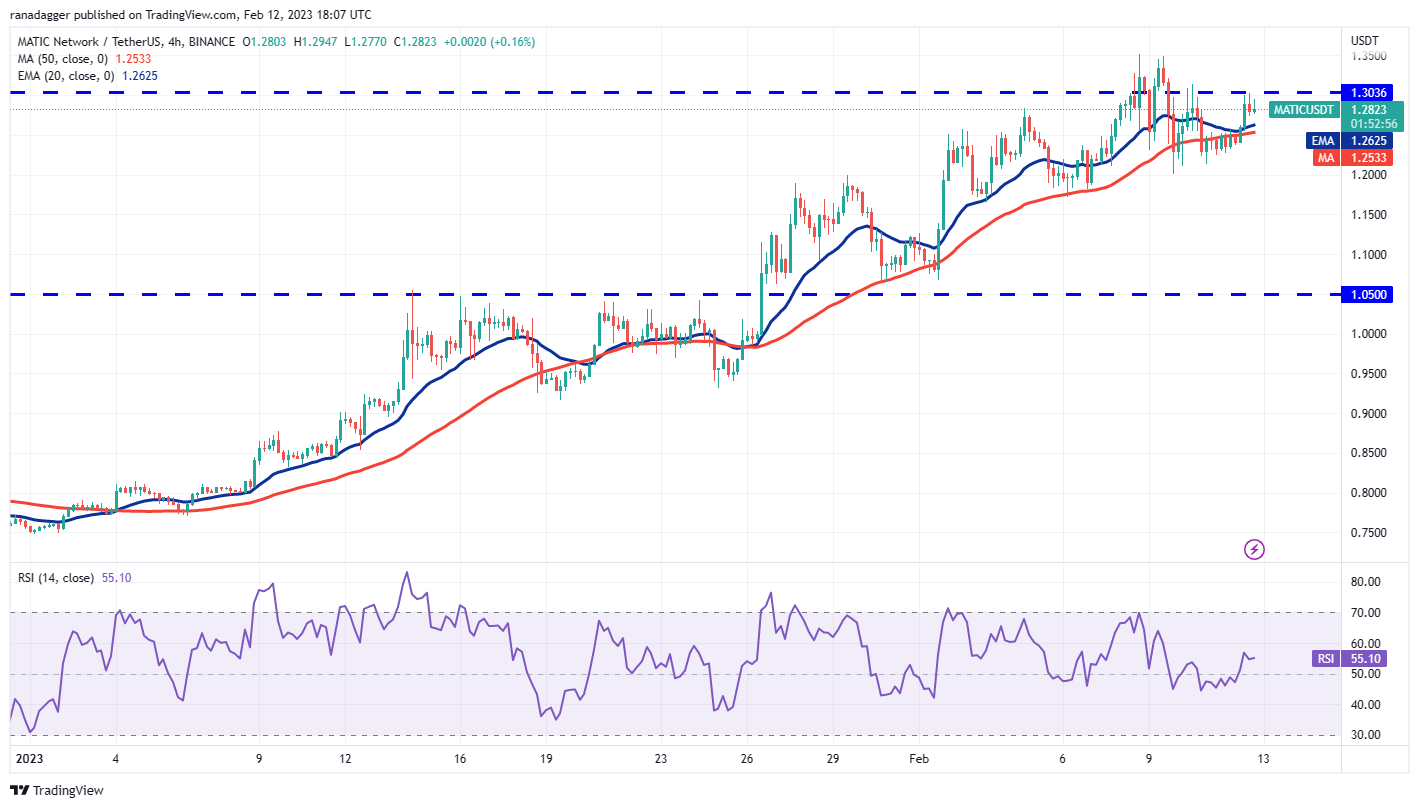
Polygon only witnessed a shallow pullback in the past few days, signaling that traders are not exiting their positions in a hurry and are buying on minor dips.
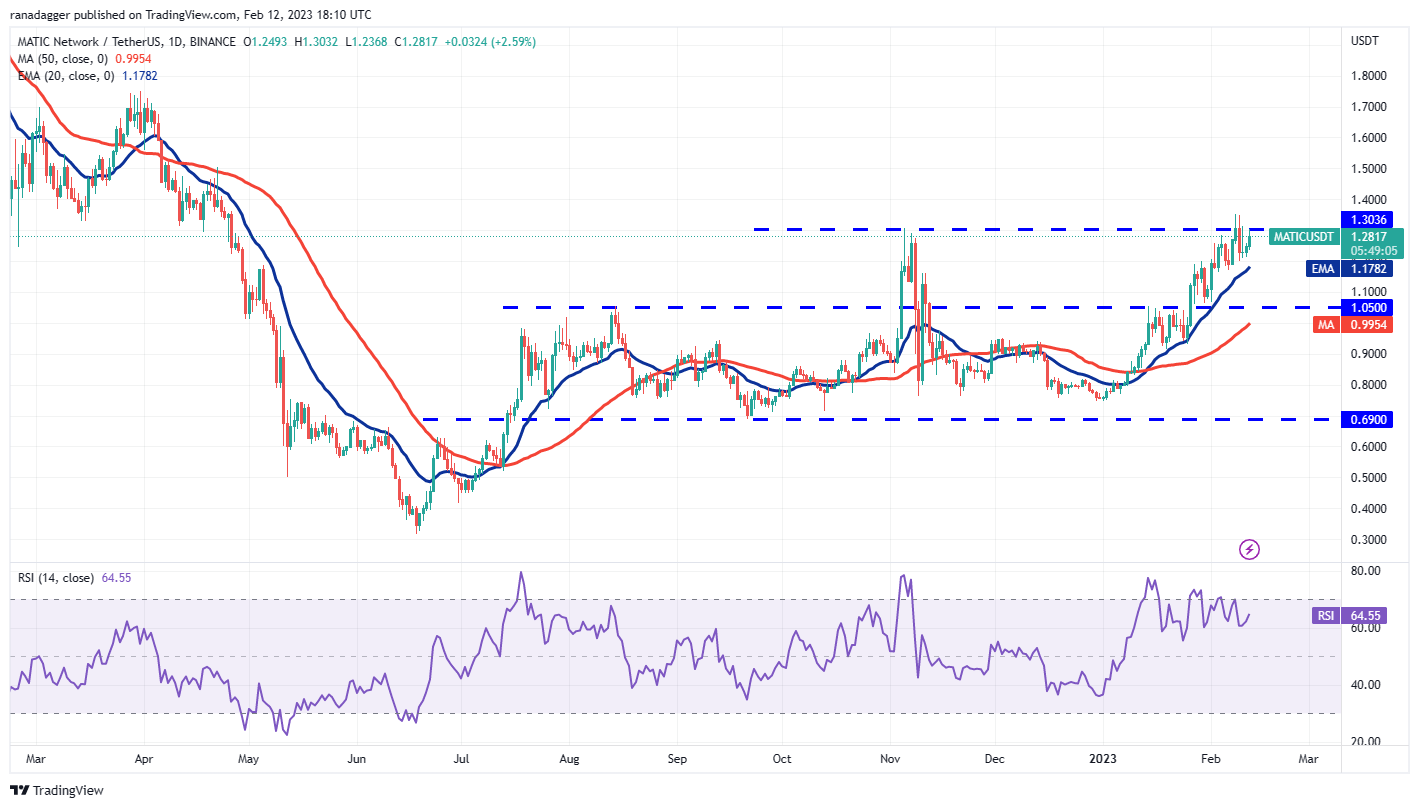
The upsloping moving averages indicate that bulls are in control. The negative divergence on the RSI is a matter of concern but a positive sign is that the bears have not been able to yank the price below the 20-day EMA ($1.17).
That enhances the prospects of a break above the overhead zone between $1.30 and $1.35. If bulls succeed in their endeavor, the MATIC/USDT pair could start an up-move to $1.50 and thereafter to $1.70.
The first sign of weakness will be a break and close below the 20-day EMA. That clears the path for a potential drop to $1.05.
The 4-hour chart shows that bears are offering formidable resistance in the $1.30 to $1.35 range but a positive sign is that buyers have not ceded much ground to the bears. This suggests that the bulls anticipate a move higher. If they thrust the price above $1.35, the pair could start the next leg of the uptrend.
If bears want to seize control in the near term, they will have to sink the price below $1.20. That could increase the possibility of a drop to $1.05. There is a minor support near $1.15 but that may not hold.
HBAR/USDT
Most major cryptocurrencies are retracing their recent rallies but Hedera Hashgraph has outperformed in the near term and broken out of the overhead resistance at $0.08.
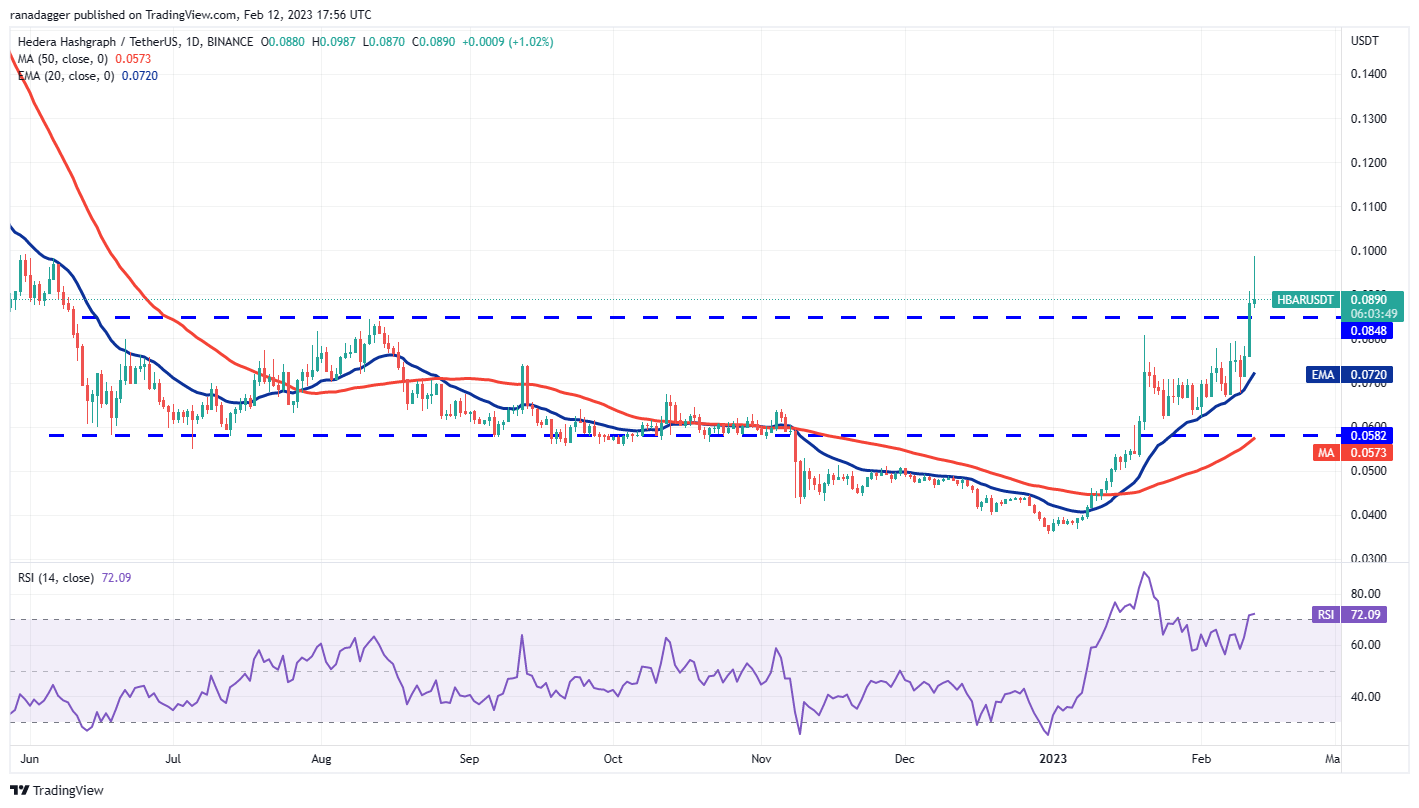
The 20-day EMA ($0.07) is sloping up and the RSI is in the overbought territory, indicating that bulls are in command. However, the long wick on the Feb. 12 candlestick shows selling at higher levels.
The HBAR/USDT pair could witness a tough battle near the breakout level of $0.08. If bulls defend this level and flip it into support, the pair may start a new up-move toward $0.11. If that level is also scaled, the up-move could extend to $0.15.
Conversely, if the price plummets below the breakout level, it will indicate that bears continue to sell on rallies. The pair could then tumble to the 20-day EMA.
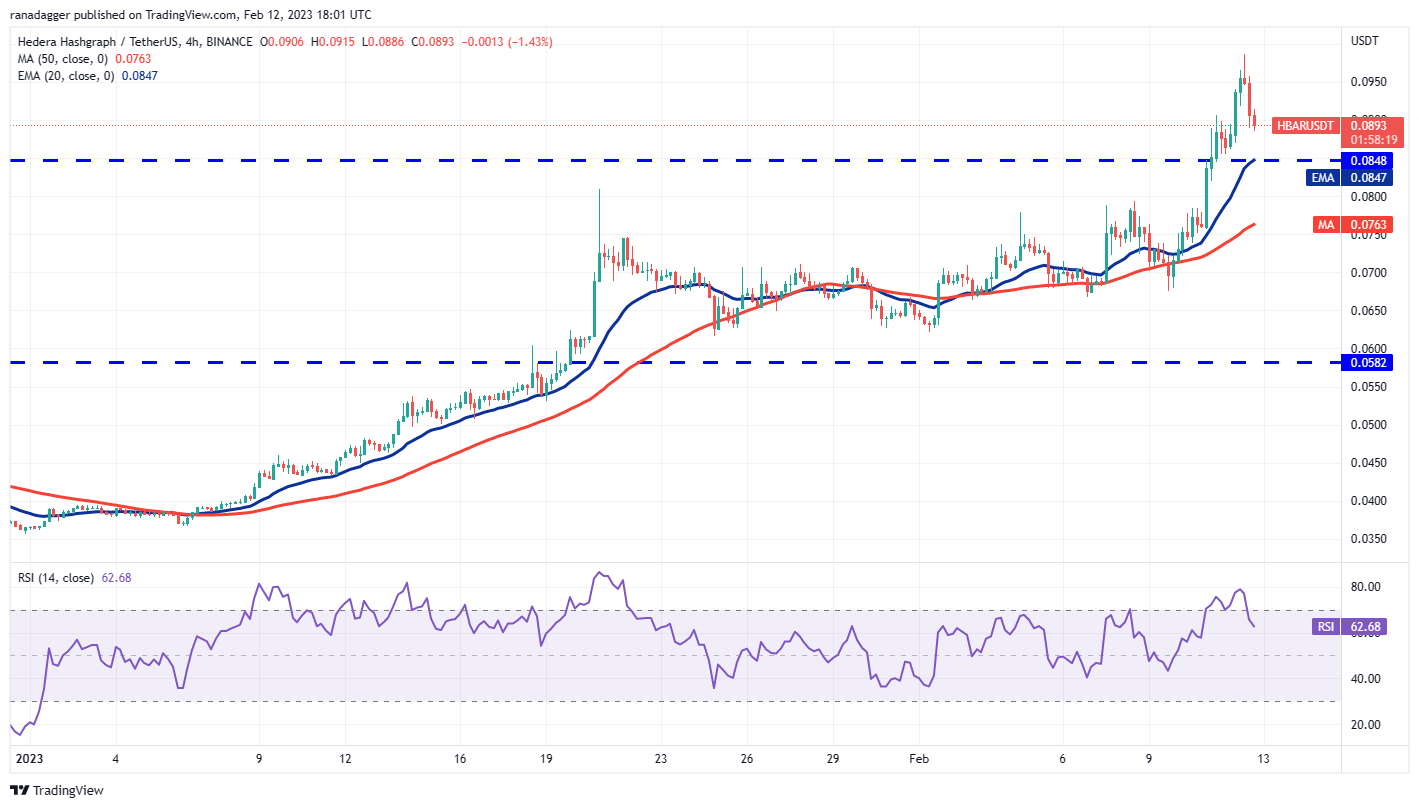
The 4-hour chart suggests that traders are booking profits near the psychological resistance at $0.10. The pair could pull back toward the 20-EMA, which is close to the breakout level. Buyers are likely to purchase the dip to this level. If they do that, the pair may try to rise above $0.10 and resume the up-move.
Contrarily, if the price dives below $0.08, it may trap several aggressive bulls. That could result in long liquidation and a decline to $0.07. The deep correction may delay the start of the next leg of the up-move.
LDO/USDT
LidoDAO (LDO) has been volatile in the past few days but a positive sign is that the bulls have successfully defended the 20-day EMA ($2.32). This indicates that the sentiment remains positive and traders are buying the dips.
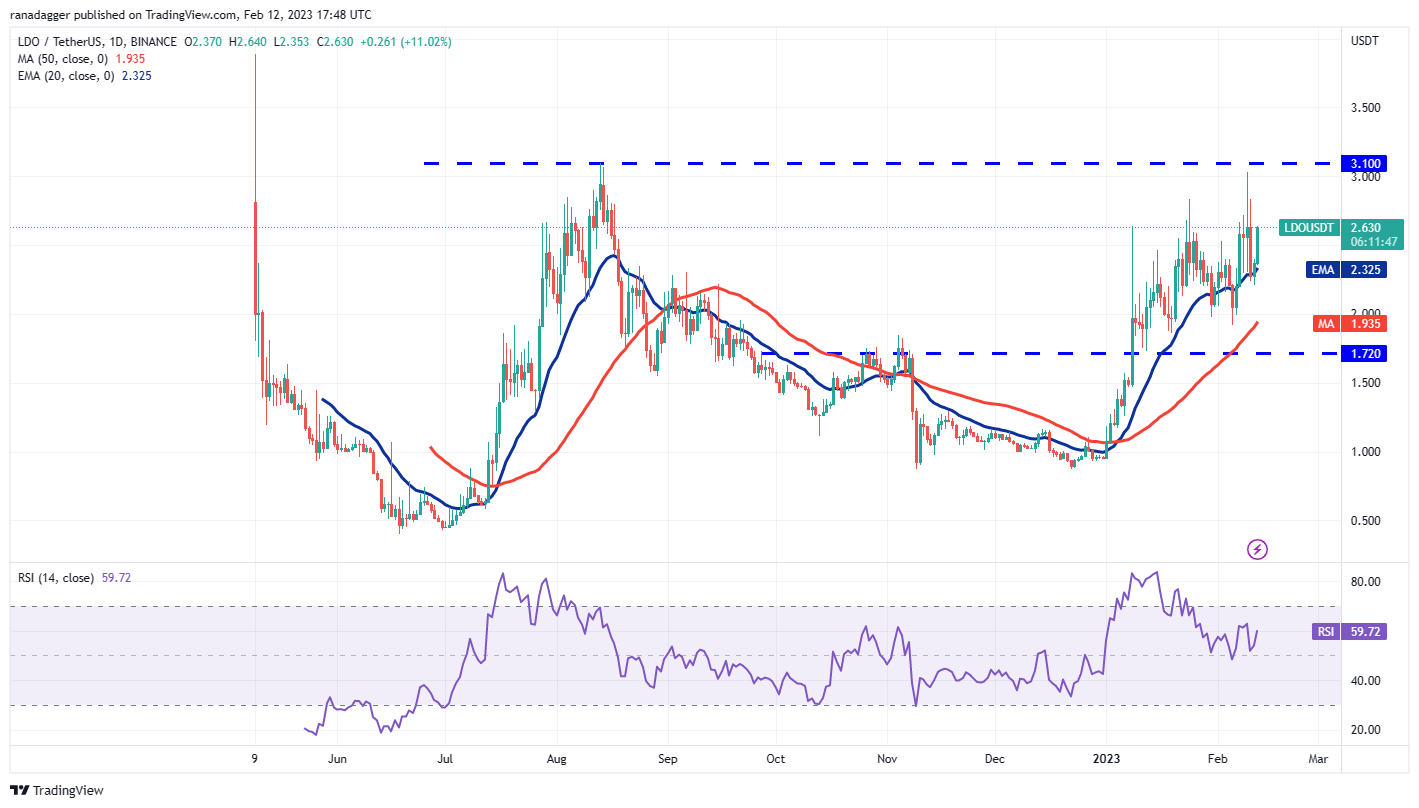
Buyers will next try to propel the price to the solid overhead resistance at $3. This level is likely to attract aggressive selling by the bears because if they allow $3 to be pierced, the LDO/USDT pair may pick up momentum and surge toward $4. The gradually upsloping 20-day EMA and the RSI in the positive territory, indicate that buyers have the edge.
On the contrary, if the price turns down and breaks below the 20-day EMA, it will suggest that the pair may oscillate between $3 and $1.72 for a few days.
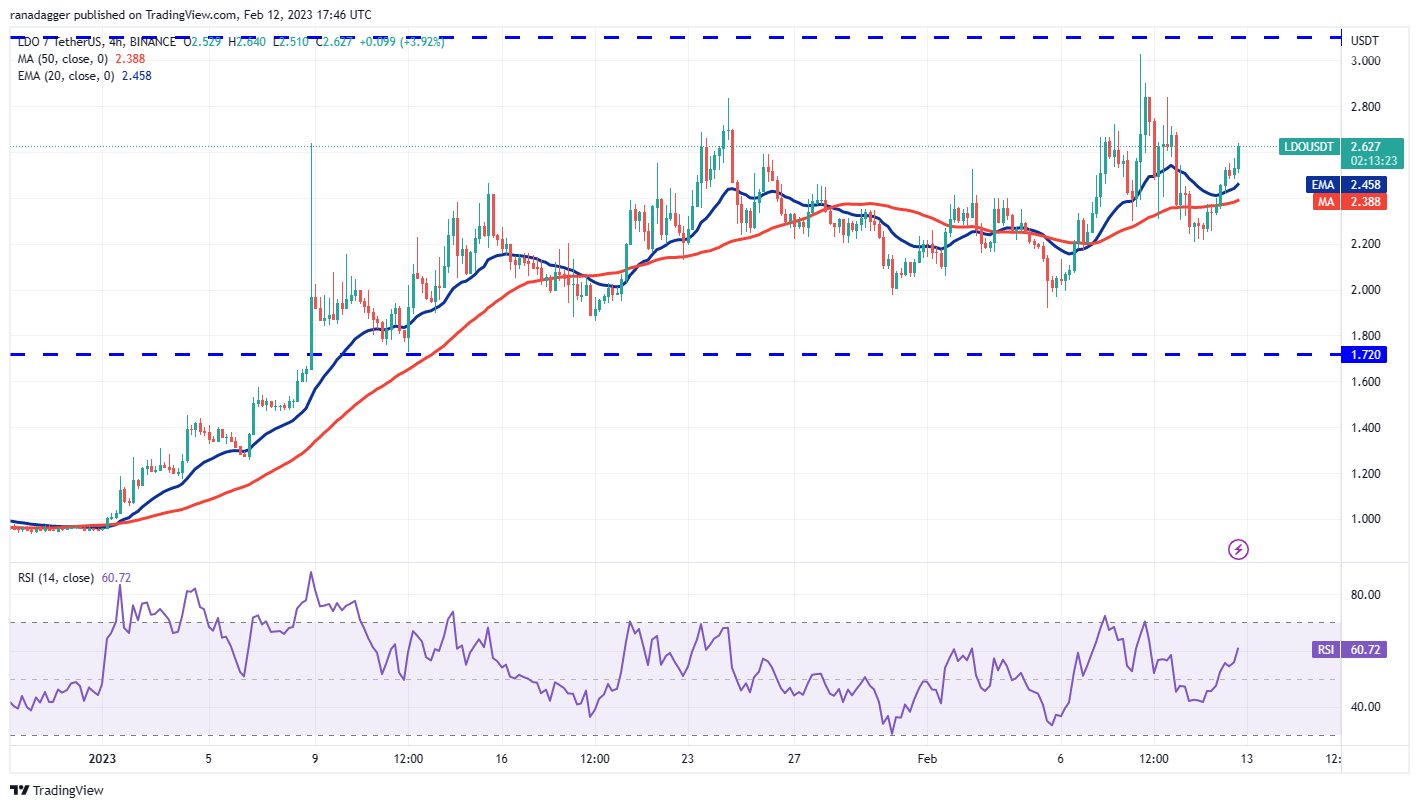
The price broke below the 50-SMA but the bears could not build upon this momentum and sink the pair to the immediate support at $2. Buyers purchased the dip to $2.20 and pushed the price back above the moving averages. The pair could rise to $2.80 and thereafter to $3.
Sellers are likely to have other plans. They will try to pull the price back below the moving averages and retest the support at $2.20. If this level cracks, the pair could drop to $2. Such a move will point to a possible range-bound action in the near term.
BIT/USDT
While several cryptocurrencies have given back a part of their recent gains, BitDAO (BIT) has managed to remain above its immediate support at the 20-day EMA (0.55). This suggests that the bulls are not hurrying to book profits.
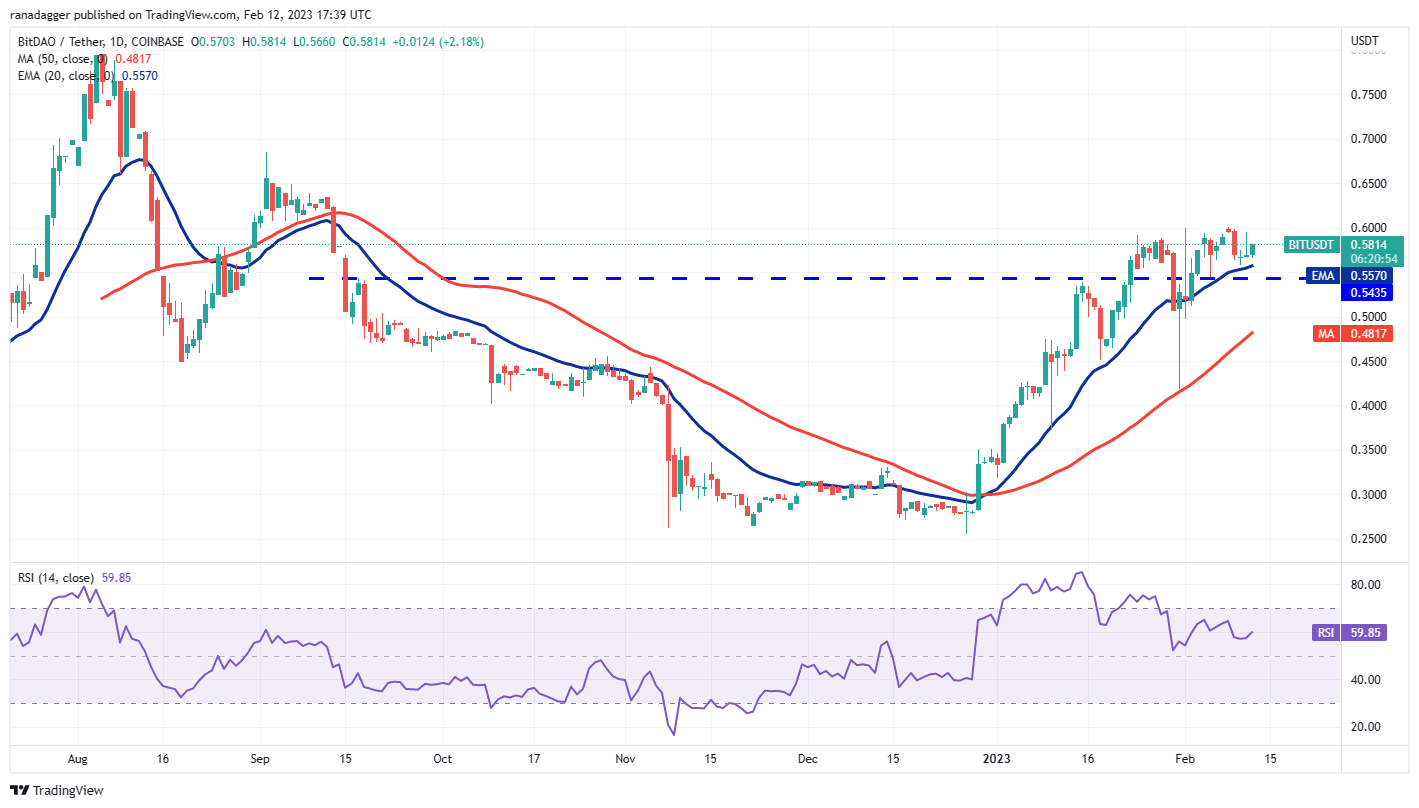
The BIT/DAO pair is not out of danger yet because the long wick on the Feb. 11 candlestick shows that bears are selling on rallies near $0.60. The bears will again try to sink and sustain the price below the 20-day EMA. If they can pull it off, the pair could extend its pullback to the 50-day SMA ($0.48).
Conversely, if the price rebounds off the 20-day EMA, the bulls will again take a shot at the $0.60 resistance. A break and close above this level will signal the resumption of the uptrend. The pair may then rise to $0.65 and then to $0.69.
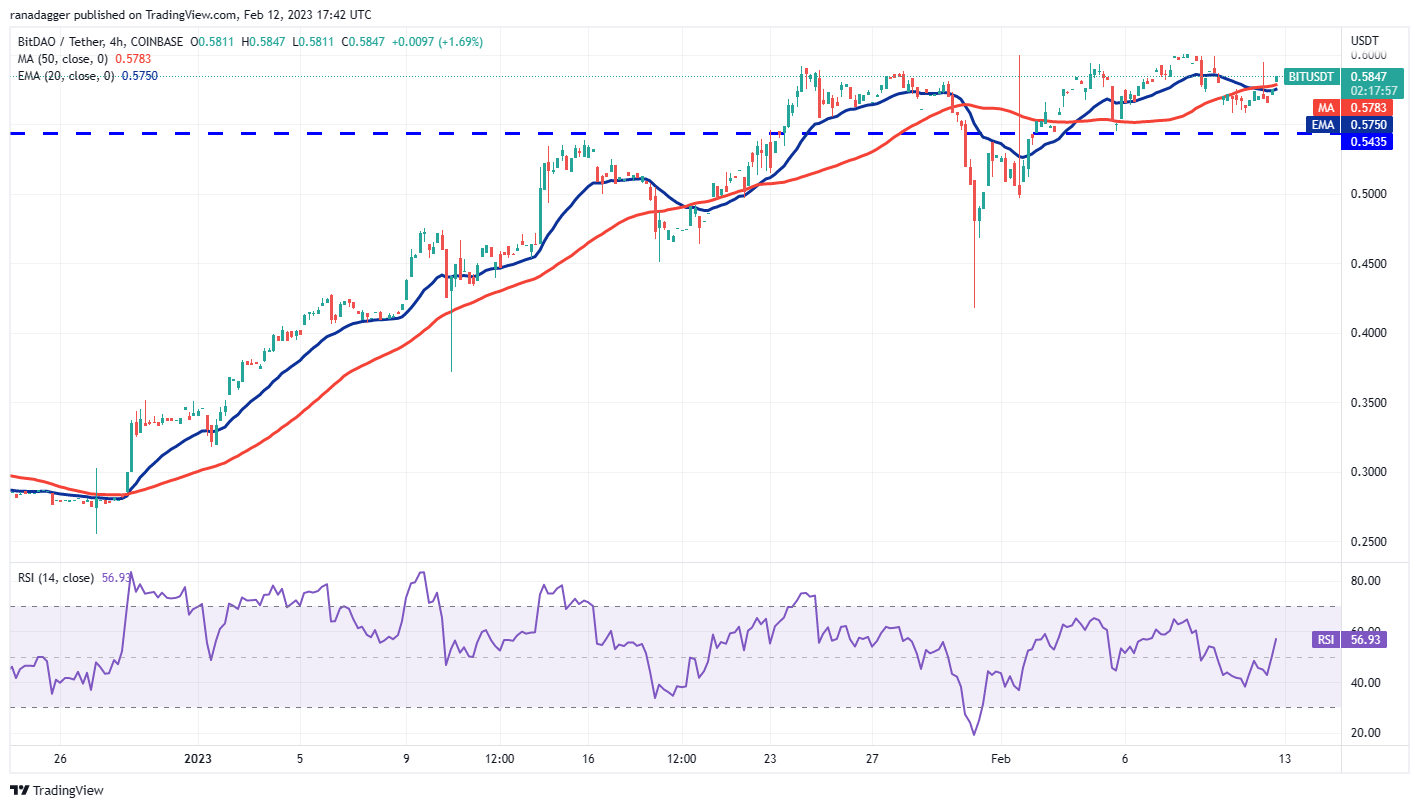
The 4-hour chart shows that the pair is stuck between the support at $0.54 and the resistance at $0.60. Both moving averages are flattening out and the RSI is near the midpoint, indicating a balance between supply and demand.
Usually, a consolidation above crucial support is a positive sign and that increases the likelihood of the continuation of the up-move. If bulls push the price above $0.60, the up-move may resume.
The bears will gain the upper hand if the price plummets below $0.54. That could open the doors for a possible drop to $0.50 and then to $0.46.