S&P 500 Falls for Third Consecutive Day, Dollar Breaks Through 13-Month High, Gold Dips Below 4000, Oil Below 70, Bitcoin Below 60000 Mark, Micron and Qualcomm Spark Major Chip Stock Rebound

华尔街日报Xuất bản vào 2026-06-25Cập nhật gần nhất vào 2026-06-25

Tóm tắt

U.S. stocks were mixed, with the S&P 500 falling for a third consecutive session as tech weakness offset gains in other sectors. The Nasdaq underperformed, with the AI semiconductor sector plunging nearly 10%. Micron and Qualcomm, however, sparked a major after-hours rally in chip stocks, with Micron surging over 16% on a strong earnings report and outlook driven by AI-related memory demand. The dollar rose to a 13-month high, pressuring dollar-denominated assets. Gold tumbled below $4,000 per ounce, and oil prices crashed, with WTI crude falling below $70 a barrel to its lowest level since before the Iran conflict, as geopolitical risk premiums faded with improved Middle East supply flows. Bitcoin briefly fell below the $60,000 mark. Treasury yields dropped sharply, with the 10-year yield falling 9 basis points, supported by the drop in oil prices easing inflation concerns. Market focus now turns to upcoming PCE inflation data for further direction on Fed policy.

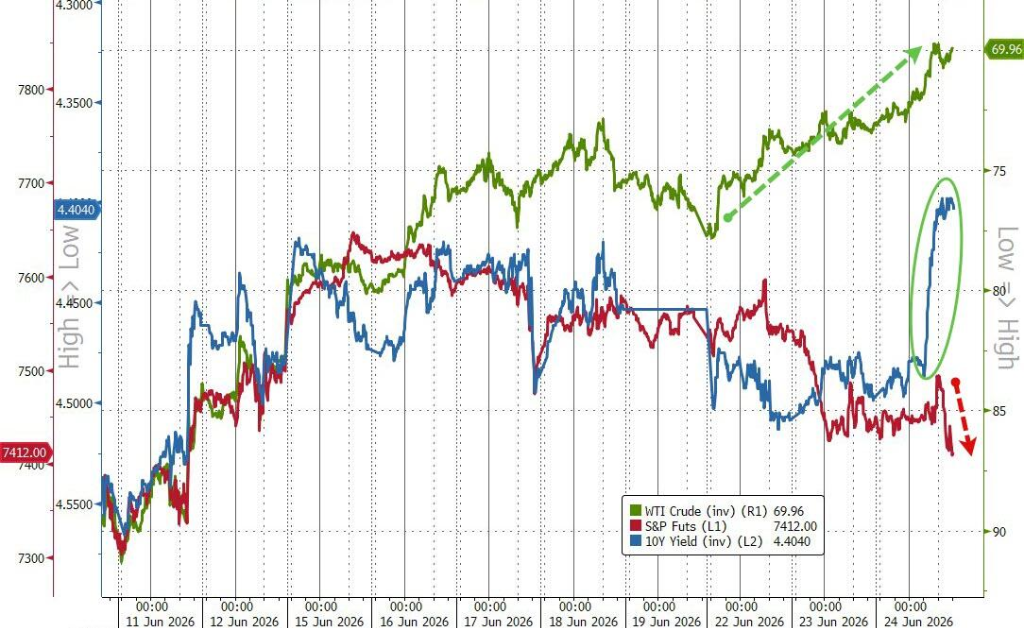
The weakness in the tech sector led to mixed intraday performance for major U.S. stock indices. Oil prices fell to their lowest level since the outbreak of the Iran war, and the fading inflation risk premium pushed the 10-year U.S. Treasury yield down by 9 basis points in a single day.

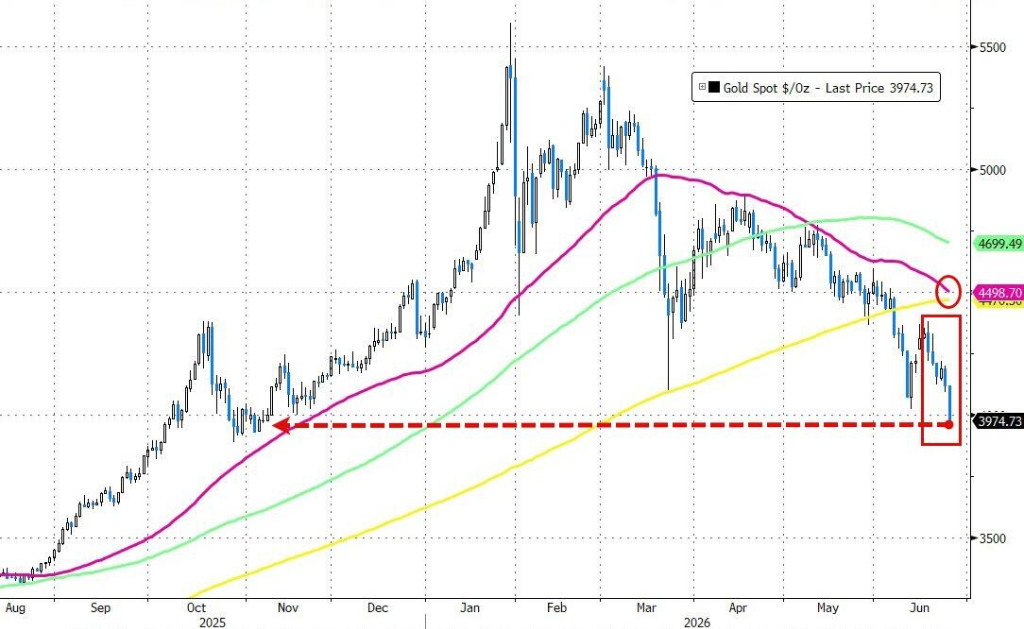
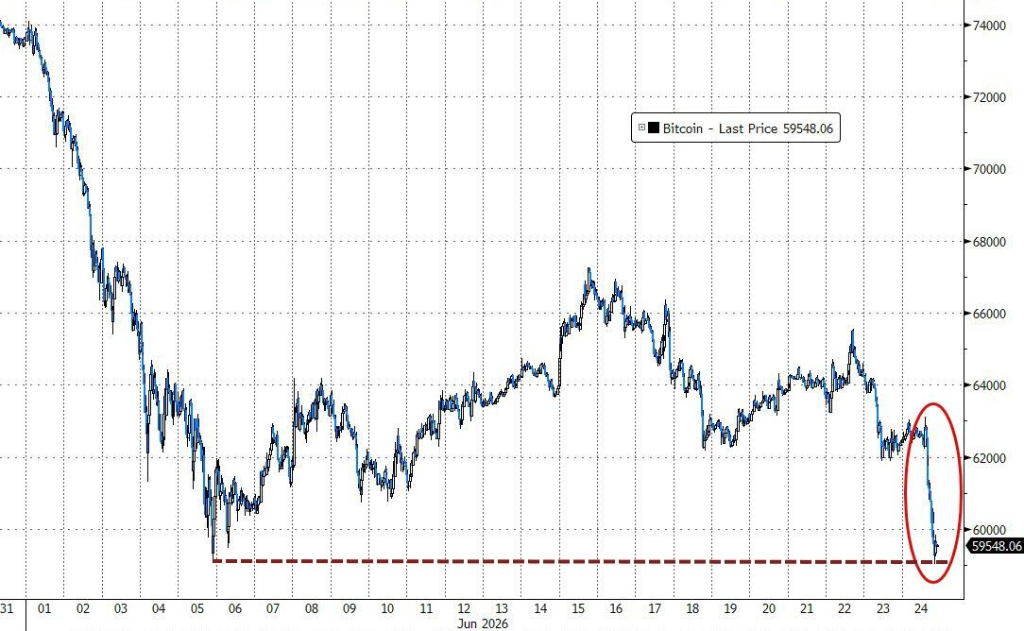
The dollar broke through a 13-month high, weighing heavily on the commodity markets. Gold prices briefly fell below $4000, oil dropped below $70, and Bitcoin once dipped below $60,000.

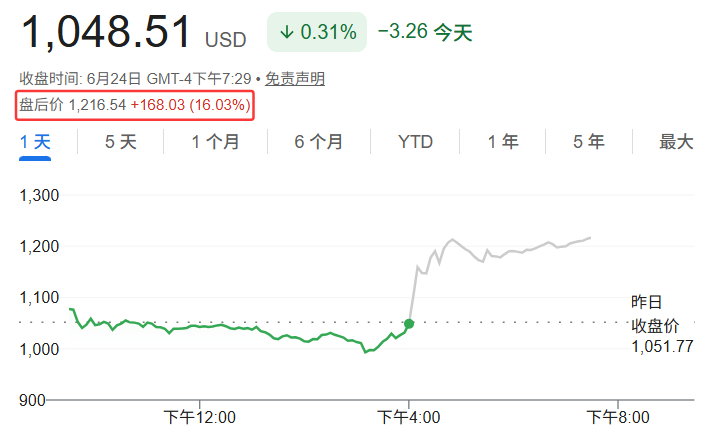
Micron Technology's stock jumped over 16% after-hours as the company reported earnings that beat analyst expectations. An AI-driven shortage of memory chips is driving product prices significantly higher. The Nasdaq 100 ETF rose 1% after-hours.

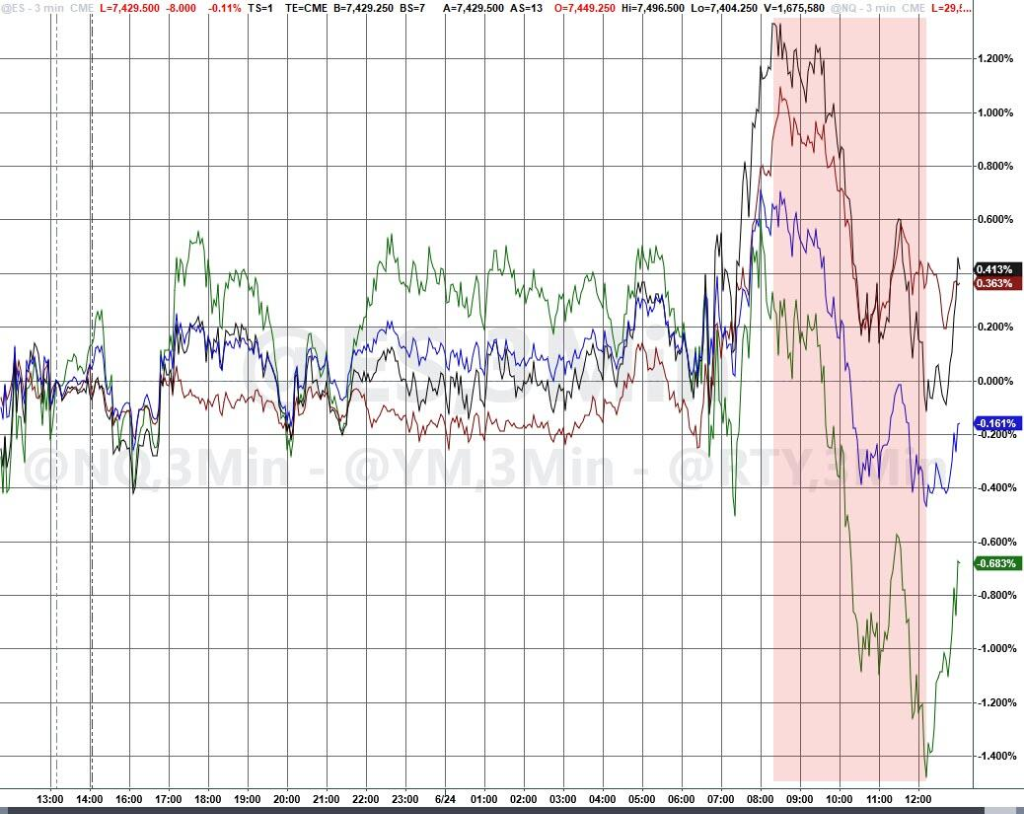
Following an overnight V-shaped recovery in South Korean stocks, the three major U.S. indices initially rose after Wednesday's opening. However, selling pressure began as European markets closed and persisted with each rebound attempt. The Nasdaq experienced the largest decline, while the Dow Jones and the small-cap index barely managed to hold onto gains.

Notably, despite overall index pressure, more than 310 stocks in the S&P 500 closed higher on the day. The 'Magnificent Seven' tech giants underperformed the remaining 493 S&P components, showing a clear "rotation" pattern in the market.

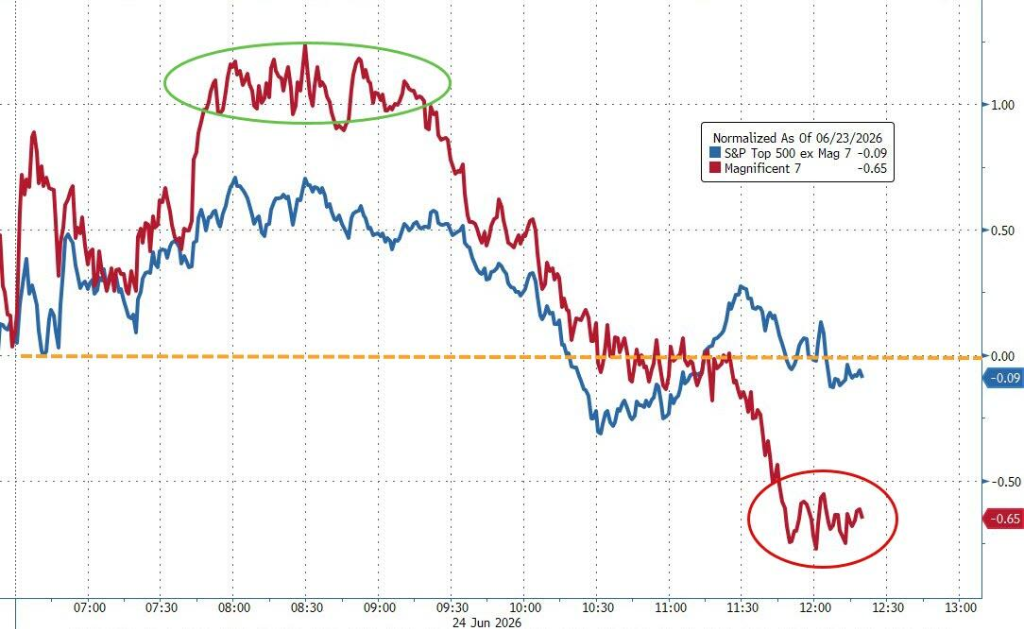
Technology and energy stocks were the biggest drags of the day, while consumer discretionary and industrial sectors relatively outperformed. Over the past two days, the AI "leader" sector has shown notable weakness. The S&P 500 index (excluding the AI sector) actually rose over 1%, while the AI semiconductor sector plummeted nearly 10%.

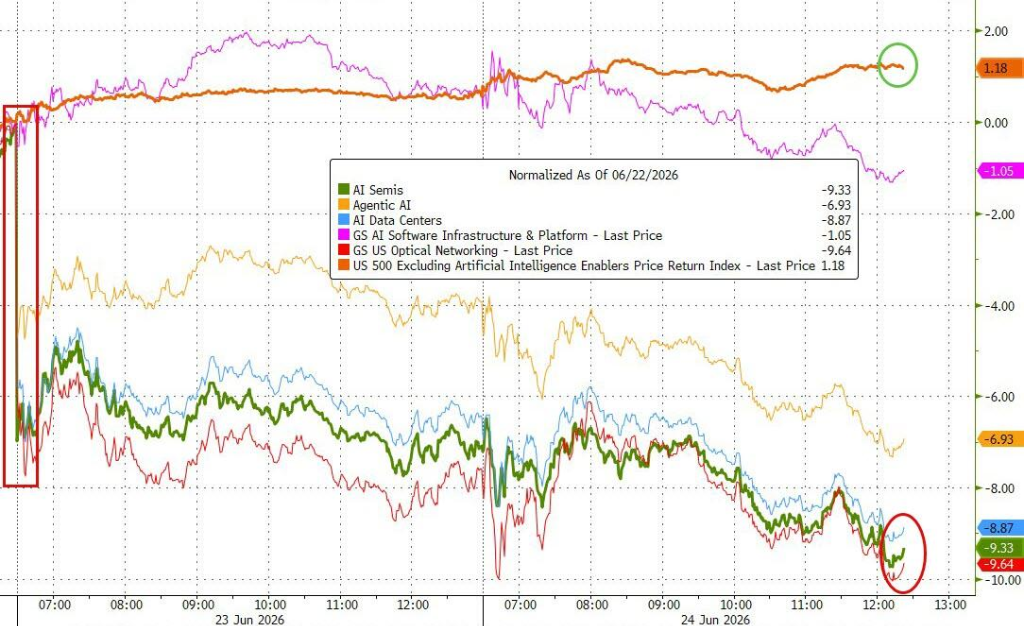
The Philadelphia Semiconductor Index fell 0.82% for the day. Qualcomm dropped over 4%, Arm and Marvell Technology fell over 3%, ON Semiconductor declined over 2%, and Micron Technology also fell 0.81%.

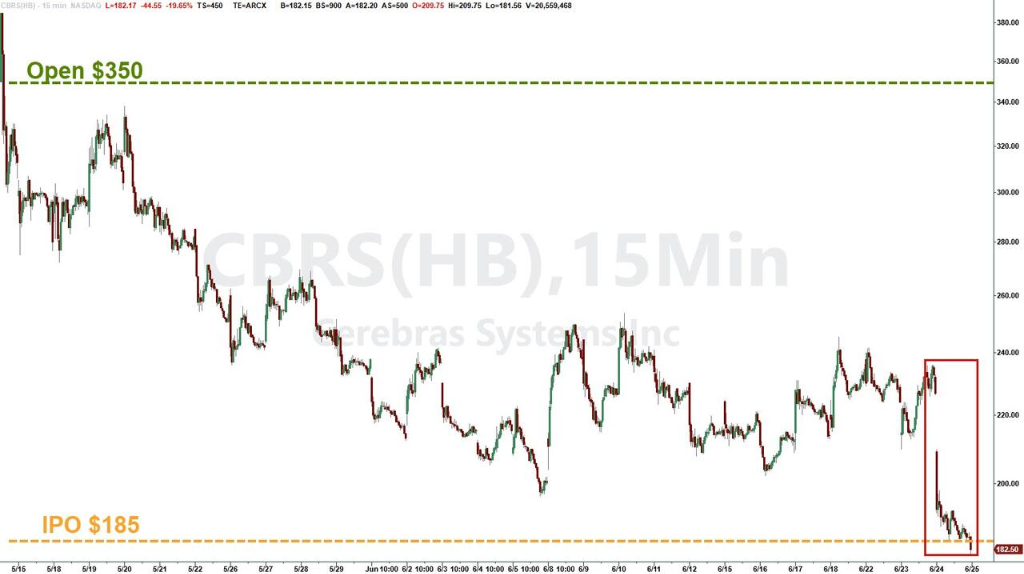
Cerebras Systems plunged about 19%, falling below its IPO issue price after the company forecast its full-year profit margin would be lower than Q1 levels in its first post-IPO quarterly report.

OpenAI announced the launch of its first self-developed AI chip, codenamed "Jalapeño," jointly developed with Broadcom on the same day, further increasing competitive pressure on external chip suppliers.

Mark Hackett of Nationwide believes the recent tech weakness is more of a position adjustment and rotation rather than a fundamental warning signal. Rick Gardner of RGA stated:

Stocks rose too fast and too much; a pullback was almost inevitable. For investors underweight this sector, this correction actually provides a buying opportunity, as the fundamentals of this sector remain strong.

Micron Technology's after-hours report of its fiscal 2026 Q3 (ended May 31) results and guidance became a key variable for whether the market could stabilize.

As mentioned by Wall Street News, Micron's Q3 revenue grew approximately 346% year-over-year to $41.46 billion, about 16% above analyst expectations. Non-GAAP adjusted EPS grew over 12-fold to $25.11, more than 20% above estimates.

Analysts generally believe the guidance is even more important than the quarterly data itself. Micron expects Q4 adjusted revenue between $49 billion and $51 billion, implying record revenue this quarter. The midpoint guidance of $50 billion is 15.6% above analyst expectations.

Nomura pointed out that the implied volatility premium for Micron's earnings in the options market exceeded the market impact of recent Federal Reserve meetings. The options market implied a breakeven volatility range of about ±7% to 8%. If the actual price movement reaches 10% and breaks this range, the market may interpret it as a signal verification of demand in the semiconductor and AI industry chain, potentially triggering broader directional volatility in tech stocks.

In the end, Micron's after-hours sales forecast was comprehensively ahead of market expectations, causing its stock price to jump over 16%, drawing a provisional pause to the tech sell-off of the previous days.

Memory stocks hit highs again after Micron's report, and the rally wasn't limited to Micron or just 16%. Influenced by Micron's results, Qualcomm's stock price also rose over 10%.

At an investor day event on Wednesday, Qualcomm made a series of positive comments on the growth prospects in the AI field. The company stated that its expansion into data center chips would generate "billions of dollars" in revenue in the fiscal year starting in October.

Other U.S. chip stocks also surged after-hours. Memory stocks Western Digital, SanDisk, and Seagate Technology all jumped over 10%.

Arm and Applied Materials rose over 6%, ASML and Intel gained over 4%, AMD climbed over 3%. In early Thursday Asia-Pacific trading, Nasdaq 100 index futures once surged over 2%.

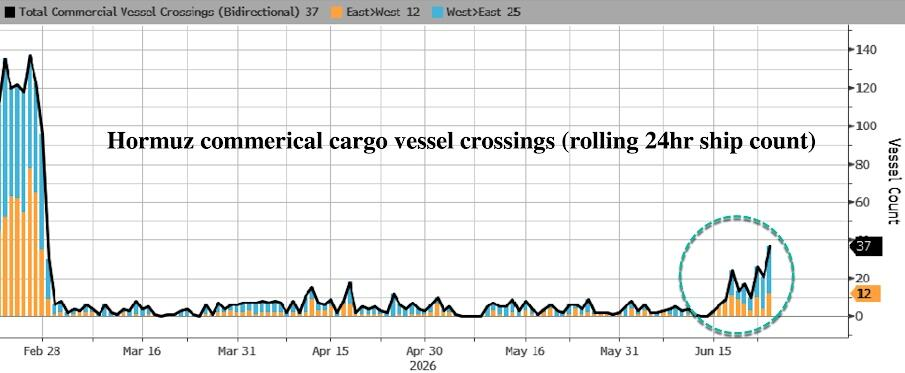
According to International Energy Agency estimates, UAE oil exports have recovered to nearly 85% of pre-war levels, reflecting a significant increase in oil shipments via the Strait of Hormuz in recent weeks.

Just the UAE alone sold about 60 million barrels of crude from within the Persian Gulf in recent weeks. Data shows vessel traffic through the Strait of Hormuz has reached new highs since the signing of the Memorandum of Understanding and continues to rise.

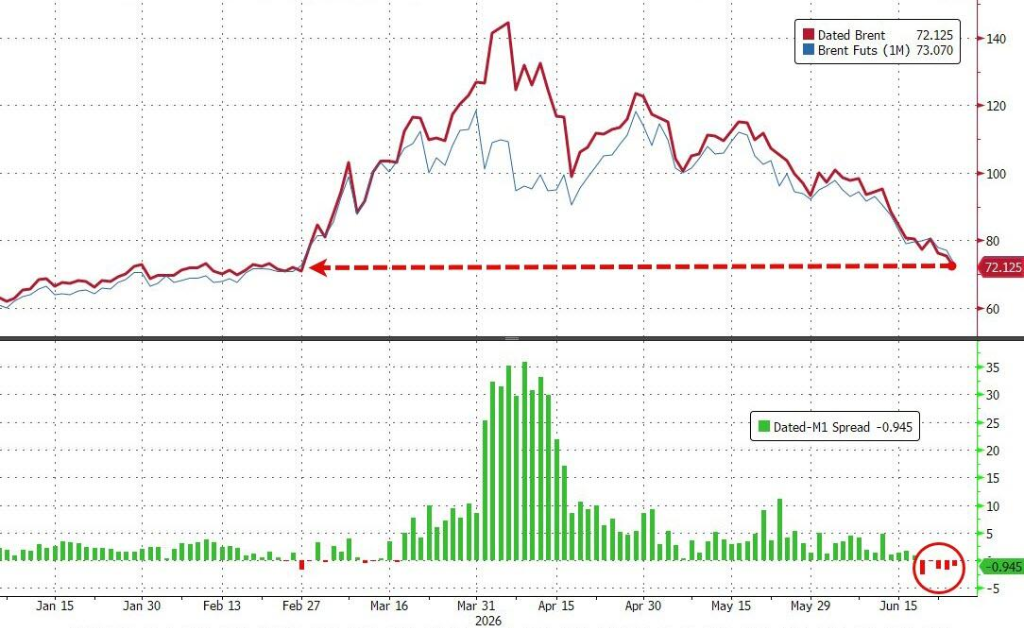
The spot crude market also softened, with premiums for regional crudes relative to benchmarks from the North Sea to West Africa rapidly declining. WTI crude futures broke below $70, touching near pre-war lows, with a daily drop of 4.5%.

Brent crude has largely erased all the geopolitical risk premium accumulated since the outbreak of the Iran war.

On the news front, Trump posted on social media on the 24th, stating Iran had informed the U.S. it would not impose any transit fees, insurance fees, or other charges on vessels passing through the Strait of Hormuz. However, he also threatened that negotiations would terminate immediately if this information was false.

He also revealed the U.S. would unfreeze some Iranian funds for purchasing U.S. agricultural products, but no funds have been unfrozen yet. He told reporters after meeting with Senate Republicans:

I see oil just fell below $70, who would have thought this would happen? And this is during wartime. Iran is behaving very well.

Stephen Innes, Managing Partner at SPI Asset Management, pointed out, "The oil price decline is not because the market believes geopolitical risks have disappeared, but because the improvement in physical flows has been faster than expected."

Options market data shows investors are positioning for further downside in oil, with put option volume exceeding call options. The most actively traded contracts are August and September expiry puts with strike prices between $60 and $68.

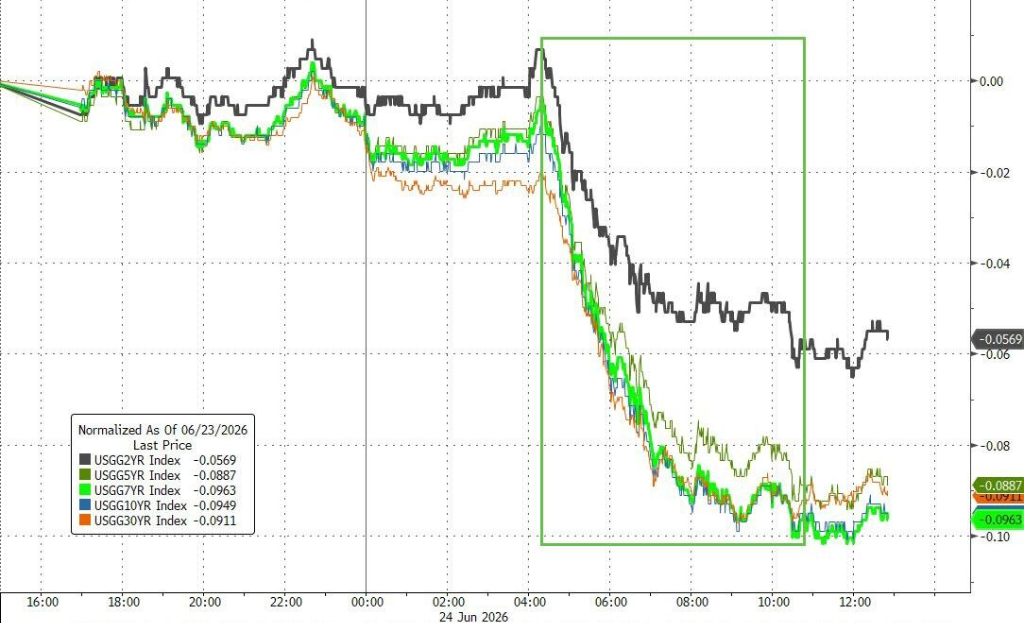
The oil price decline provided a clear boost to the bond market. The 10-year U.S. Treasury yield fell 9 basis points to 4.40%, and the 30-year yield touched 4.85%, its lowest level since April 8th.

The PCE price index release on Thursday will be the next key node. Forecasters expect the May data to show acceleration on both a monthly and yearly basis, providing a new reference for the Federal Reserve's policy direction.

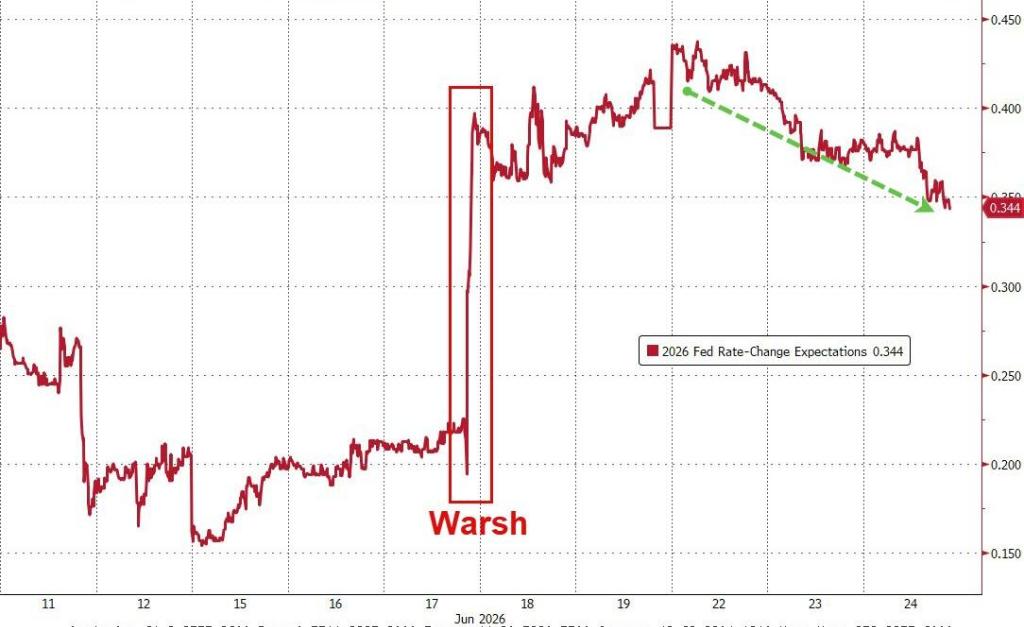
Goldman Sachs Chief Economist Jan Hatzius reiterated that his baseline forecast remains for no rate hike, citing that a lasting peace in the Middle East would create a more moderate inflation environment than the Fed currently expects.

The logic chain for gold's pressure is clear: cooling geopolitical tensions reduce safe-haven demand, rising Fed rate hike expectations support a stronger dollar, and a stronger dollar directly depresses dollar-denominated precious metal assets.

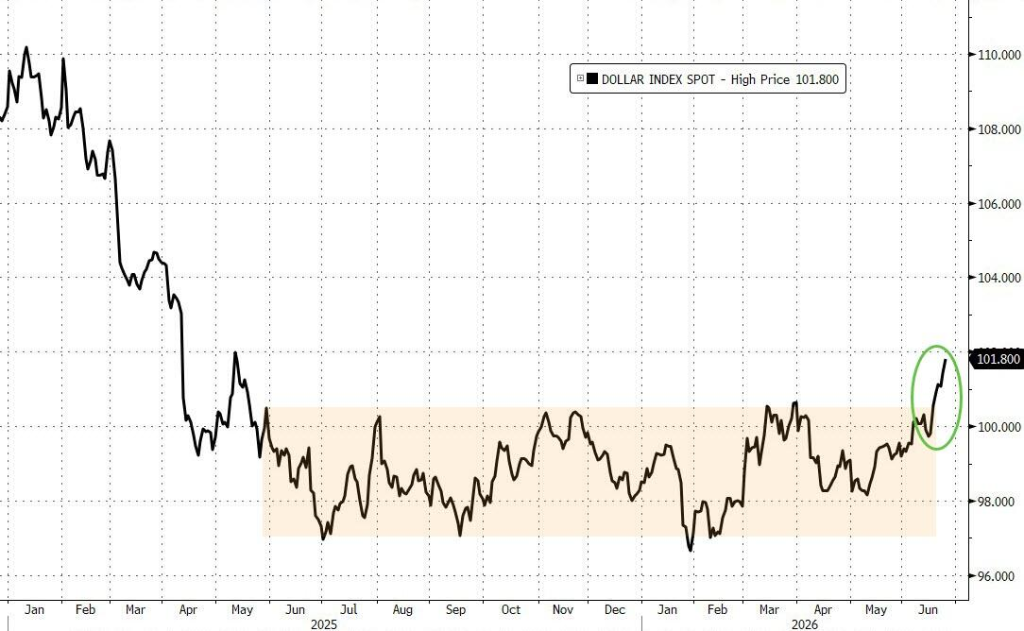
The U.S. Dollar Index (DXY) continued to hit new 13-month highs.

On the policy front, U.S. Treasury Secretary Besant stated on CNBC that negotiations with Iran involved having Iran price its oil and gas exports in dollars, Venezuela is returning to the dollar system, and Russia is expected to return to dollar settlements after the Russia-Ukraine conflict ends. He characterized these developments as part of a broader reshaping of the dollar's global dominance.

Besant also predicted U.S. GDP growth could return to 3% within the year. The strong dollar narrative thus gained policy endorsement, further suppressing gold's attractiveness.

Amid the strong dollar, Bitcoin plunged over 5.3%, once breaking below the $60,000 mark during the session.

Persistent weakness in tech stocks on Wednesday left the S&P 500 essentially flat, with the Nasdaq Composite falling 0.41%, but the Dow Jones Industrial Average rising 0.36%. The Nasdaq Biotech Index and the Regional Bank Index hit record closing highs. Cerebras Systems plunged 19% during the session.

Major U.S. Stock Indices:

  • The S&P 500 Index closed down 7.24 points, or 0.10%, at 7358.22.

  • The Dow Jones Industrial Average closed up 182.06 points, or 0.35%, at 51848.90.

  • The Nasdaq closed down 110.403 points, or 0.43%, at 25476.636. The Nasdaq 100 Index closed down 127.216 points, or 0.43%, at 29220.056.

  • The Russell 2000 Index closed up 0.37% at 2986.629.

  • The VIX Volatility Index closed down 4.31% at 18.65, showing an M-shaped pattern since 00:00 Beijing Time.
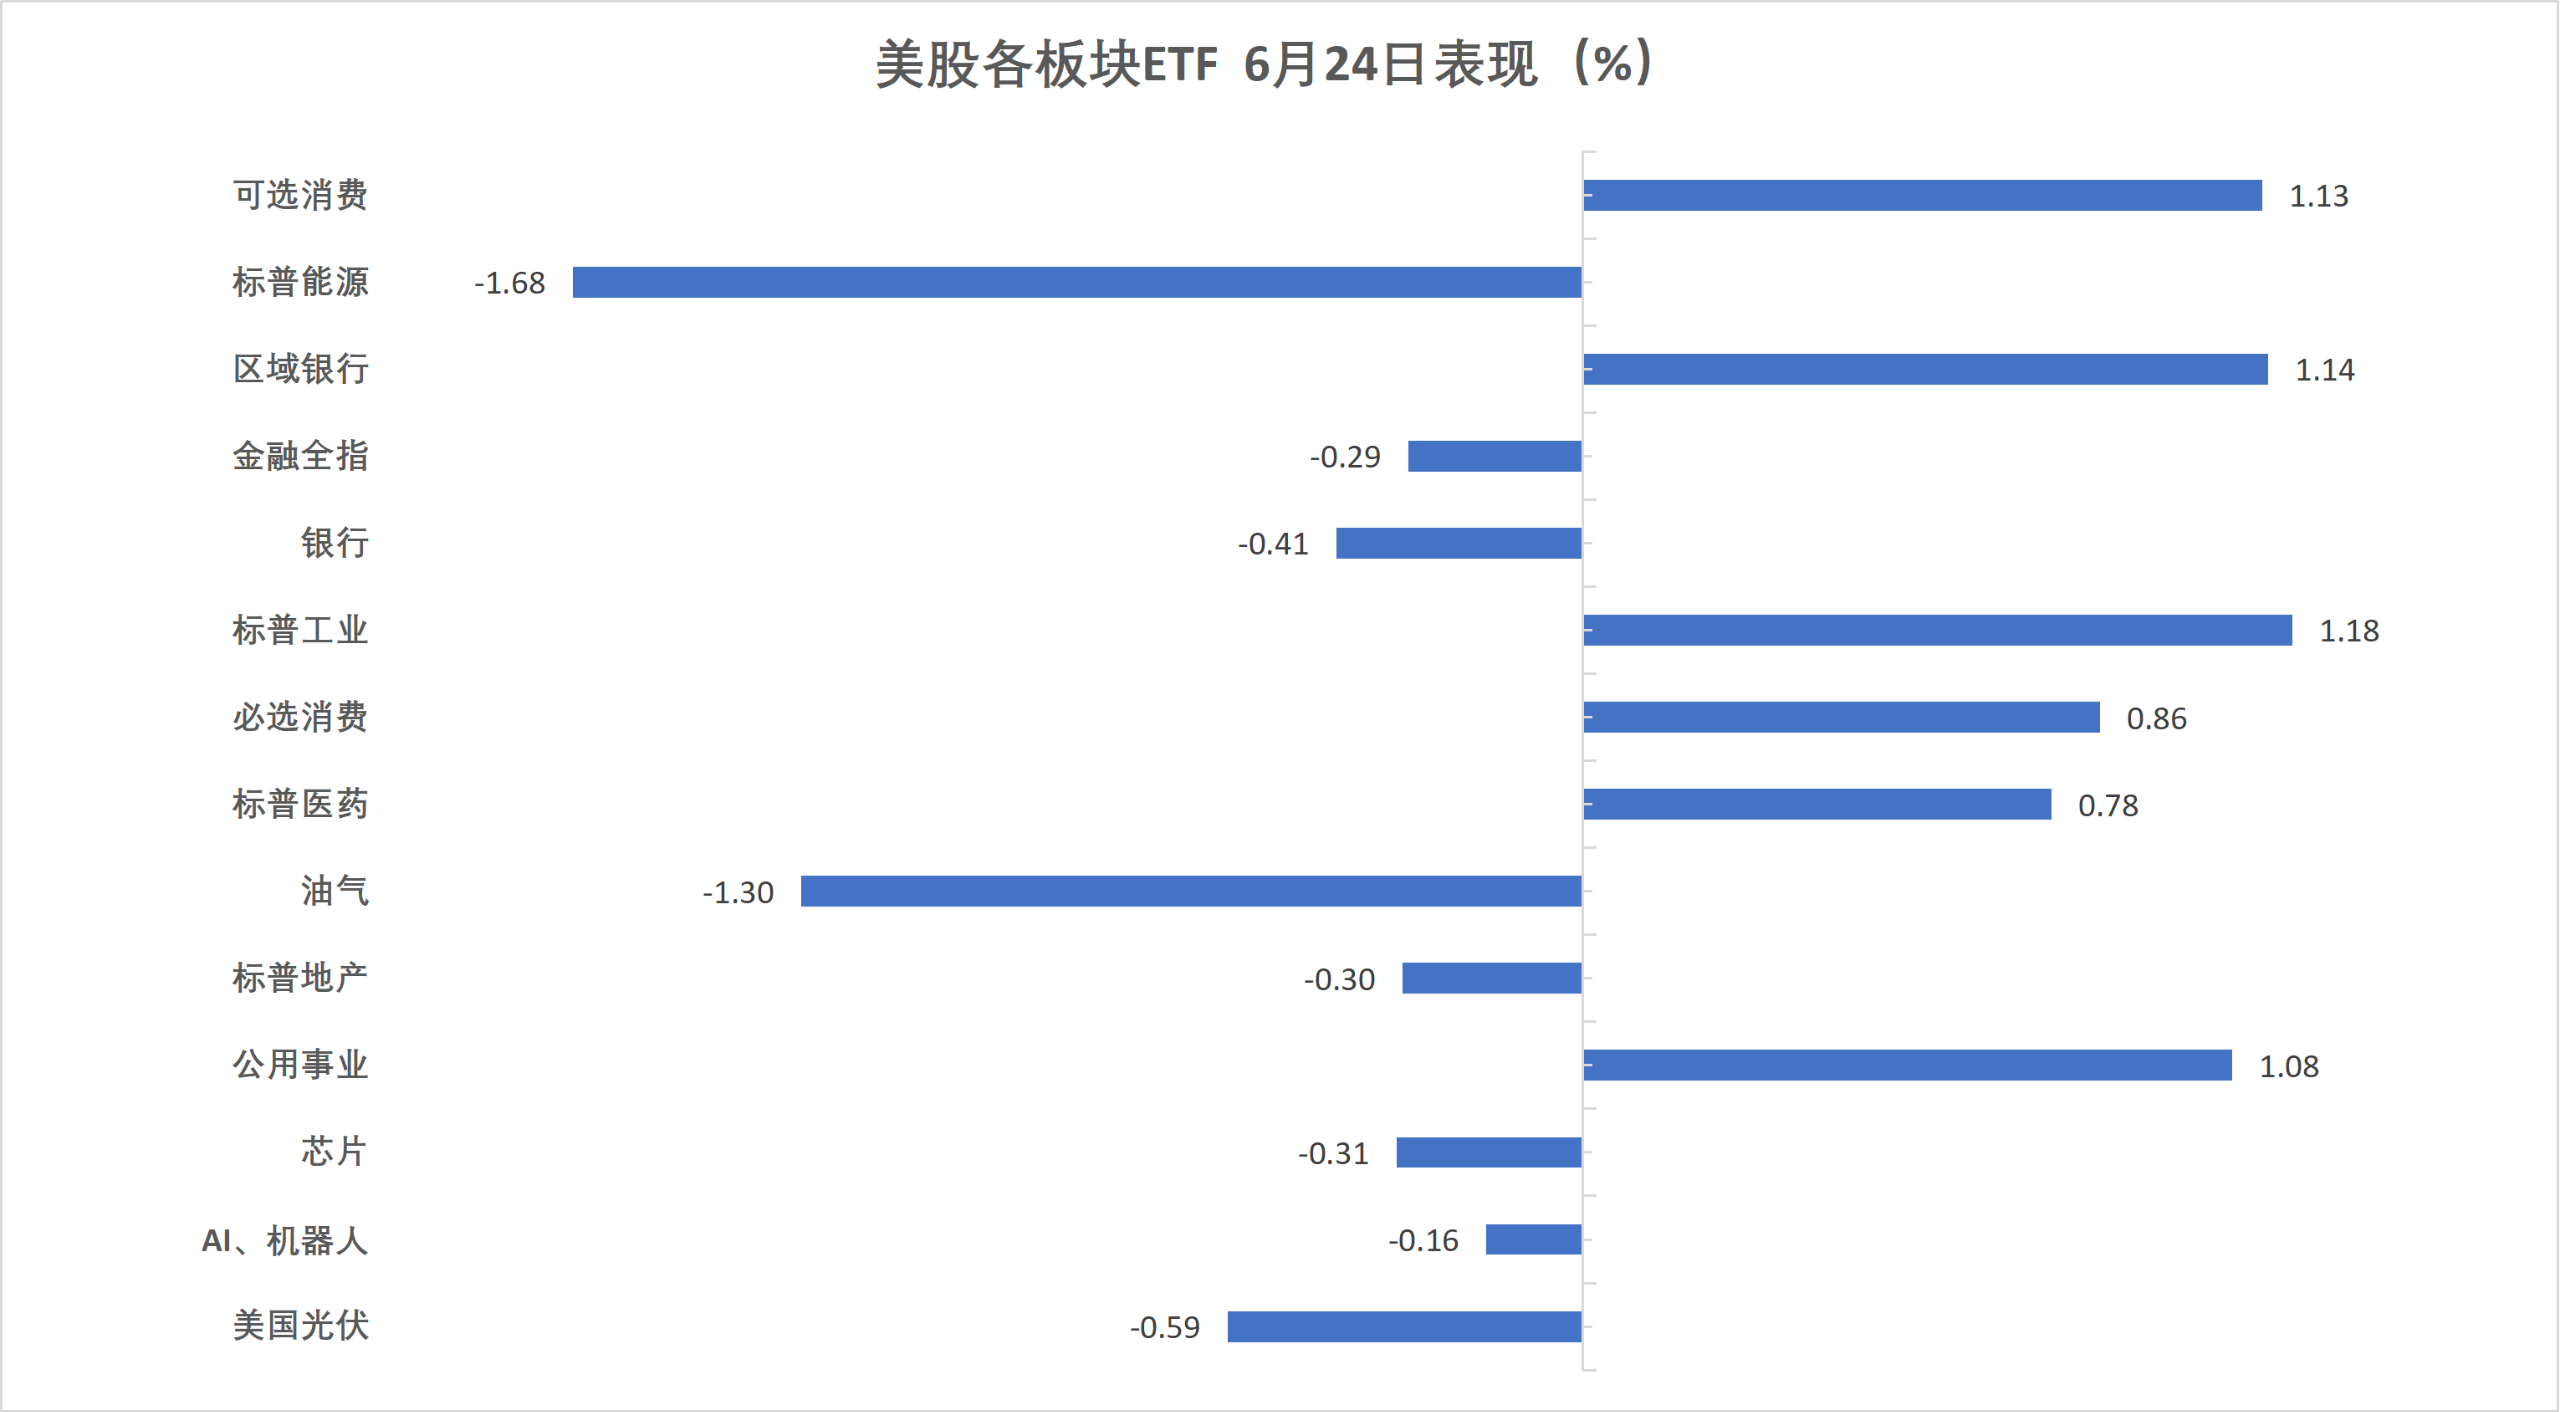
U.S. Sector ETFs:

  • Most U.S. sector ETFs closed higher. The Global Airlines ETF rose 4.17%, the Biotech Index ETF, Regional Bank ETF, Consumer Discretionary ETF, and Utilities ETF rose up to 1.93%.

(U.S. Sector ETFs on June 24)

Magnificent Seven Tech Giants:

  • The Wind Magnificent 7 Index fell 0.70%.

  • Amazon rose 0.11%, Google (Class A) fell 0.25%, Apple fell 0.38%, Nvidia fell 0.56%, Meta fell 0.78%, Tesla fell 1.61%, Microsoft fell 2.27%.

Chip Stocks:

  • The Philadelphia Semiconductor Index closed down 0.18% at 13458.195.

  • TSMC ADR rose 1.01%, AMD fell 0.15%.

Chinese Stocks:

  • The Nasdaq Golden Dragon China Index closed down 1.77% at 5847.87, approaching its September 20, 2024 close of 5838.26 and its August 28, 2024 close of 5399.48.

  • Among popular Chinese stocks, Nio, Meituan, and Alibaba fell at least about 3%, Baidu fell 2.3%, PDD fell 1%, Tencent rose 2.4%, ASE Technology rose 3.5%.

Other Notable Stocks:

  • Circle fell 6.20%.

Eurozone blue-chip stocks closed down over 0.2%, with defense stock Rheinmetall (RHM) falling over 18.6%, leading declines among constituents. German stocks closed down over 0.6%, Defense ETF fell over 2.6%, UK's FTSE 250 rose over 0.7%.

Pan-European Indices:

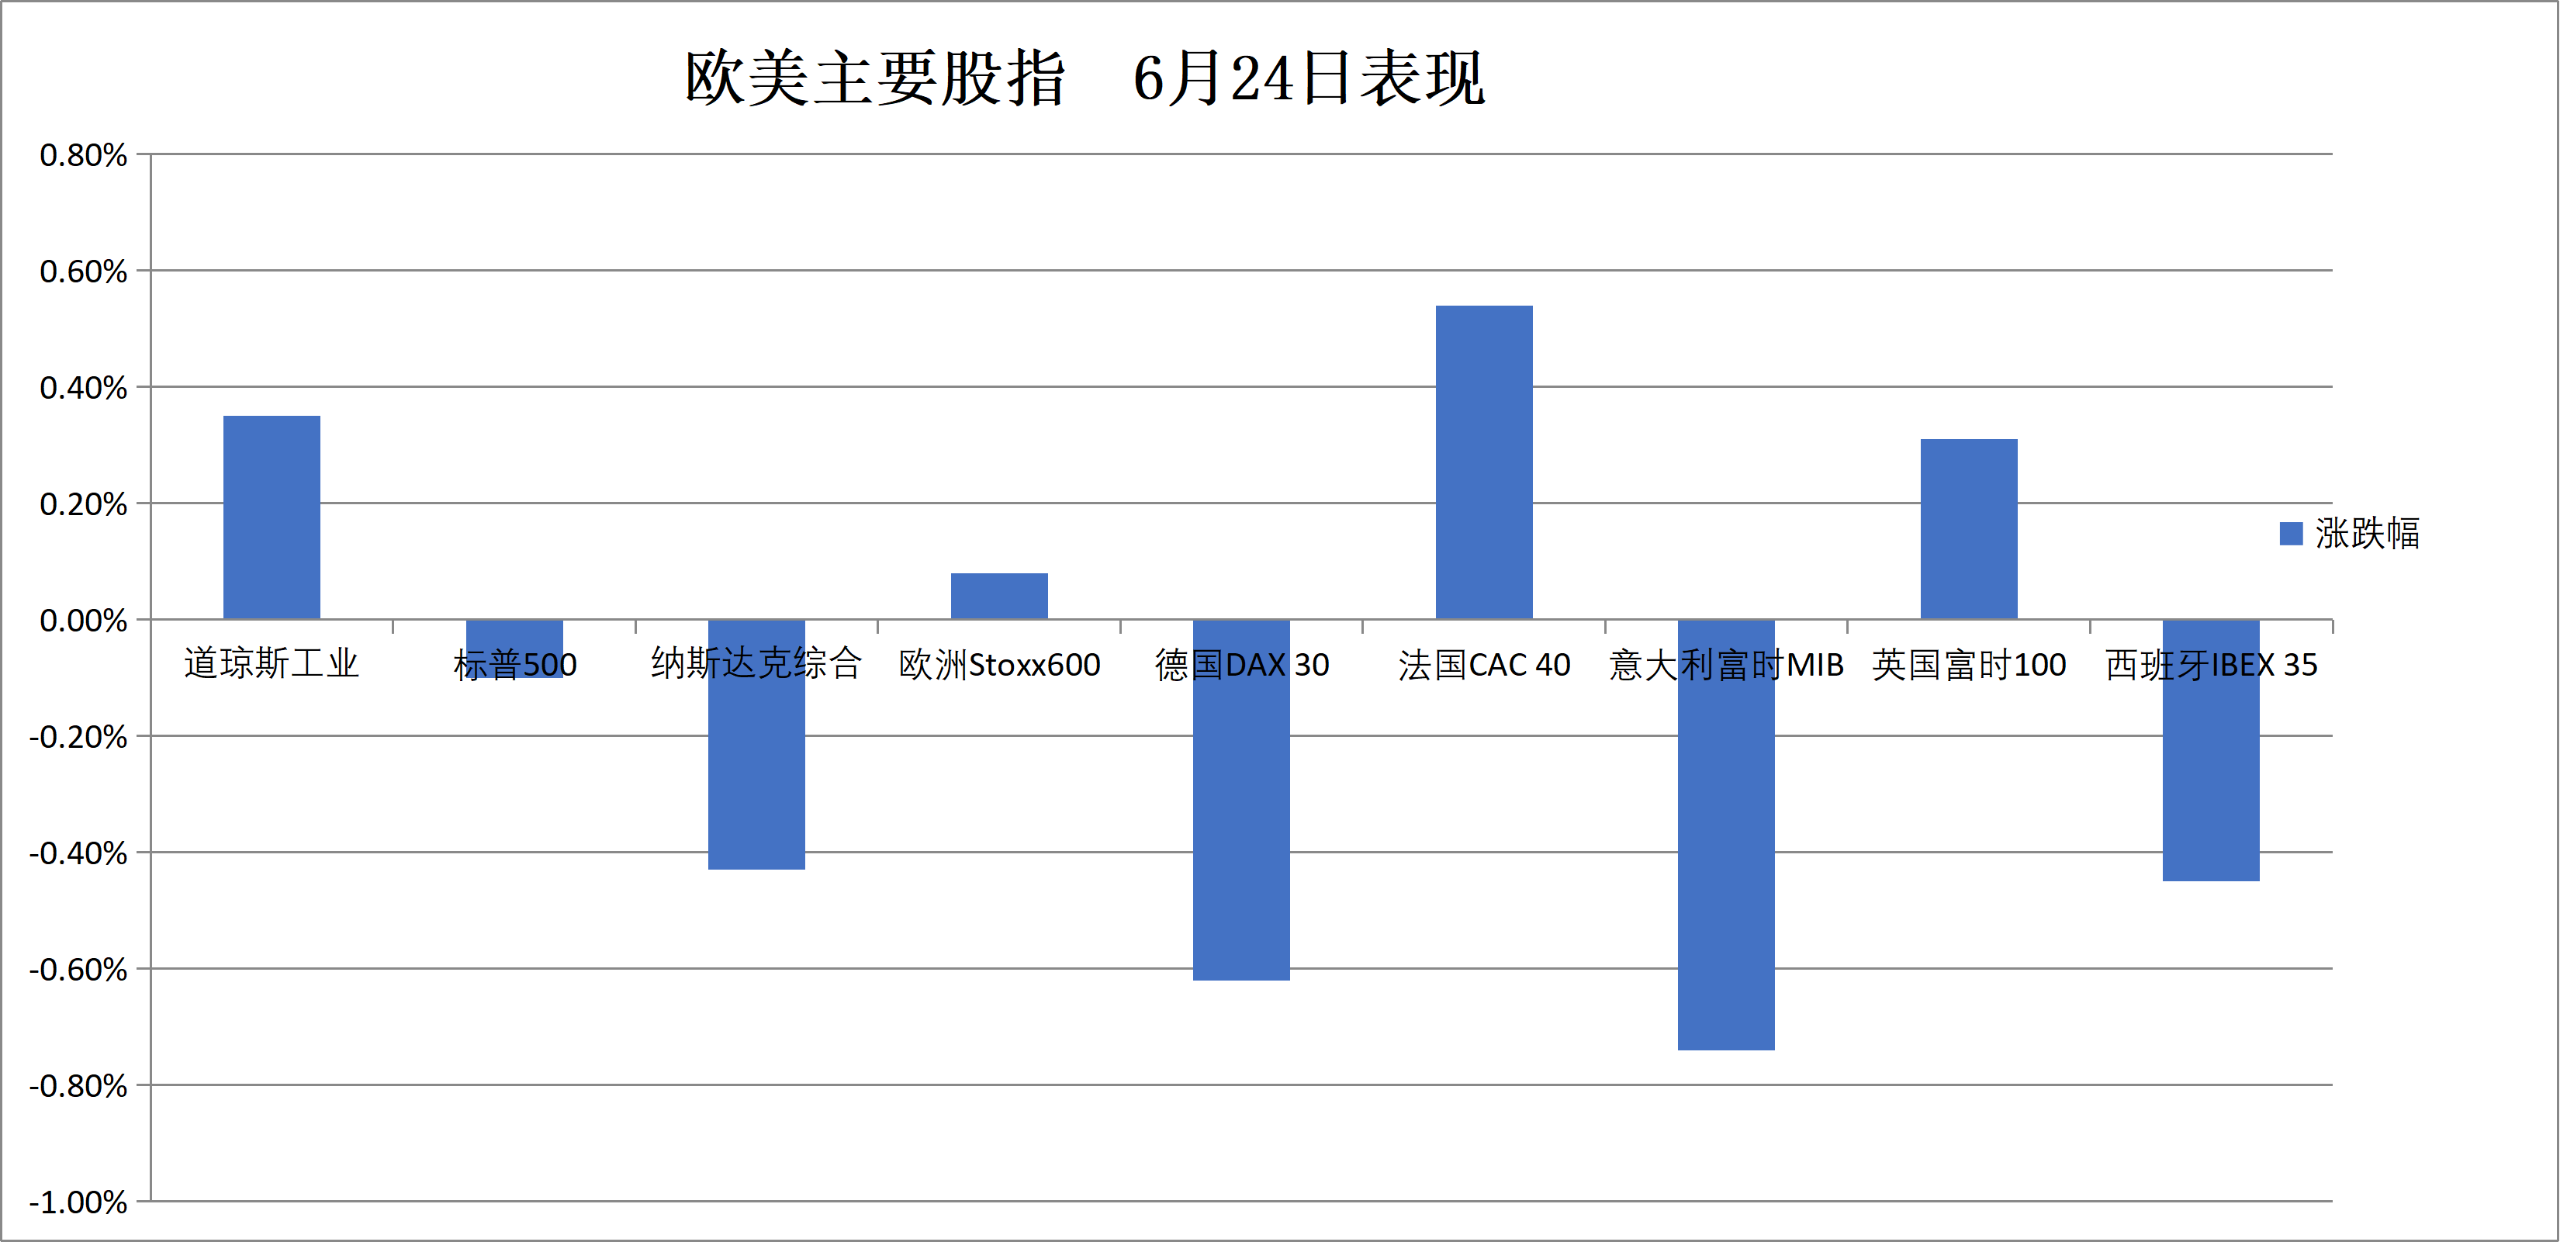
  • The STOXX Europe 600 Index closed up 0.08% at 635.16.

  • The EURO STOXX 50 Index closed down 0.25% at 6214.70.

National Indices:

  • Germany's DAX 30 Index closed down 0.62% at 24740.36.

  • France's CAC 40 Index closed up 0.54% at 8385.49.

  • The UK's FTSE 100 Index closed up 0.31% at 10461.63.

    (Performance of Major European and U.S. Indices on June 24)

Sectors and Stocks:

  • Among Eurozone blue-chips, Germany's Rheinmetall (RHM) closed down 18.65%, Argenx fell 7.92%, Eni fell 3.28%, Deutsche Bank fell 2.58%, Volkswagen fell 2.44%.

  • Among all constituents of the STOXX Europe 600, Soitec closed down 10.888%, Hochschild Mining fell 9.03%, KGHM Polska Miedź S.A. fell 7.29%, joining RHM and Argenx as leading decliners.

Medium and long-term U.S. Treasury yields fell over 10 basis points. Eurozone sovereign bond prices rose broadly, with the 10-year Greek bond yield down about 6 bps. The UK 30-year gilt yield fell about 8 bps.

U.S. Treasuries:

  • At the New York close, the yield on the 10-year U.S. Treasury note fell 10.47 basis points to 4.3922%.

  • The 2-year yield fell 5.28 bps to 4.1456%; the 30-year yield fell 10.57 bps to 4.8396%.

    (Yields on Key U.S. Treasuries)

European Bonds:

  • At the European close, the yield on the 10-year German Bund fell 5.5 bps to 2.865%, in decline throughout the day.

  • The UK 10-year Gilt yield fell 7.0 bps to 4.684%. The 2-year yield fell 3.7 bps to 4.129%.

  • The French 10-year OAT yield fell 5.2 bps to 3.629%.

Dollar recovery, emerging market currencies fell for the fifth consecutive session.

U.S. Dollar:

  • At the New York close, the ICE U.S. Dollar Index rose 0.18% to 101.592, trading between 101.356 and 101.800 during the session.

  • The Bloomberg Dollar Index rose 0.27% to 1226.97, trading between 1223.32 and 1228.36, approaching its November 21, 2025 high of 1228.98 around 21:12.

    (Bloomberg Dollar Index)

Offshore Renminbi (CNH):

  • At the New York close, USD/CNH stood at 6.8132, up 184 pips from Tuesday's New York close, trading between 6.7910 and 6.8195 during the session.

Cryptocurrencies:

  • At the New York close, Bitcoin plunged over 5.3%, once breaking below $60,000 during the session. Ethereum fell 3.10%.

(Bitcoin Price)

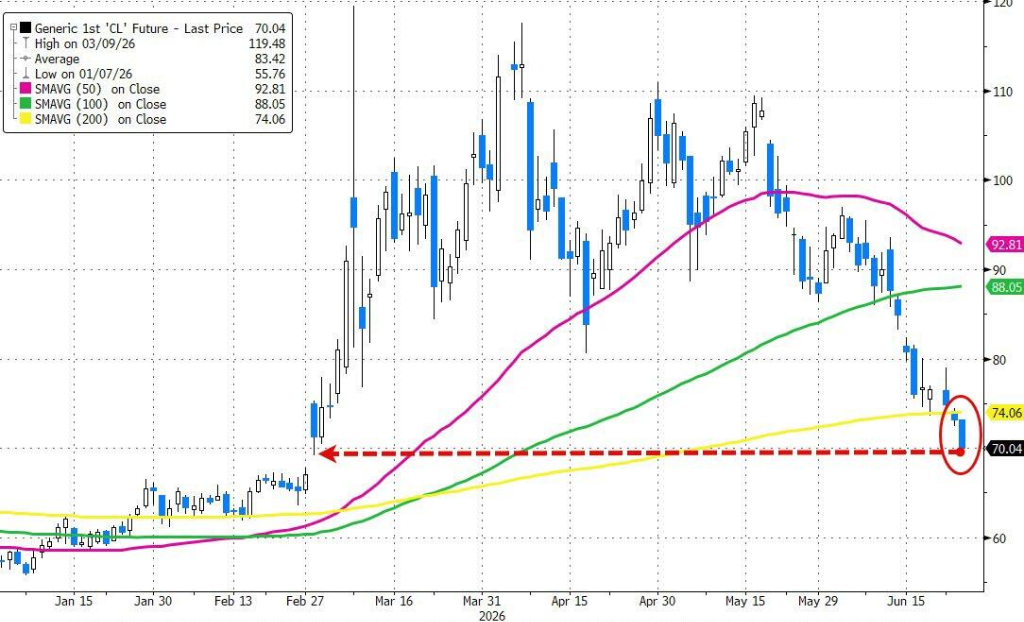
International oil prices hit new closing lows since late February.

Crude Oil:

  • WTI July crude oil futures closed down $2.87, or 3.92%, at $70.34 per barrel.

(WTI Crude Oil Futures)

  • Brent July crude oil futures closed down $3.34, or 4.33%, at $73.74 per barrel.

  • Middle East Abu Dhabi Murban crude futures fell 3.43% to $67.24 per barrel.

Natural Gas:

  • NYMEX July natural gas futures settled at $3.2210 per million British thermal units.

New York gold futures fell 3.2% Wednesday, spot gold lost the $4000 psychological level, silver fell over 6%. Aluminum prices returned to pre-Iran war levels on a stronger dollar and hopes for restored Gulf supply.

Gold:

  • At the New York close, spot gold fell 2.86% to $3999.08 per ounce, in decline throughout the day.

(Spot Gold Price)

  • COMEX gold futures fell 3.21% to $4016.40 per ounce, hitting a low of $3975.70 around midday in New York.

Silver:

  • At the New York close, spot silver fell 6.72% to $57.4512 per ounce, trading between $62.3762 and $55.6125, approaching its November 28, 2025 low of $53.3447 around 02:04.

  • COMEX silver futures fell 6.64% to $57.940 per ounce.

Other Metals:

  • At the New York close, COMEX copper futures fell 2.57% to $6.0525 per pound.

  • Spot platinum fell 4.25%, spot palladium fell 5.01%.

  • LME copper futures closed down $284 at $13,086 per metric ton. LME tin closed down $1,473 at $49,681 per ton. LME nickel closed down $354 at $16,818 per ton. LME aluminum closed down $110 at $3,122 per ton.

Tiền kỹ thuật số thịnh hành

Câu hỏi Liên quan

QWhat were the key factors behind the significant drop in oil and gold prices according to the article?

AThe drop in oil prices was primarily driven by an unexpectedly fast improvement in physical oil flows from the Middle East, particularly increased exports from the UAE through the Strait of Hormuz, which erased the geopolitical risk premium from the Iran war. The decline in gold was attributed to a stronger US dollar reaching a 13-month high, cooling geopolitical tensions reducing safe-haven demand, and supportive policy statements from US officials reinforcing the dollar's strength.

QWhat was the market impact of Micron Technology's earnings report, and why was it significant?

AMicron Technology's earnings report, which exceeded analyst expectations and provided strong forward guidance, triggered a major after-hours rally in chip stocks. Micron's stock jumped over 16%, and other semiconductor companies like Qualcomm and Western Digital saw gains exceeding 10%. It was significant because it acted as a key signal for demand in the AI and semiconductor supply chain, potentially halting a recent sell-off in tech stocks and leading to a broader market rebound.

QHow did the performance of the so-called 'Magnificent 7' tech stocks compare to the broader S&P 500 index on the day described?

AThe 'Magnificent 7' tech stocks underperformed the broader S&P 500 index. The article notes that the S&P 500 (excluding the AI sector) actually rose over 1%, while the Magnificent 7 index fell 0.70%. This indicated a market rotation, where money moved away from the dominant tech leaders into other sectors like consumer discretionary and industrials, with over 310 S&P 500 components closing higher for the day.

QWhat geopolitical and policy developments contributed to the strength of the US dollar as mentioned in the article?

ASeveral factors contributed to US dollar strength: 1) Progress in US-Iran negotiations, including Iran reportedly agreeing not to charge fees for Strait of Hormuz passage and discussions on allowing Iran to price oil exports in dollars. 2) Potential reintegration of Venezuela and post-conflict Russia into the US dollar system. 3) Supportive comments from US Treasury Secretary Bessent, who framed these developments as part of a broader reshaping of the dollar's global dominance and predicted a return to 3% US GDP growth.

QWhat was the divergent performance between major US stock indices (Dow, S&P 500, Nasdaq) on June 24, and what sector was the biggest drag?

AOn June 24, the major US indices showed divergent performance: The Dow Jones Industrial Average rose 0.35% (gaining 182 points), the S&P 500 was nearly flat with a slight 0.10% decline, and the Nasdaq Composite fell 0.43%. The biggest drag on the market was the technology sector, along with the energy sector. Specifically, the AI semiconductor sector was highlighted as plummeting nearly 10%, contributing heavily to the Nasdaq's underperformance.

Nội dung Liên quan

Arthur Hayes Đưa Cuộc Tranh Luận Về Tiện Ích Của Cardano Và XRP Trở Lại Tâm Điểm

Arthur Hayes - đồng sáng lập BitMEX, đã đặt lại câu hỏi về tính hữu dụng thực tế của Cardano và XRP, thách thức các cộng đồng này chứng minh giá trị thông qua nhu cầu giao dịch cụ thể thay vì chỉ dựa vào lòng trung thành và hiệu ứng tài sản. Bài phê bình nhấn mạnh một xu hướng thị trường crypto ngày càng khắt khe: các mạng lưới giờ đây cần có bằng chứng sử dụng đo lường được - như hoạt động người dùng, phí, thanh khoản hay khối lượng thanh toán - chứ không chỉ là niềm tin cộng đồng. XRP thường được biện minh bởi tiện ích trong thanh toán xuyên biên giới và giải pháp thanh khoản của Ripple, trong khi Cardano được cộng đồng chỉ ra các điểm mạnh về staking, quản trị phi tập trung và phát triển có nghiên cứu. Tuy nhiên, cả hai đều đối mặt với yêu cầu chung: chuyển đổi lòng trung thành thành tiện ích hữu hình và tăng trưởng có thể định lượng. Dù Cardano và XRP đều có cơ sở hạ tầng và lịch sử lâu dài, lập luận của Hayes chạm vào vấn đề cốt lõi: khoảng cách giữa tầm nhìn và bằng chứng thực tế. Thách thức cho hai hệ sinh thái này là phải cho thấy số liệu và mức độ sử dụng rõ ràng, vượt ra ngoài nhóm người ủng hộ hiện tại, để đáp ứng các tiêu chuẩn ngày càng cao của thị trường.

bitcoinist33 phút trước

Arthur Hayes Đưa Cuộc Tranh Luận Về Tiện Ích Của Cardano Và XRP Trở Lại Tâm Điểm

bitcoinist33 phút trước

Giá Bitcoin đã thực sự chạm đáy chưa?

Giá Bitcoin (BTC) đã giảm 3,4% trong 24 giờ qua, dẫn đến thanh lý 104,38 triệu USD, chủ yếu là các vị thế mua (91,66 triệu USD) khi giá xuống dưới 60.000 USD. Phân tích kỹ thuật từ CryptoRover chỉ ra mô hình tam giác giảm dần lặp lại từ chu kỳ 2021-2022, dự báo đáy thị trường có thể cần thời gian hình thành trước khi bứt phá, với khả năng chuyển sang xu hướng tăng vào Q4/2026. Tuy nhiên, sự tích lũy từ cá voi hiện chưa đủ mạnh để xác nhận sự đảo chiều. Chỉ số MVRV của nhà nắm giữ dài hạn đã giảm xuống 1,24, mức thấp nhất trong ba năm, cho thấy thị trường đang tiến gần các mức đáy lịch sử. Cần giảm sâu hơn vào vùng "Rất thấp" để xác nhận đáy. Mức giá trung bình mua vào của nhóm này là 48,4k USD; việc phá vỡ ngưỡng này có thể báo hiệu sự đầu hàng. Phân tích về chu kỳ 4 năm từ Benjamin Cohen cho thấy đường trung bình động 200 tuần đã bị phá vỡ vào tháng 6/2026, tương đồng với tháng 6/2022. Đồng thời, tỷ lệ Long/Short cao hiện tại cho thấy nhiều nhà giao dịch đang mở vị thế mua, có thể dẫn đến các đợt thanh lý tiếp theo và đẩy giá xuống thêm. **Tóm lại:** Bitcoin đang tiến gần các điều kiện hình thành đáy theo chu kỳ lịch sử nhưng chưa hoàn toàn đạt tới. Khả năng giá tiếp tục giảm trong vài tháng tới là có thể xảy ra trước khi thị trường tìm được đáy thực sự.

ambcrypto37 phút trước

Giá Bitcoin đã thực sự chạm đáy chưa?

ambcrypto37 phút trước

Giao dịch

Giao ngay

Bài viết Nổi bật

AGENT S là gì

Agent S: Tương Lai của Tương Tác Tự Động trong Web3 Giới thiệu Trong bối cảnh không ngừng phát triển của Web3 và tiền điện tử, các đổi mới đang liên tục định nghĩa lại cách mà cá nhân tương tác với các nền tảng kỹ thuật số. Một dự án tiên phong như vậy, Agent S, hứa hẹn sẽ cách mạng hóa tương tác giữa con người và máy tính thông qua khung tác nhân mở của nó. Bằng cách mở đường cho các tương tác tự động, Agent S nhằm đơn giản hóa các nhiệm vụ phức tạp, cung cấp các ứng dụng chuyển đổi trong trí tuệ nhân tạo (AI). Cuộc khám phá chi tiết này sẽ đi sâu vào những phức tạp của dự án, các tính năng độc đáo của nó và những tác động đối với lĩnh vực tiền điện tử. Agent S là gì? Agent S đứng vững như một khung tác nhân mở đột phá, được thiết kế đặc biệt để giải quyết ba thách thức cơ bản trong việc tự động hóa các nhiệm vụ máy tính: Thu thập Kiến thức Cụ thể theo Miền: Khung này học một cách thông minh từ nhiều nguồn kiến thức bên ngoài và kinh nghiệm nội bộ. Cách tiếp cận kép này giúp nó xây dựng một kho lưu trữ phong phú về kiến thức cụ thể theo miền, nâng cao hiệu suất của nó trong việc thực hiện nhiệm vụ. Lập Kế Hoạch Qua Các Tầm Nhìn Nhiệm Vụ Dài Hạn: Agent S sử dụng lập kế hoạch phân cấp tăng cường kinh nghiệm, một cách tiếp cận chiến lược giúp phân chia và thực hiện các nhiệm vụ phức tạp một cách hiệu quả. Tính năng này nâng cao đáng kể khả năng quản lý nhiều nhiệm vụ con một cách hiệu quả và hiệu suất. Xử Lý Các Giao Diện Động, Không Đều: Dự án giới thiệu Giao Diện Tác Nhân-Máy Tính (ACI), một giải pháp đổi mới giúp nâng cao tương tác giữa các tác nhân và người dùng. Sử dụng các Mô Hình Ngôn Ngữ Lớn Đa Phương Thức (MLLMs), Agent S có thể điều hướng và thao tác các giao diện người dùng đồ họa đa dạng một cách liền mạch. Thông qua những tính năng tiên phong này, Agent S cung cấp một khung vững chắc giải quyết các phức tạp liên quan đến việc tự động hóa tương tác giữa con người với máy móc, mở ra nhiều ứng dụng trong AI và hơn thế nữa. Ai là Người Tạo ra Agent S? Mặc dù khái niệm về Agent S là hoàn toàn đổi mới, thông tin cụ thể về người sáng lập vẫn còn mơ hồ. Người sáng lập hiện vẫn chưa được biết đến, điều này làm nổi bật giai đoạn sơ khai của dự án hoặc sự lựa chọn chiến lược để giữ kín các thành viên sáng lập. Bất chấp sự ẩn danh, sự chú ý vẫn tập trung vào khả năng và tiềm năng của khung này. Ai là Các Nhà Đầu Tư của Agent S? Vì Agent S còn tương đối mới trong hệ sinh thái mã hóa, thông tin chi tiết về các nhà đầu tư và những người tài trợ tài chính của nó không được ghi chép rõ ràng. Sự thiếu vắng thông tin công khai về các nền tảng đầu tư hoặc tổ chức hỗ trợ dự án dấy lên câu hỏi về cấu trúc tài trợ và lộ trình phát triển của nó. Hiểu biết về sự hỗ trợ là rất quan trọng để đánh giá tính bền vững và tác động tiềm năng của dự án. Agent S Hoạt Động Như Thế Nào? Tại cốt lõi của Agent S là công nghệ tiên tiến cho phép nó hoạt động hiệu quả trong nhiều bối cảnh khác nhau. Mô hình hoạt động của nó được xây dựng xung quanh một số tính năng chính: Tương Tác Giống Như Con Người: Khung này cung cấp lập kế hoạch AI tiên tiến, cố gắng làm cho các tương tác với máy tính trở nên trực quan hơn. Bằng cách bắt chước hành vi của con người trong việc thực hiện nhiệm vụ, nó hứa hẹn nâng cao trải nghiệm người dùng. Ký Ức Tường Thuật: Được sử dụng để tận dụng các trải nghiệm cấp cao, Agent S sử dụng ký ức tường thuật để theo dõi lịch sử nhiệm vụ, từ đó nâng cao quy trình ra quyết định của nó. Ký Ức Tình Huống: Tính năng này cung cấp cho người dùng hướng dẫn từng bước, cho phép khung này cung cấp hỗ trợ theo ngữ cảnh khi các nhiệm vụ diễn ra. Hỗ Trợ OpenACI: Với khả năng chạy cục bộ, Agent S cho phép người dùng duy trì quyền kiểm soát đối với các tương tác và quy trình làm việc của họ, phù hợp với tinh thần phi tập trung của Web3. Tích Hợp Dễ Dàng với Các API Bên Ngoài: Tính linh hoạt và khả năng tương thích với nhiều nền tảng AI khác nhau đảm bảo rằng Agent S có thể hòa nhập liền mạch vào các hệ sinh thái công nghệ hiện có, làm cho nó trở thành lựa chọn hấp dẫn cho các nhà phát triển và tổ chức. Những chức năng này cùng nhau góp phần vào vị trí độc đáo của Agent S trong không gian tiền điện tử, khi nó tự động hóa các nhiệm vụ phức tạp, nhiều bước với sự can thiệp tối thiểu của con người. Khi dự án phát triển, các ứng dụng tiềm năng của nó trong Web3 có thể định nghĩa lại cách mà các tương tác kỹ thuật số diễn ra. Thời Gian Phát Triển của Agent S Sự phát triển và các cột mốc của Agent S có thể được tóm tắt trong một dòng thời gian nêu bật các sự kiện quan trọng của nó: 27 tháng 9, 2024: Khái niệm về Agent S được ra mắt trong một bài nghiên cứu toàn diện mang tên “Một Khung Tác Nhân Mở Sử Dụng Máy Tính Như Một Con Người,” trình bày nền tảng cho dự án. 10 tháng 10, 2024: Bài nghiên cứu được công bố công khai trên arXiv, cung cấp một cái nhìn sâu sắc về khung và đánh giá hiệu suất của nó dựa trên tiêu chuẩn OSWorld. 12 tháng 10, 2024: Một video trình bày được phát hành, cung cấp cái nhìn trực quan về khả năng và tính năng của Agent S, thu hút thêm sự quan tâm từ người dùng và nhà đầu tư tiềm năng. Những dấu mốc trong dòng thời gian không chỉ minh họa sự tiến bộ của Agent S mà còn chỉ ra cam kết của nó đối với sự minh bạch và sự tham gia của cộng đồng. Những Điểm Chính Về Agent S Khi khung Agent S tiếp tục phát triển, một số thuộc tính chính nổi bật, nhấn mạnh tính đổi mới và tiềm năng của nó: Khung Đổi Mới: Được thiết kế để cung cấp cách sử dụng máy tính trực quan giống như tương tác của con người, Agent S mang đến một cách tiếp cận mới cho việc tự động hóa nhiệm vụ. Tương Tác Tự Động: Khả năng tương tác tự động với máy tính thông qua GUI đánh dấu một bước tiến tới các giải pháp tính toán thông minh và hiệu quả hơn. Tự Động Hóa Nhiệm Vụ Phức Tạp: Với phương pháp mạnh mẽ của nó, nó có thể tự động hóa các nhiệm vụ phức tạp, nhiều bước, làm cho các quy trình nhanh hơn và ít sai sót hơn. Cải Tiến Liên Tục: Các cơ chế học tập cho phép Agent S cải thiện từ các trải nghiệm trước đó, liên tục nâng cao hiệu suất và hiệu quả của nó. Tính Linh Hoạt: Khả năng thích ứng của nó trên các môi trường hoạt động khác nhau như OSWorld và WindowsAgentArena đảm bảo rằng nó có thể phục vụ một loạt các ứng dụng rộng rãi. Khi Agent S định vị mình trong bối cảnh Web3 và tiền điện tử, tiềm năng của nó để nâng cao khả năng tương tác và tự động hóa quy trình đánh dấu một bước tiến quan trọng trong công nghệ AI. Thông qua khung đổi mới của mình, Agent S minh họa cho tương lai của các tương tác kỹ thuật số, hứa hẹn một trải nghiệm liền mạch và hiệu quả hơn cho người dùng trên nhiều ngành công nghiệp khác nhau. Kết luận Agent S đại diện cho một bước nhảy vọt táo bạo trong sự kết hợp giữa AI và Web3, với khả năng định nghĩa lại cách chúng ta tương tác với công nghệ. Mặc dù vẫn còn ở giai đoạn đầu, những khả năng cho ứng dụng của nó là rộng lớn và hấp dẫn. Thông qua khung toàn diện của mình giải quyết các thách thức quan trọng, Agent S nhằm đưa các tương tác tự động lên hàng đầu trong trải nghiệm kỹ thuật số. Khi chúng ta tiến sâu hơn vào các lĩnh vực tiền điện tử và phi tập trung, các dự án như Agent S chắc chắn sẽ đóng một vai trò quan trọng trong việc định hình tương lai của công nghệ và sự hợp tác giữa con người với máy tính.

Tổng lượt xem 902Xuất bản vào 2025.01.14Cập nhật vào 2025.01.14

AGENT S là gì

Làm thế nào để Mua S

Chào mừng bạn đến với HTX.com! Chúng tôi đã làm cho mua Sonic (S) trở nên đơn giản và thuận tiện. Làm theo hướng dẫn từng bước của chúng tôi để bắt đầu hành trình tiền kỹ thuật số của bạn.Bước 1: Tạo Tài khoản HTX của BạnSử dụng email hoặc số điện thoại của bạn để đăng ký tài khoản miễn phí trên HTX. Trải nghiệm hành trình đăng ký không rắc rối và mở khóa tất cả tính năng. Nhận Tài khoản của tôiBước 2: Truy cập Mua Crypto và Chọn Phương thức Thanh toán của BạnThẻ Tín dụng/Ghi nợ: Sử dụng Visa hoặc Mastercard của bạn để mua Sonic (S) ngay lập tức.Số dư: Sử dụng tiền từ số dư tài khoản HTX của bạn để giao dịch liền mạch.Bên thứ ba: Chúng tôi đã thêm những phương thức thanh toán phổ biến như Google Pay và Apple Pay để nâng cao sự tiện lợi.P2P: Giao dịch trực tiếp với người dùng khác trên HTX.Thị trường mua bán phi tập trung (OTC): Chúng tôi cung cấp những dịch vụ được thiết kế riêng và tỷ giá hối đoái cạnh tranh cho nhà giao dịch.Bước 3: Lưu trữ Sonic (S) của BạnSau khi mua Sonic (S), lưu trữ trong tài khoản HTX của bạn. Ngoài ra, bạn có thể gửi đi nơi khác qua chuyển khoản blockchain hoặc sử dụng để giao dịch những tiền kỹ thuật số khác.Bước 4: Giao dịch Sonic (S)Giao dịch Sonic (S) dễ dàng trên thị trường giao ngay của HTX. Chỉ cần truy cập vào tài khoản của bạn, chọn cặp giao dịch, thực hiện giao dịch và theo dõi trong thời gian thực. Chúng tôi cung cấp trải nghiệm thân thiện với người dùng cho cả người mới bắt đầu và người giao dịch dày dạn kinh nghiệm.

Tổng lượt xem 1.7kXuất bản vào 2025.01.15Cập nhật vào 2026.06.02

Làm thế nào để Mua S

Thảo luận

Chào mừng đến với Cộng đồng HTX. Tại đây, bạn có thể được thông báo về những phát triển nền tảng mới nhất và có quyền truy cập vào thông tin chuyên sâu về thị trường. Ý kiến ​​của người dùng về giá của S (S) được trình bày dưới đây.

活动图片