Excerpt
Bitcoin shows signs of exhaustion after the FOMC rally. Long-term holders have realized 3.4M BTC in profits, while ETF inflows slowed. With spot and futures under stress, the short-term holder cost basis at $111k is the key level to hold or risk deeper cooling.
Executive Summary
- Bitcoin has entered a corrective phase after the FOMC-driven rally, showing signs of “buy the rumour, sell the news” dynamics. The broader market structure points toward fading momentum.
- On-chain drawdown remains mild at 8%, but realized cap inflows of $678B and 3.4M BTC in long-term holder profits highlight the unprecedented scale of capital rotation and distribution.
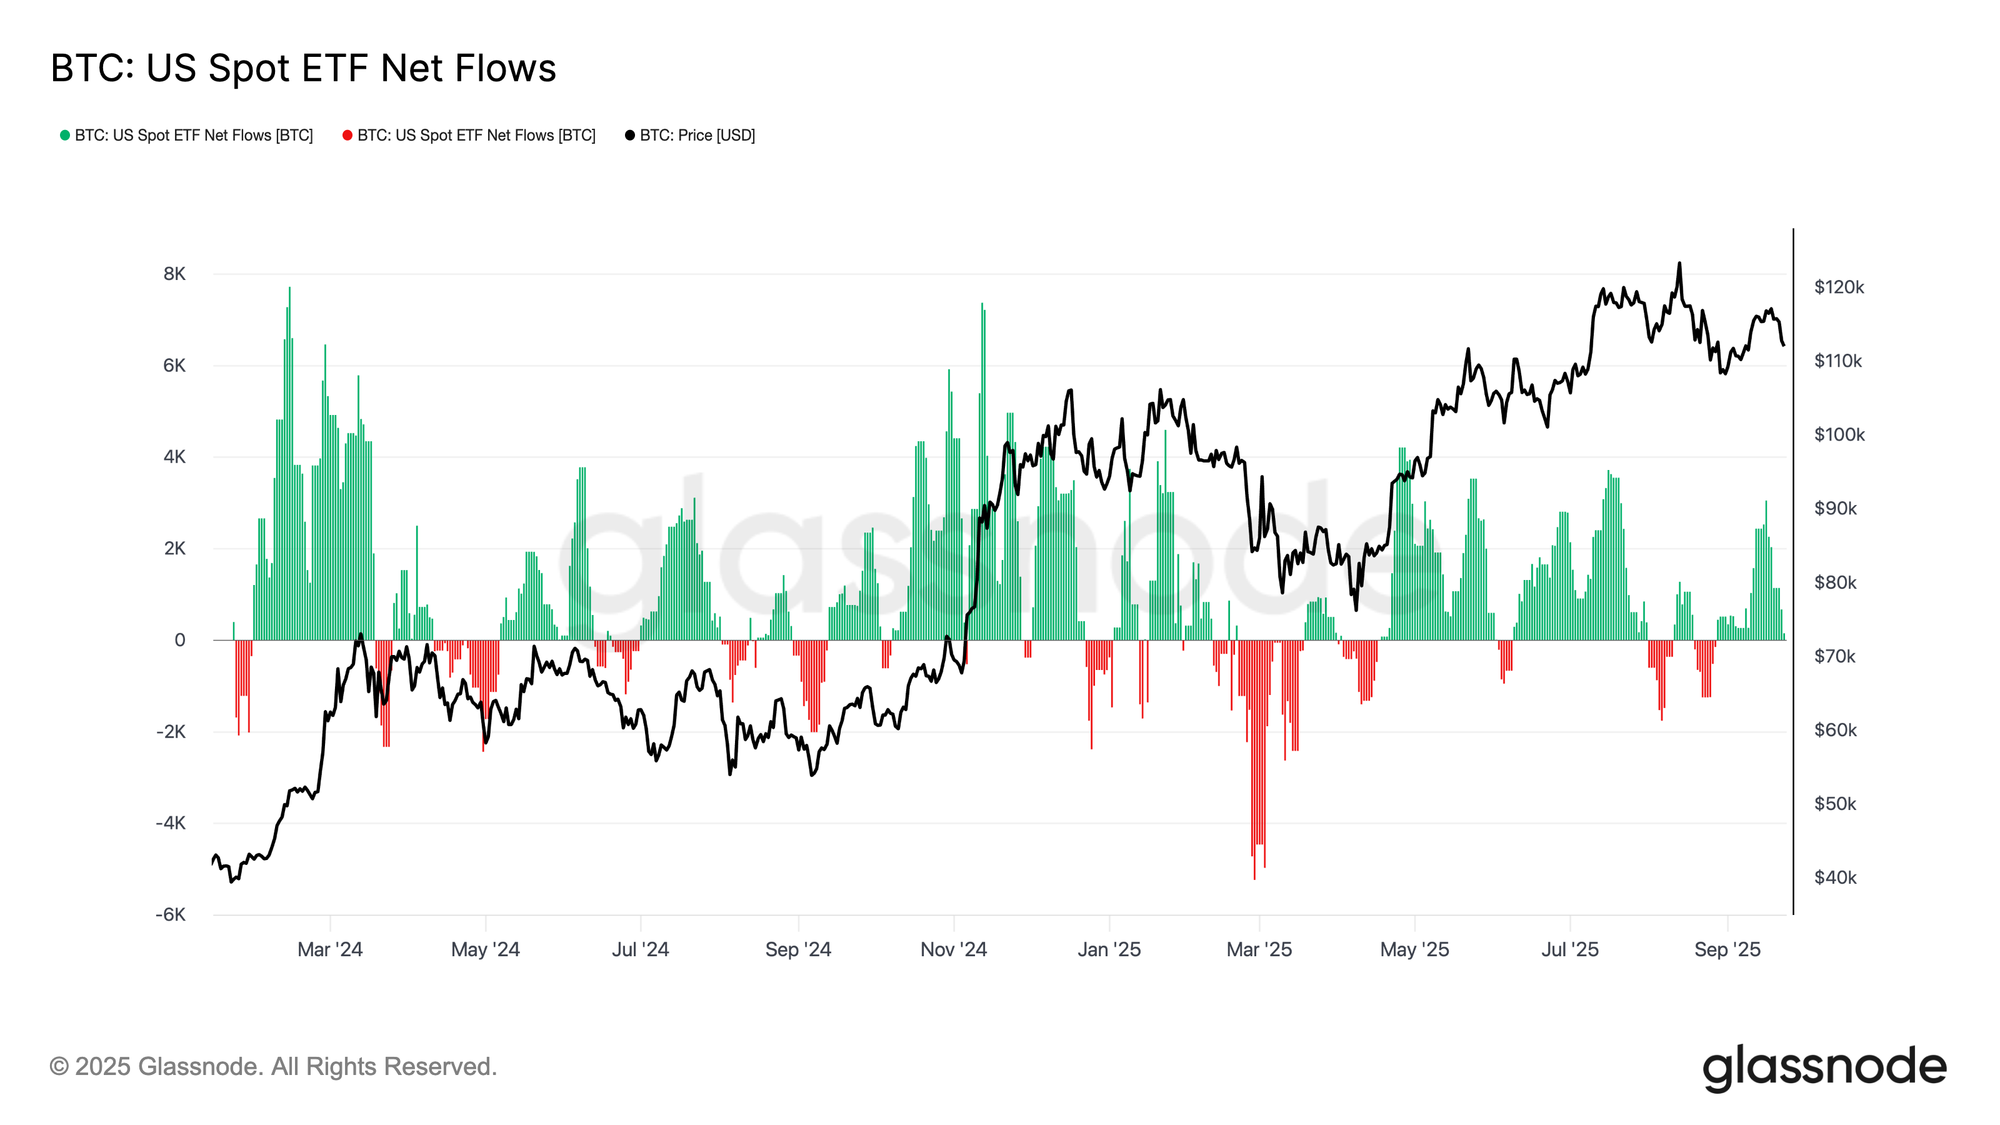
- ETF inflows, once a key absorber of supply, slowed sharply around the FOMC as long-term holder distribution accelerated, creating a fragile balance in flows.
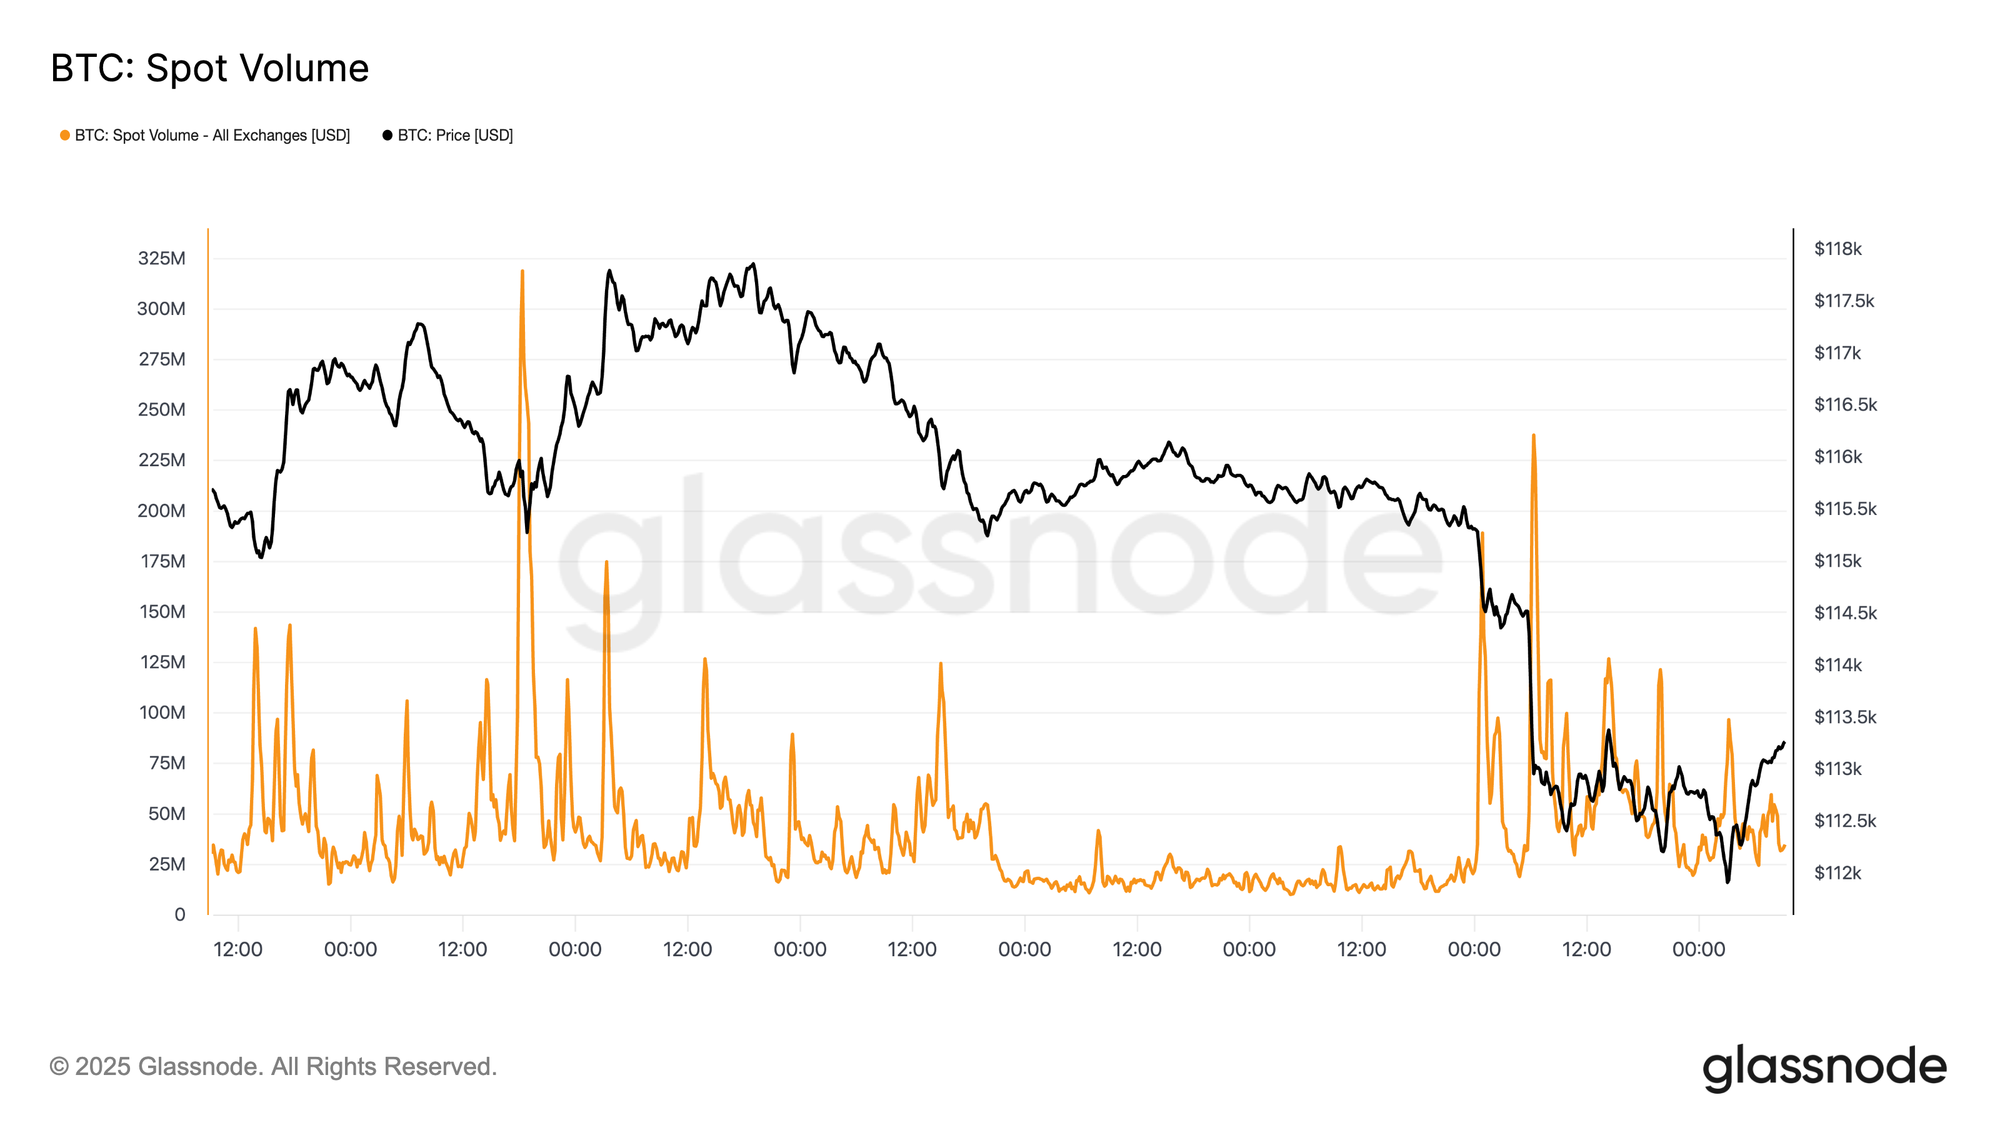
- Spot volumes spiked during the sell-off, futures markets saw heavy deleveraging, and liquidation clusters revealed vulnerability to liquidity-driven swings on both sides of the market.
- Options markets repriced aggressively, with skew surging and puts in high demand, signalling defensive positioning. Combined with peak gamma conditions, the macro backdrop suggests a market increasingly exhausted.
From Rally to Correction
Following the FOMC-driven rally that peaked near $117k, Bitcoin has transitioned into a corrective phase, echoing a textbook “buy the rumour, sell the news” pattern. In this edition, we step back from short-term swings to assess the broader market structure, using long-term on-chain indicators, ETF demand, and derivatives positioning to evaluate whether this pullback reflects healthy consolidation or the early stages of deeper contraction.
On-Chain Analysis
Volatility in Context
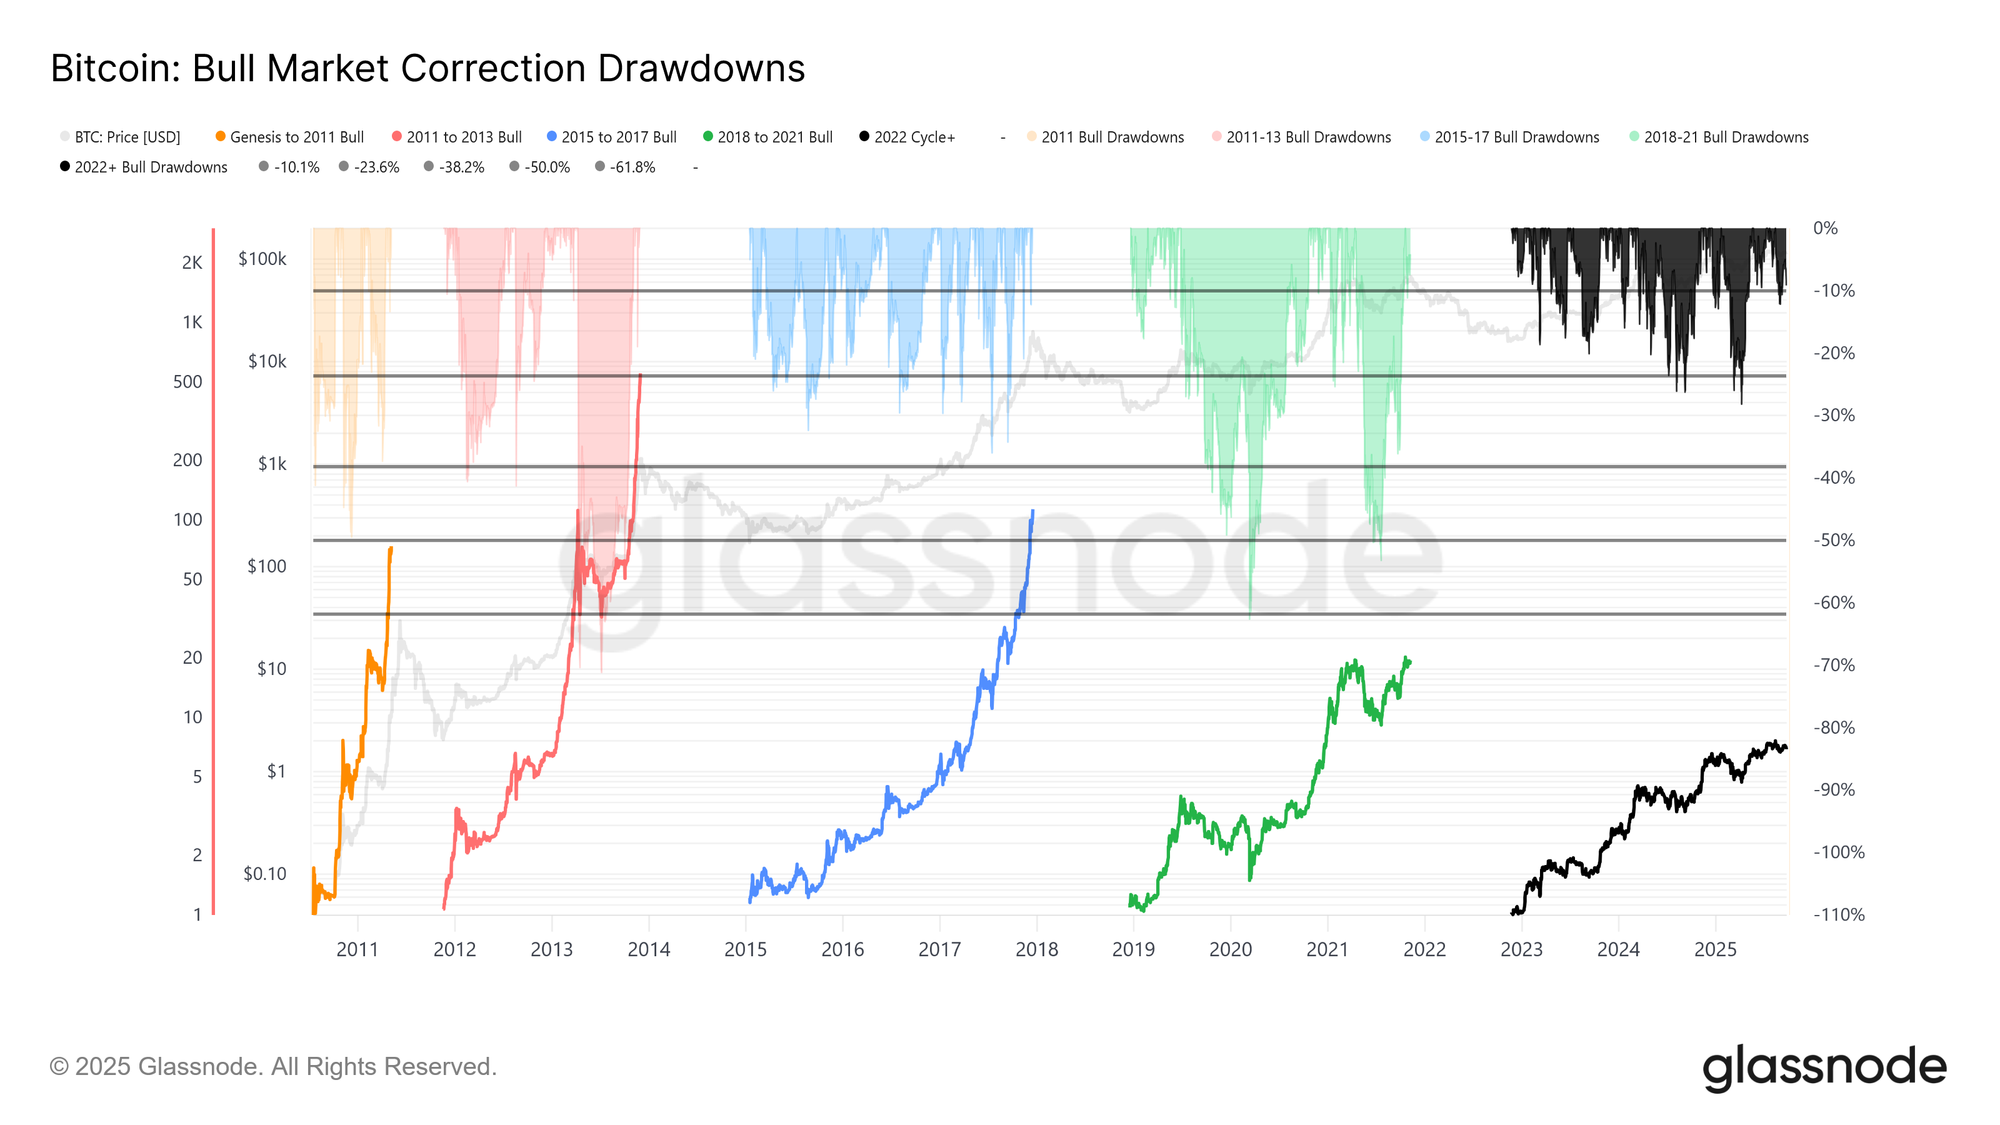
Building on this, the current drawdown from the $124k ATH to $113.7k is just 8%, mild compared to the cycle’s 28% drawdown or the 60% declines of prior cycles. This aligns with the long-term trend of diminishing volatility, both across macro cycles and within intra-cycle phases, resembling the steady advance of 2015–2017, so far without its late-stage blow-off rally.
Cycle Duration
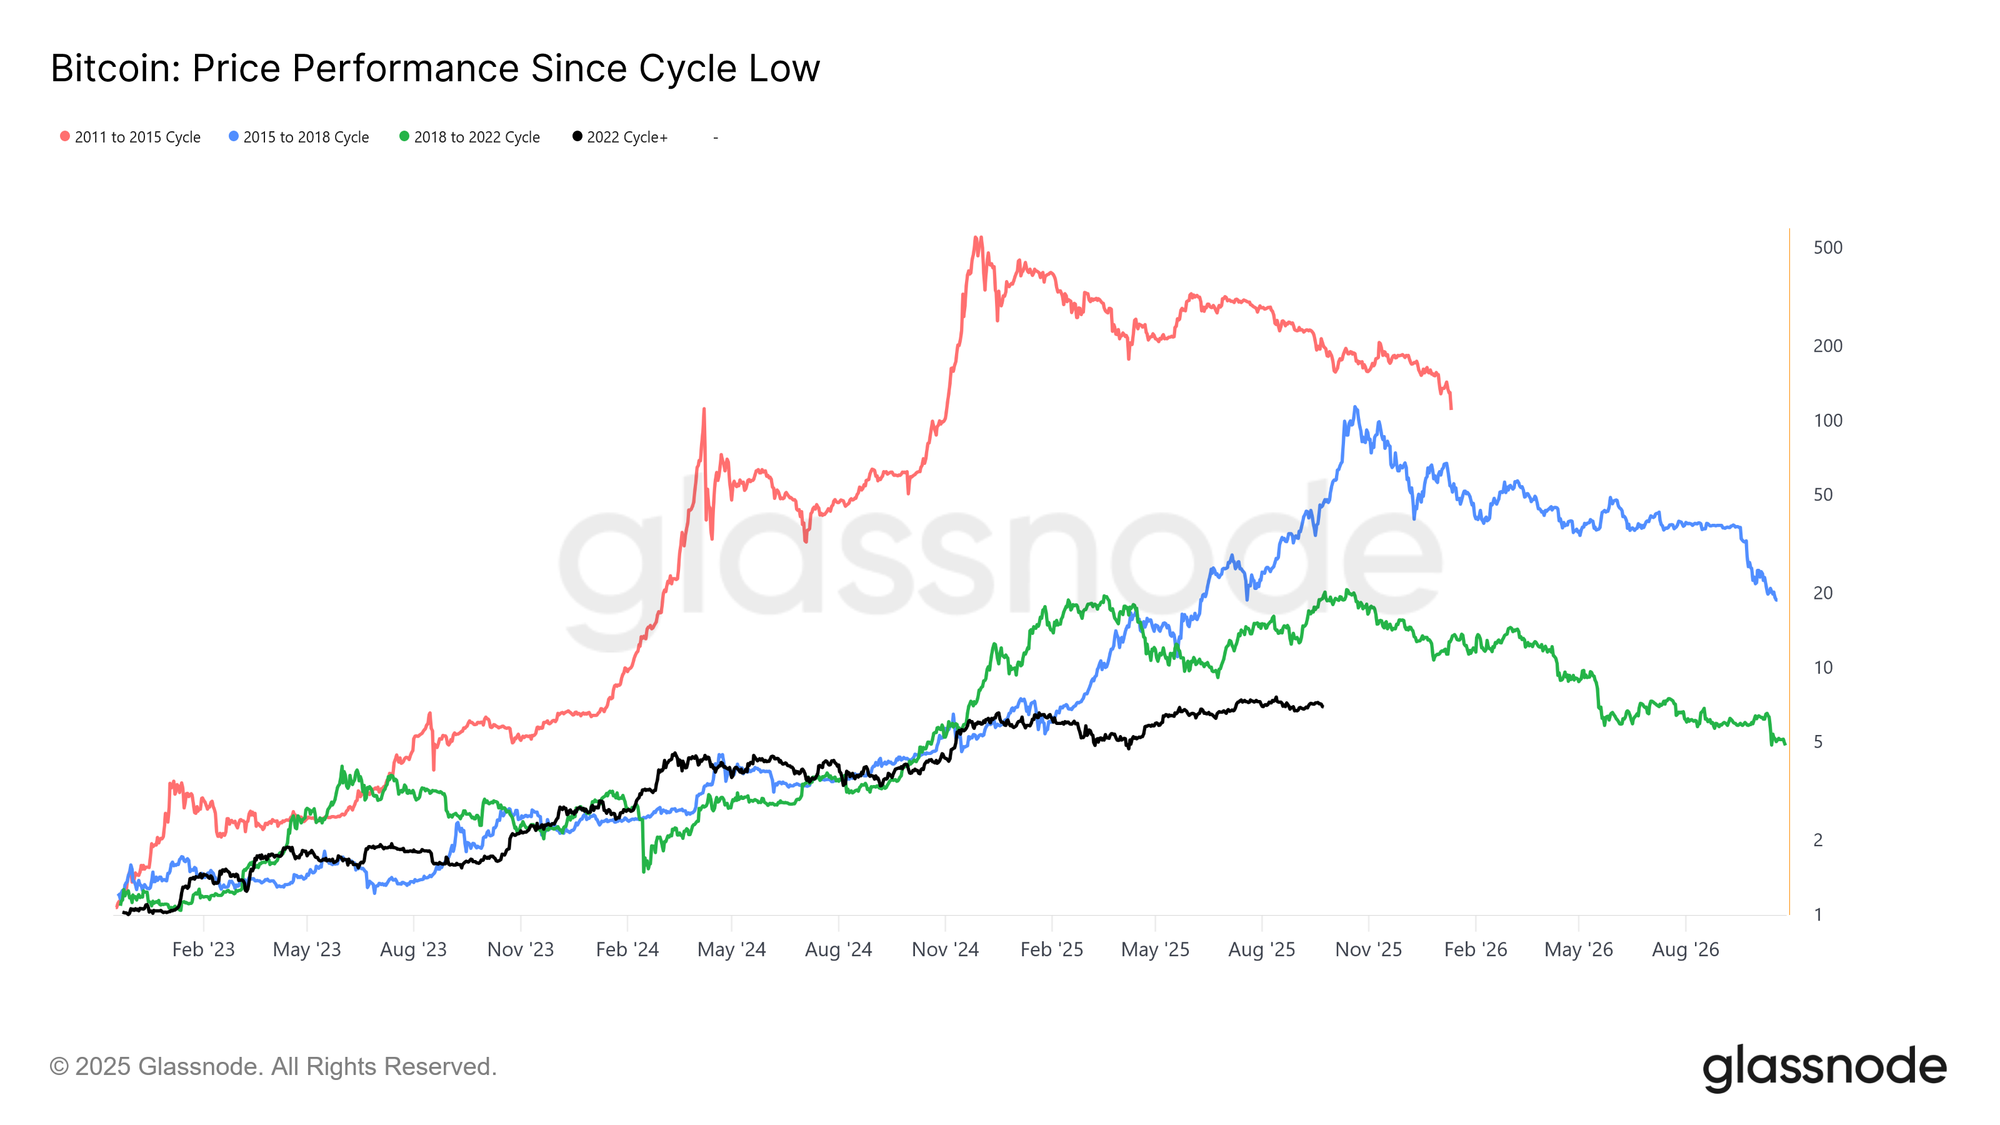
Extending the view, overlaying the last four cycles highlights how peak returns have diminished over time, even as the present trajectory remains closely aligned with the prior two cycles. Assuming $124k marked the global top, this cycle has lasted roughly 1,030 days, very close to the ~1,060-day lengths of the previous two cycles.
Capital Inflows Measured
Beyond price action, capital deployment provides a more robust lens.
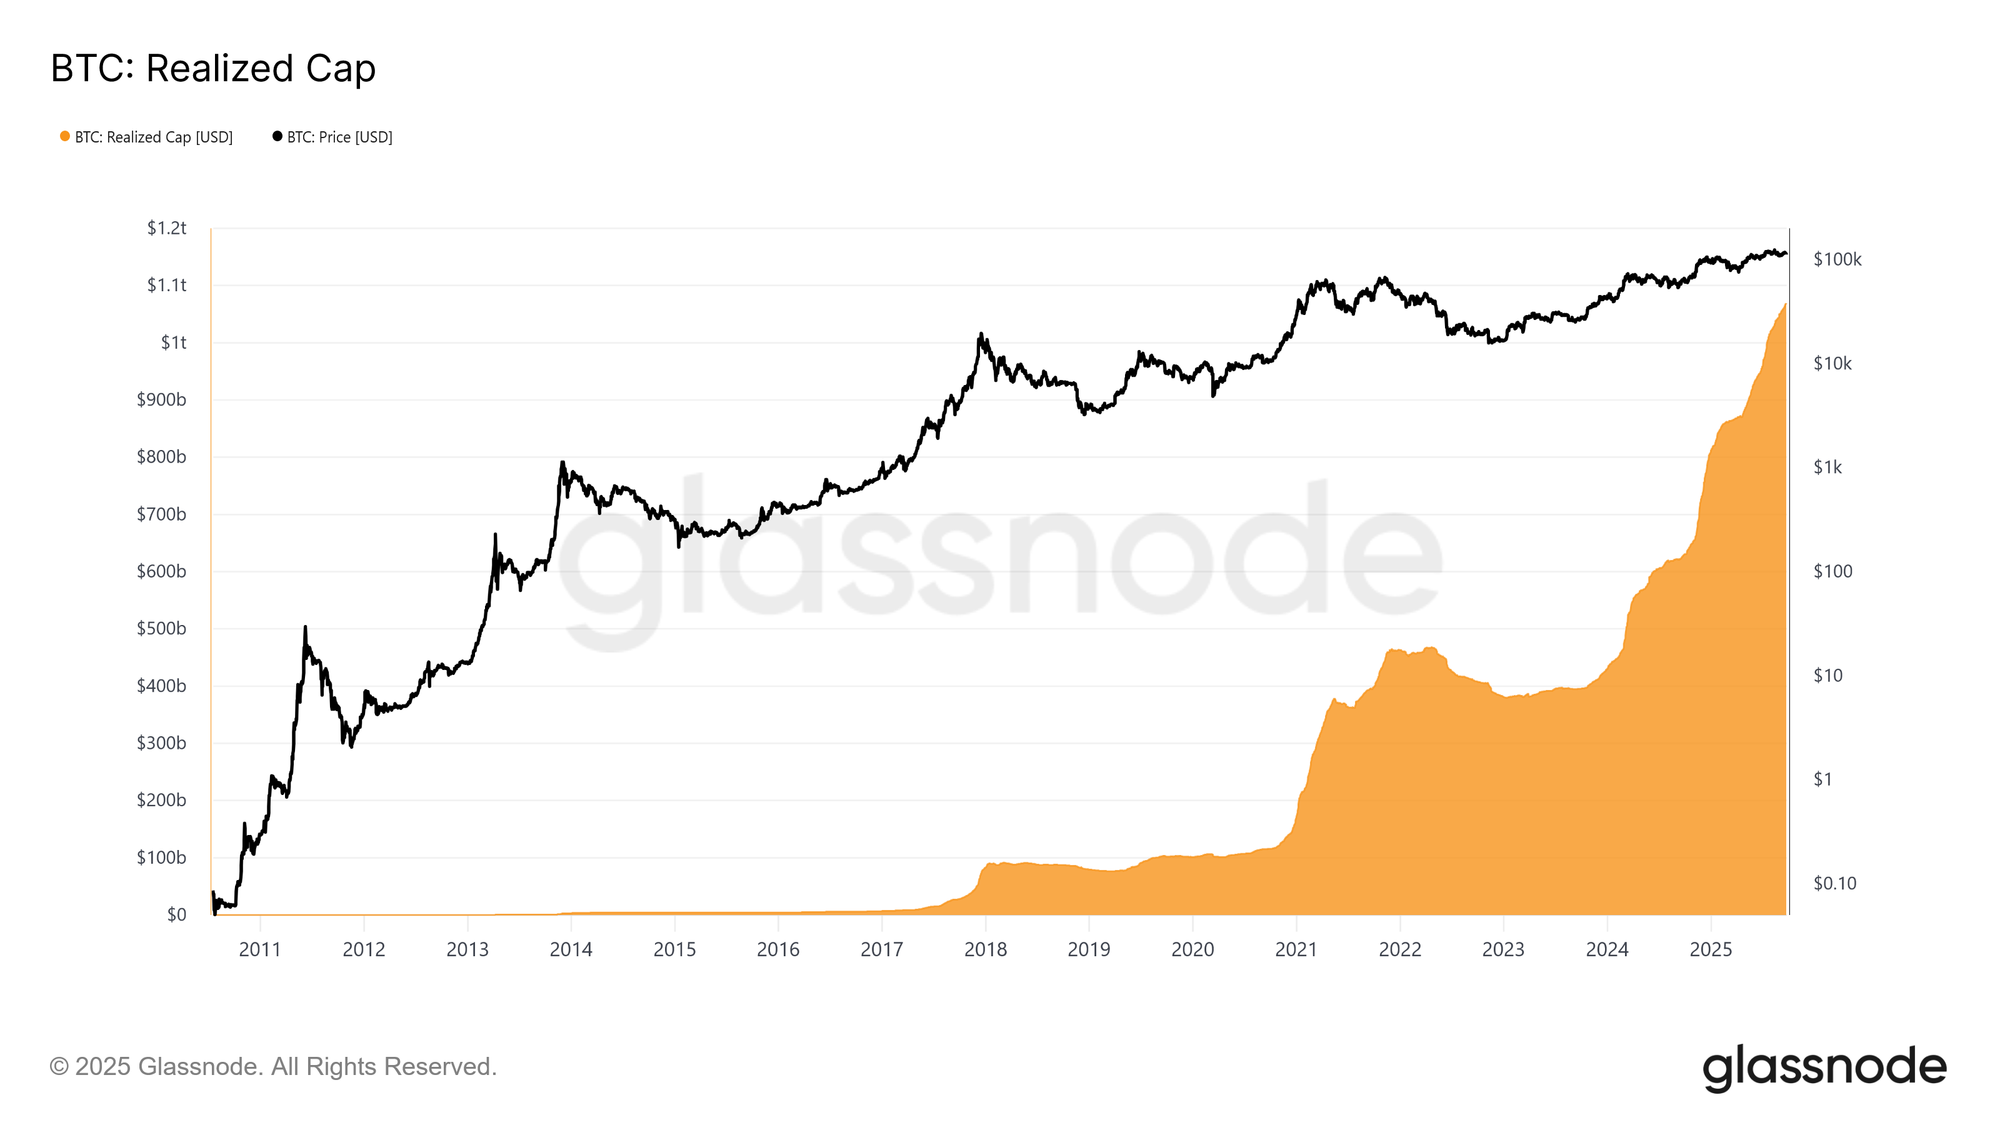
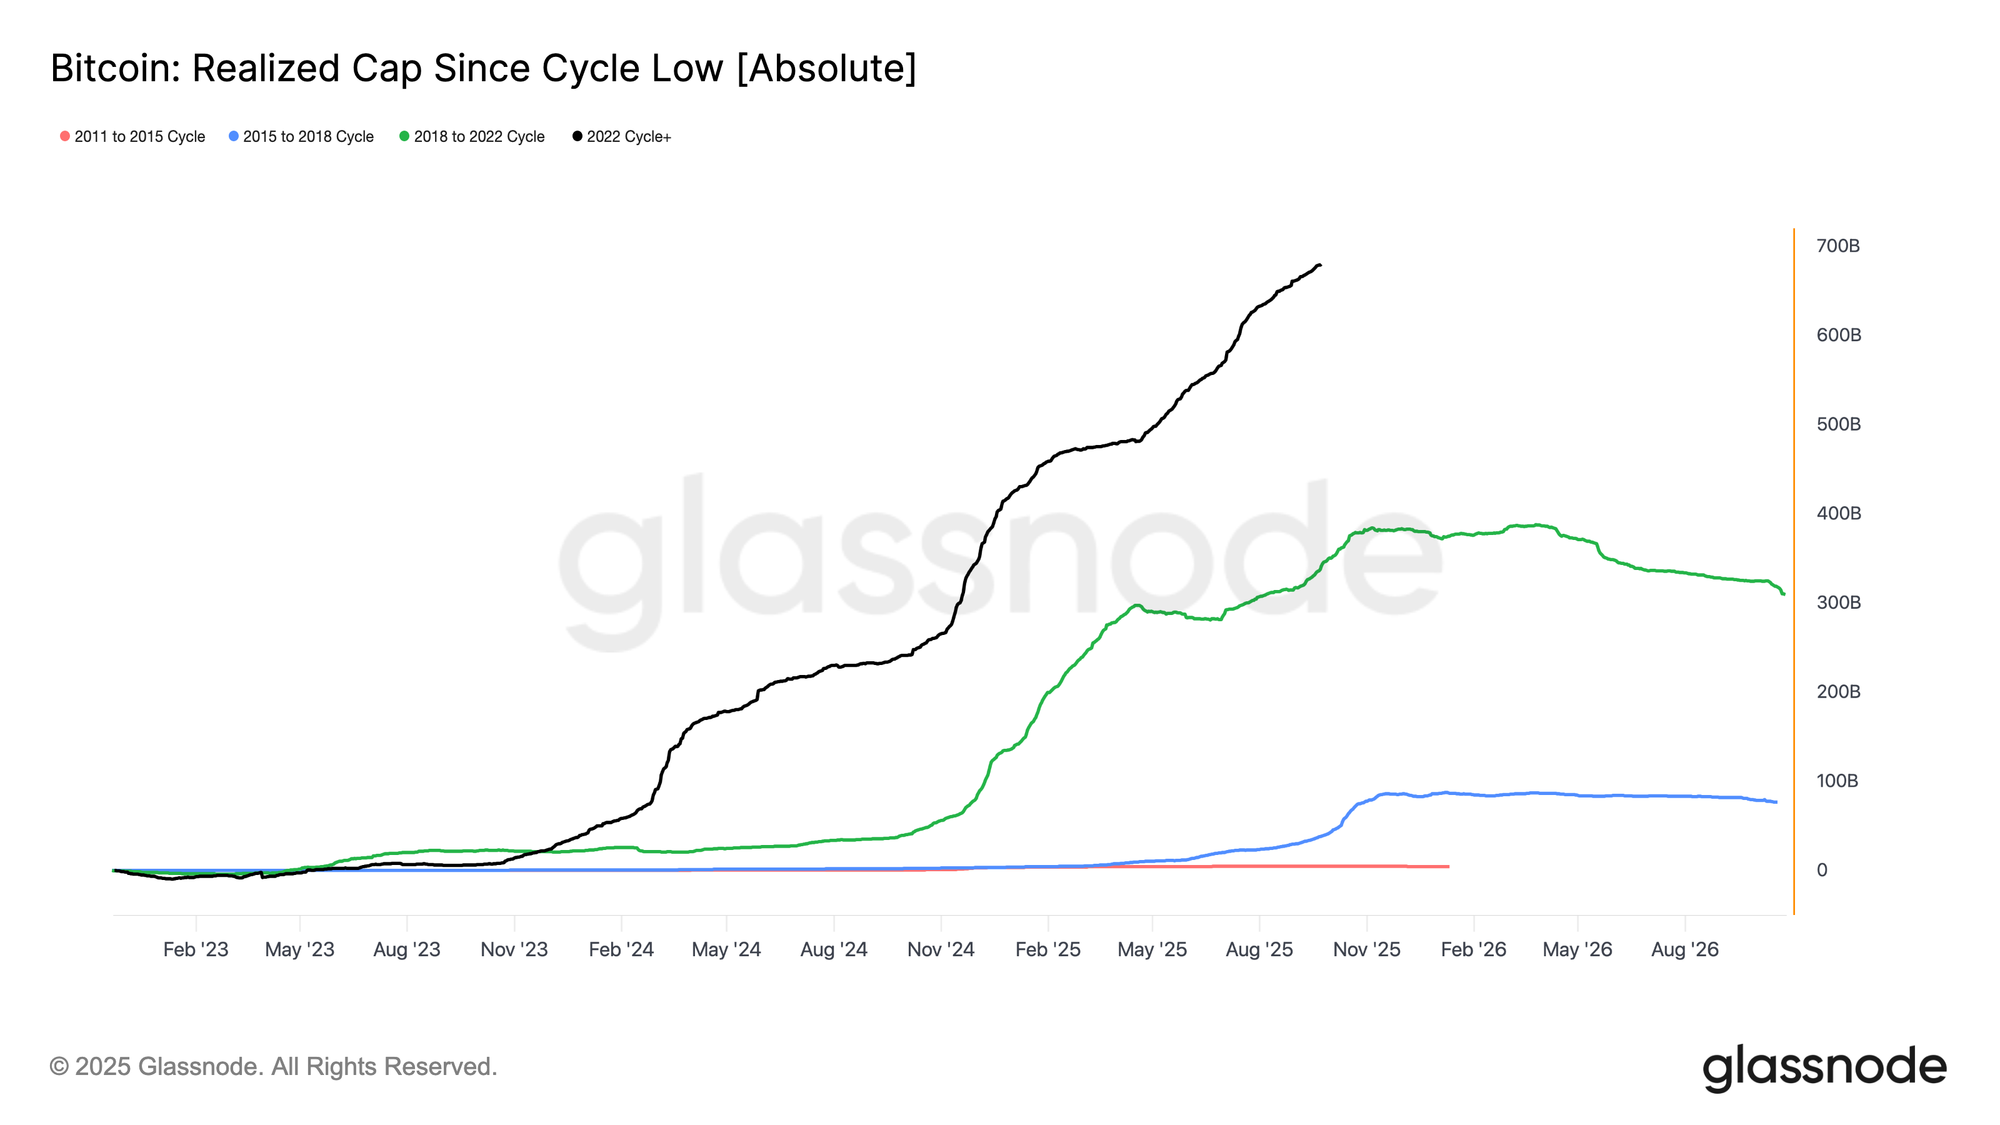
Realized Cap, measuring the cumulative capital invested to absorb older supply at higher values, has risen in three waves since November 2022. Lifting the total to $1.06T, reflecting the scale of inflows underpinning this cycle.
Realized Cap Growth
To contextualize:
- 2011–2015: $4.2B
- 2015–2018: $85B
- 2018–2022: $383B
- 2022–Present: $678B
This cycle has already absorbed $678B in net inflows, nearly 1.8x larger than the prior cycle, underscoring its unprecedented magnitude in capital rotation.
Profit Realization Peaks
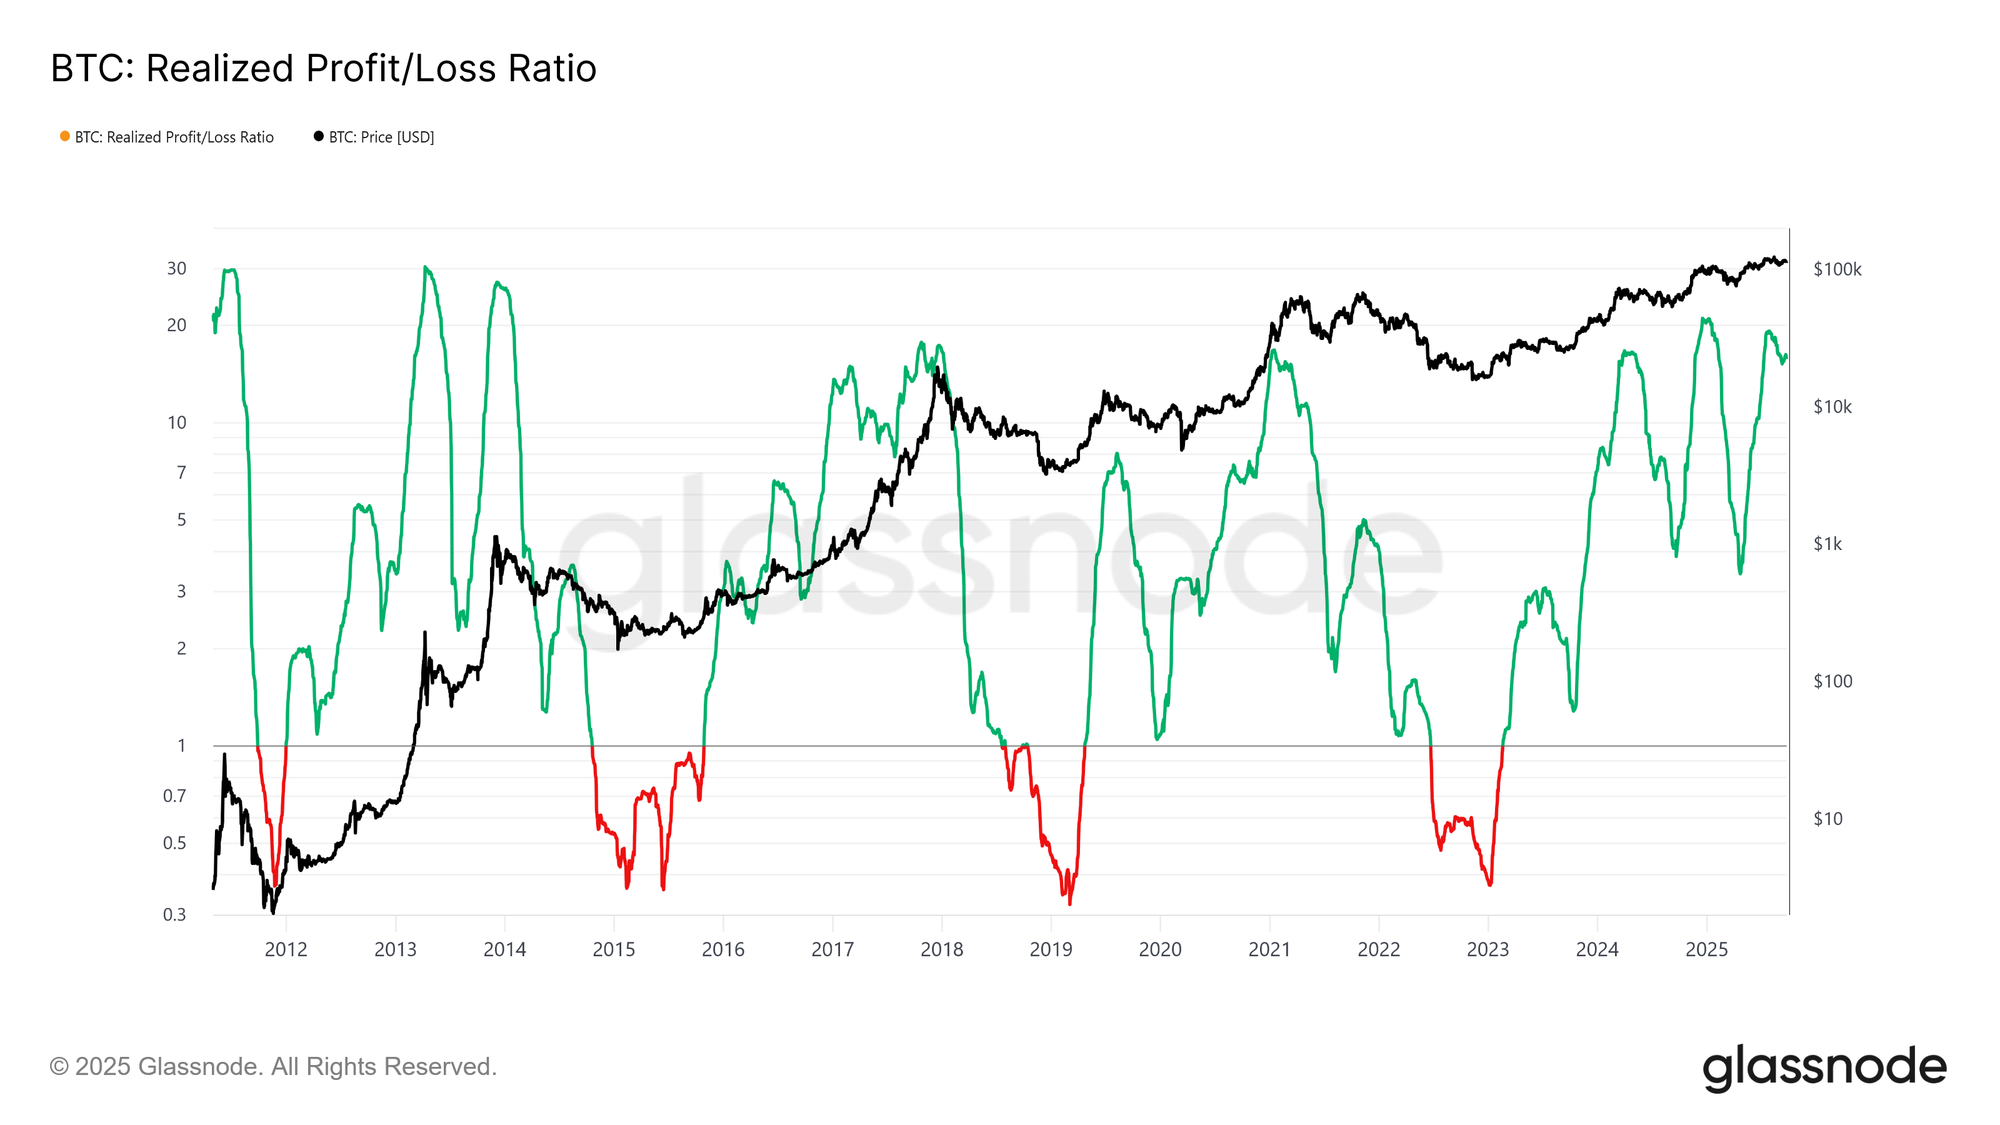
Another difference lies in the inflow structure. Unlike the single prolonged waves of earlier cycles, this cycle has seen three distinct multi-month surges. The Realized Profit/Loss Ratio shows that each time profit-taking exceeded 90% of coins moved, marking cyclical peaks. Having just stepped away from the third such extreme, probabilities favour a cooling phase ahead.
LTH Profit Dominance
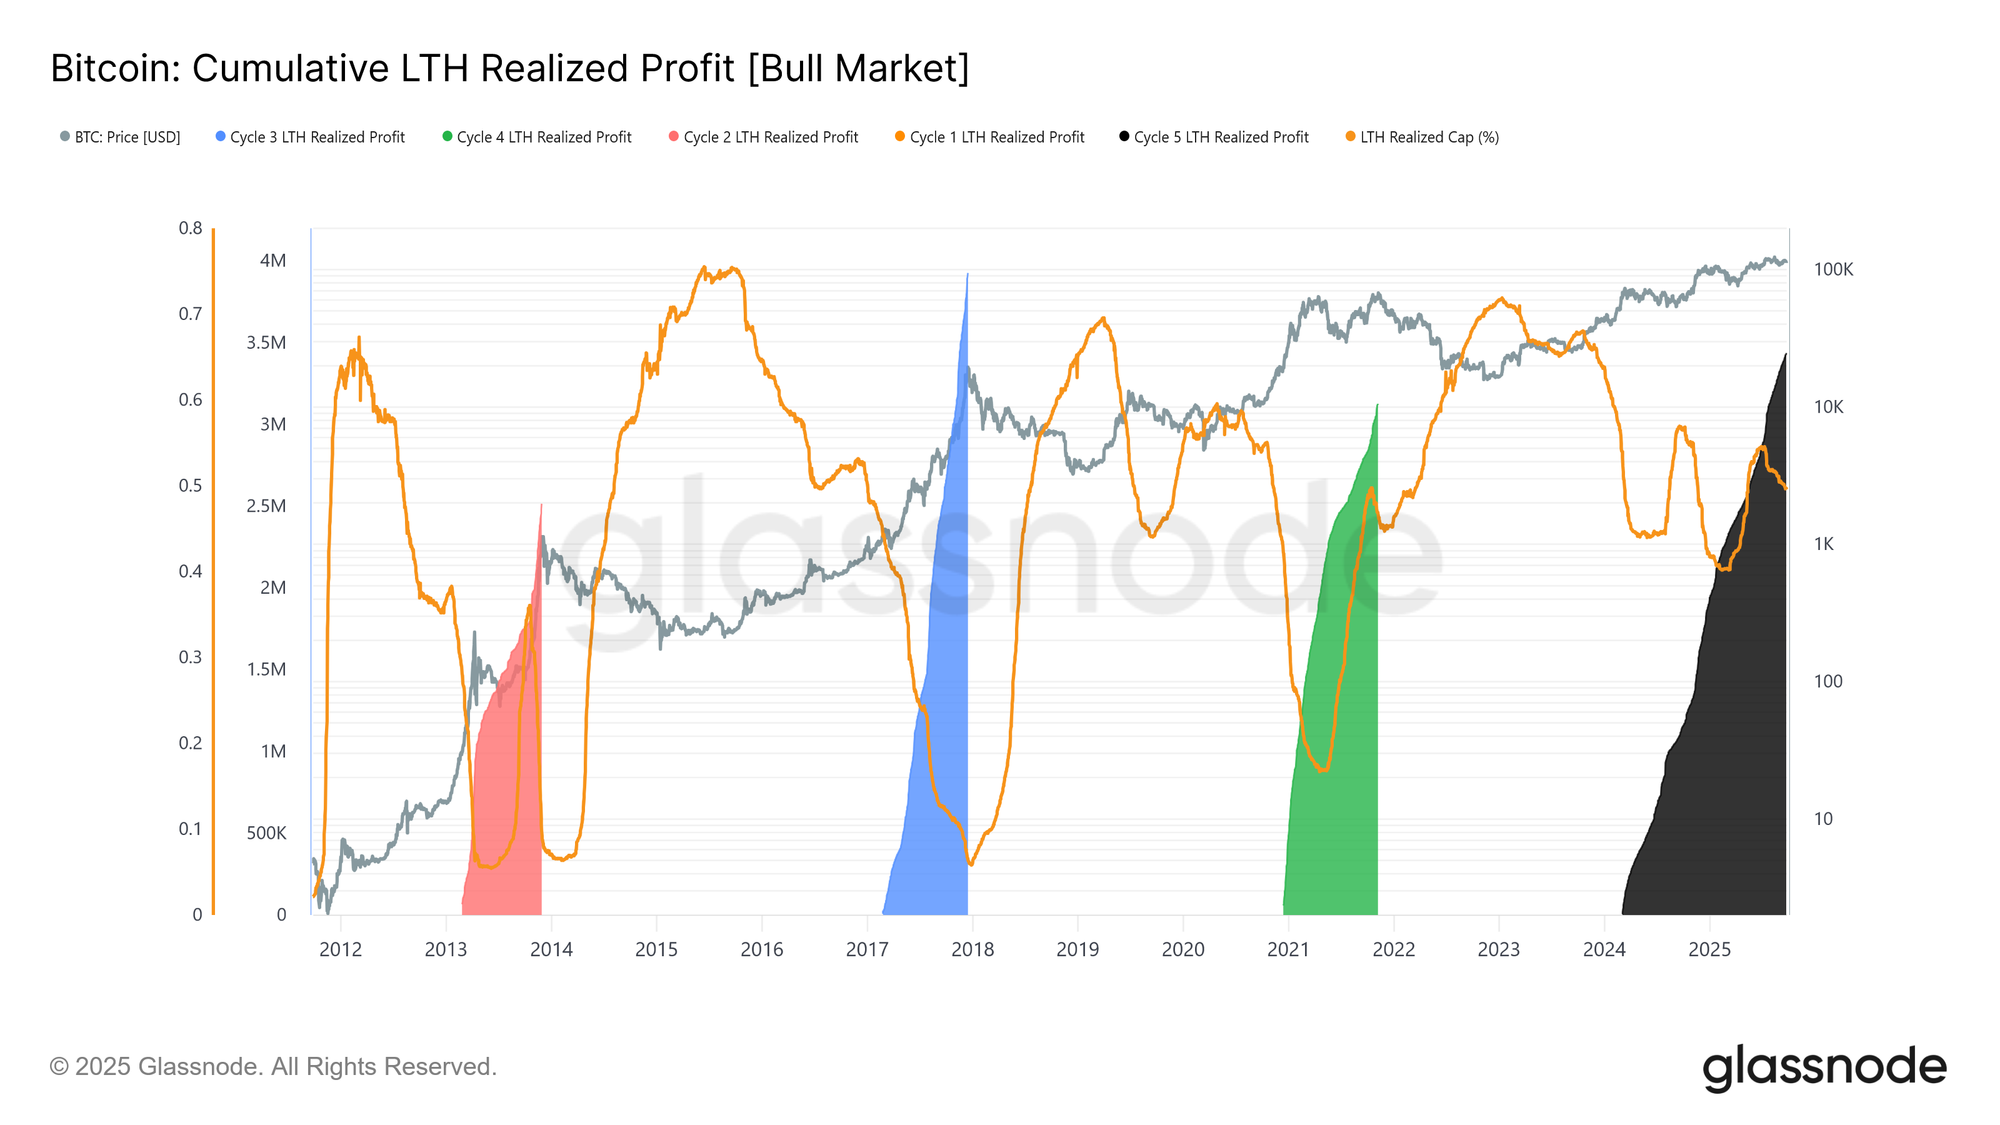
The scale is even clearer when focusing on long-term holders. This measure tracks cumulative LTH profits from a new ATH to the cycle peak. Historically, their heavy distribution marks the tops. In this cycle, LTHs have realized 3.4M BTC, already surpassing previous cycles, highlighting both cohort maturity and the magnitude of capital rotation.
Off-Chain Analysis
ETF Demand vs LTHs
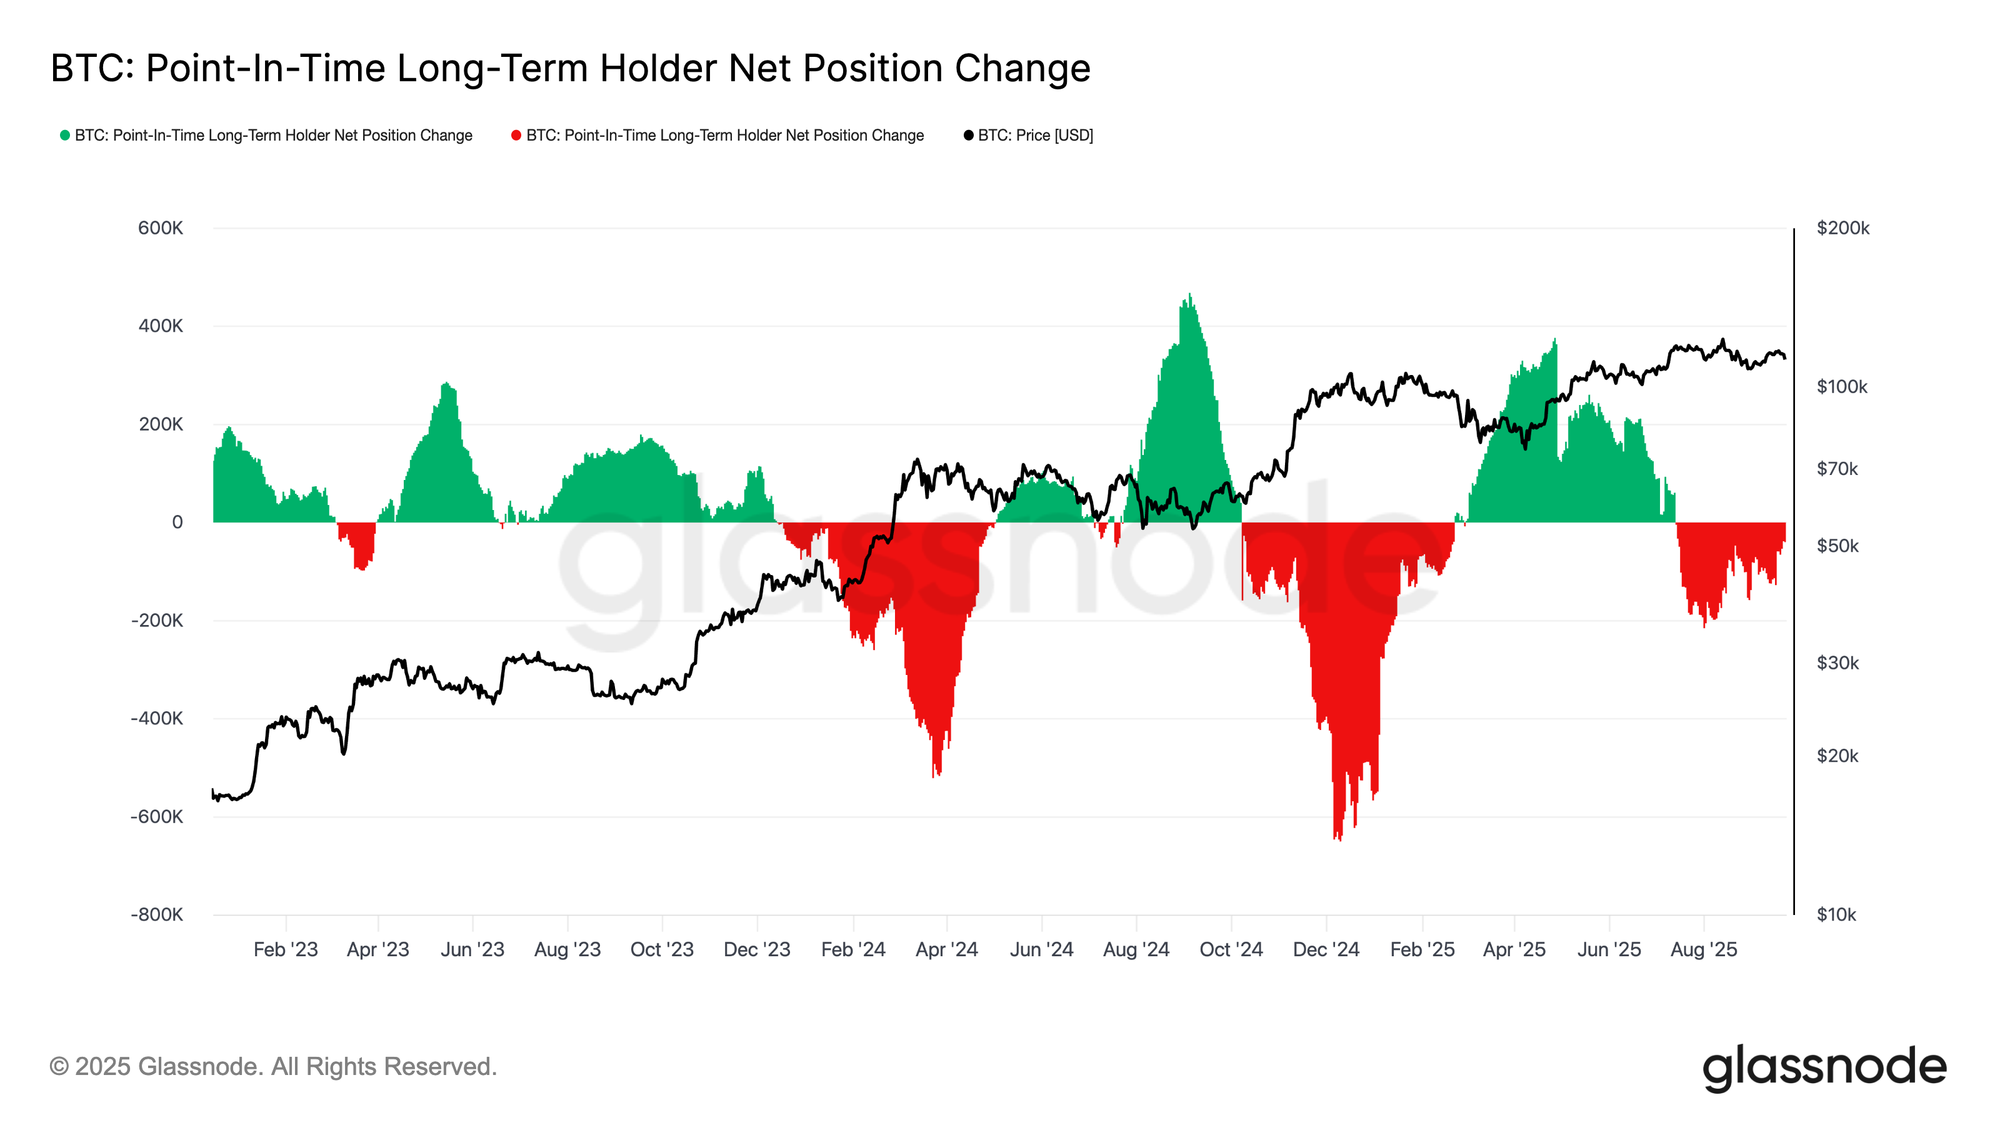
This cycle has also been shaped by the tug-of-war between long-term holders distributing supply and institutional demand via US spot ETFs and DATs. With ETFs a new structural force, price now reflects this push-pull: LTH profit-taking caps upside, while ETF inflows absorb distribution and sustain the cycle’s advance.
Fragile Balance
ETF inflows have so far balanced LTH selling, but with little margin for error. Around the FOMC, LTH distribution surged to 122k BTC/month, while ETF netflows (7D-SMA) collapsed from 2.6k BTC/day to nearly zero. The combination of rising sell pressure and fading institutional demand created a fragile backdrop, setting the stage for weakness.
Spot Market Stress
This fragility was visible in spot markets. During the post-FOMC sell-off, volumes spiked as forced liquidations and thin liquidity exaggerated the move lower. Aggressive sell flows overwhelmed order books, accelerating the decline. While painful, this absorption formed a temporary foundation just above the short-term holder cost basis near $111.8k.
Futures Deleveraging
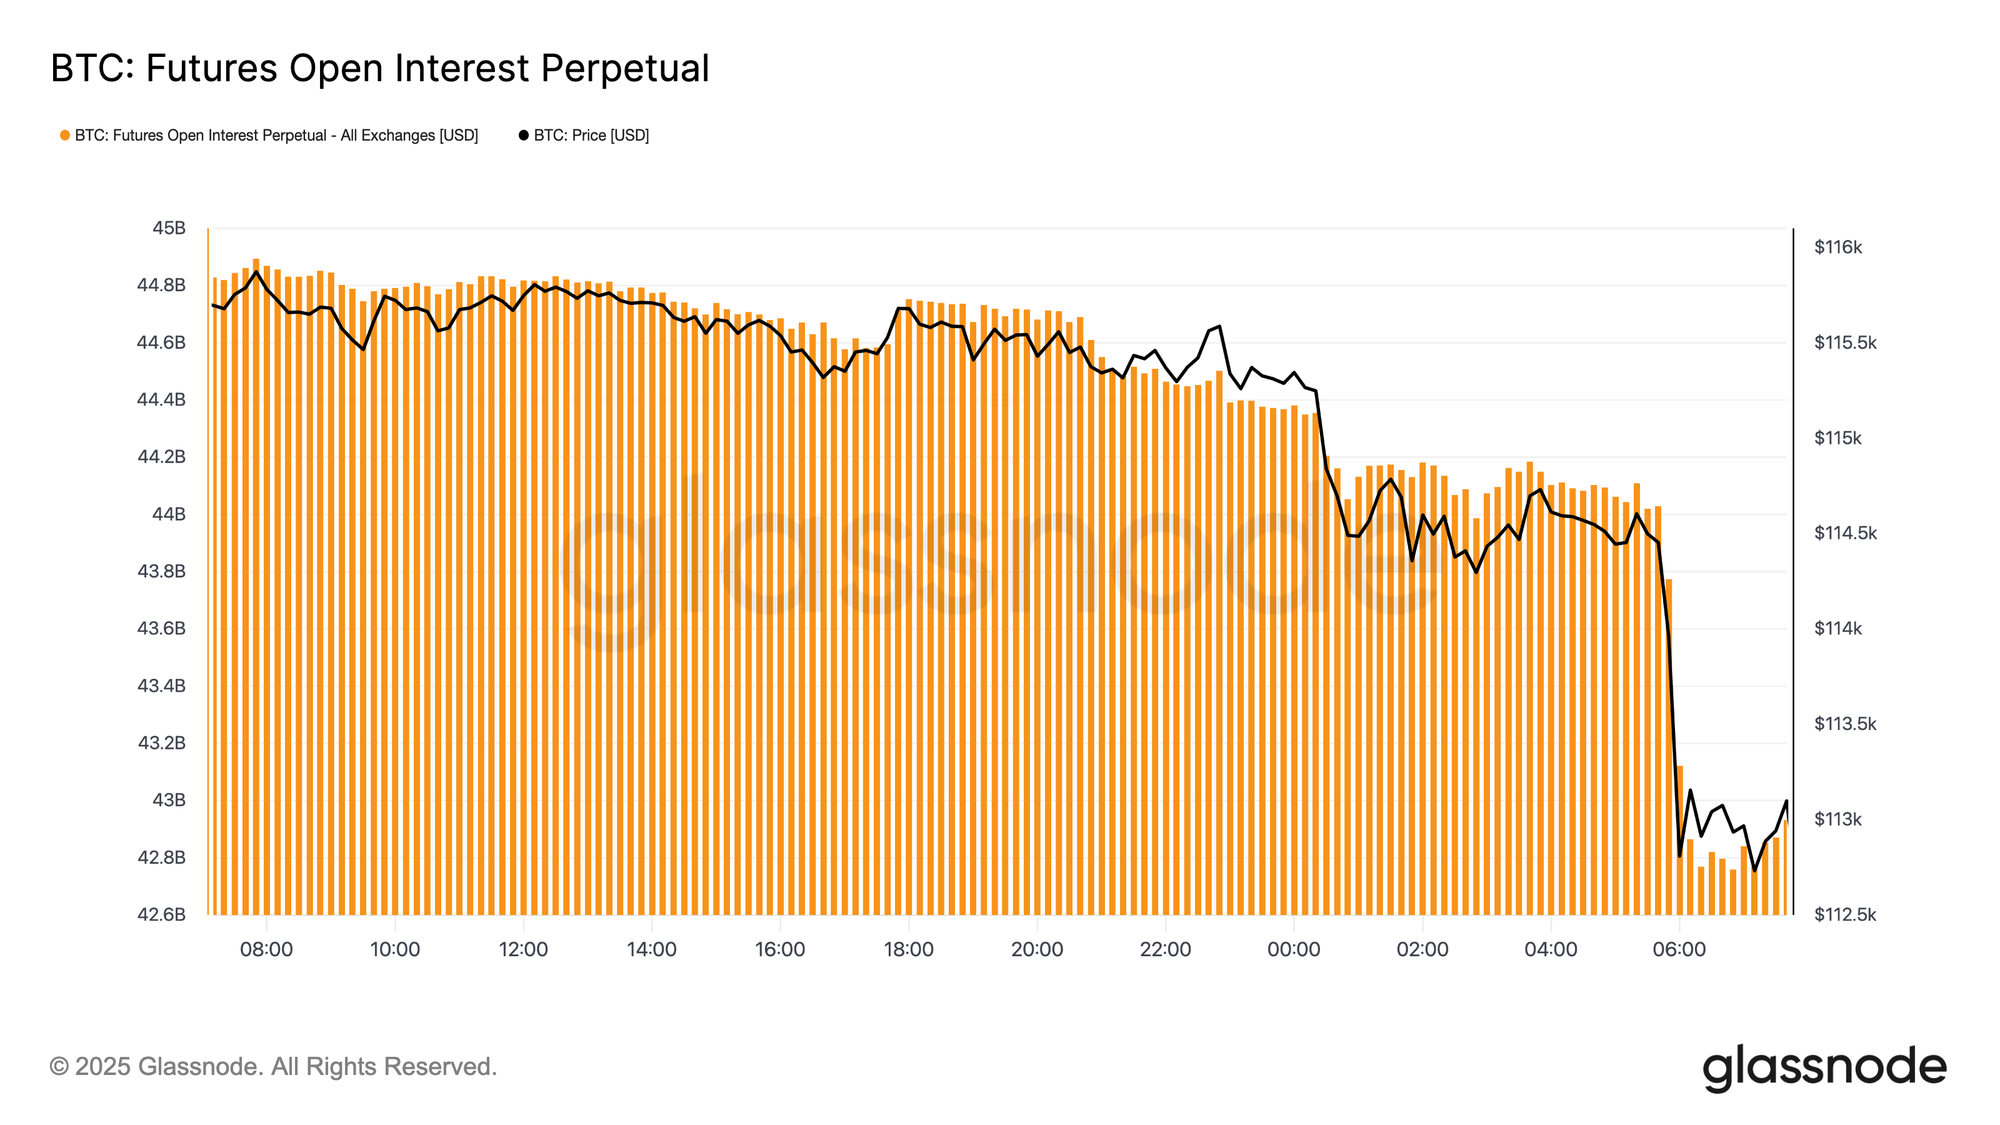
At the same time, futures open interest fell sharply from $44.8B to $42.7B as Bitcoin broke below $113k. This deleveraging event flushed out leveraged longs, amplifying downside pressure. While destabilizing in the moment, the reset helped clear excess leverage and restore balance to derivatives markets.
Liquidation Clusters
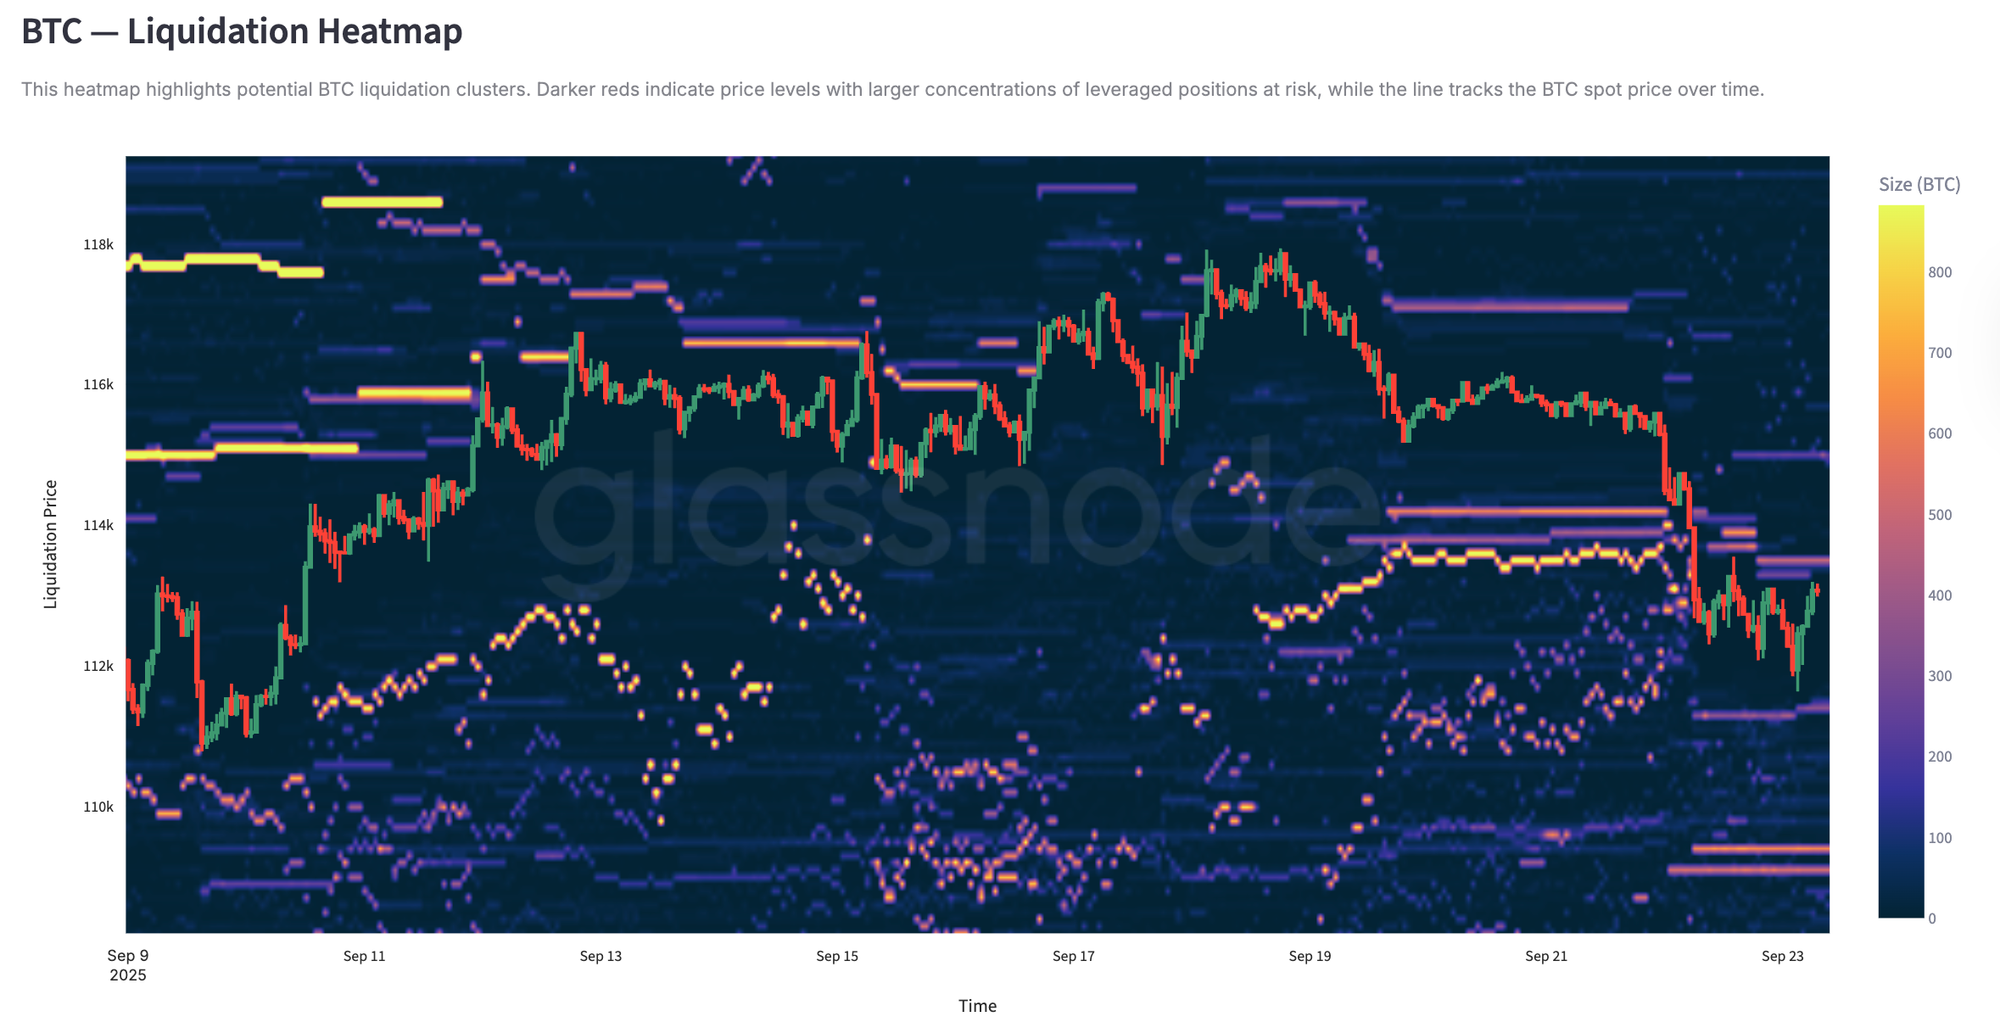
Perpetual liquidation heatmaps add colour. As price broke $114k–$112k, dense clusters of leveraged longs were wiped out, driving heavy liquidations and accelerating downside. Risk pockets remain above $117k, leaving both sides of the market vulnerable to liquidity-driven swings. Without stronger demand, fragility around these levels increases the risk of further sharp moves.
Options Market
Volatility Response
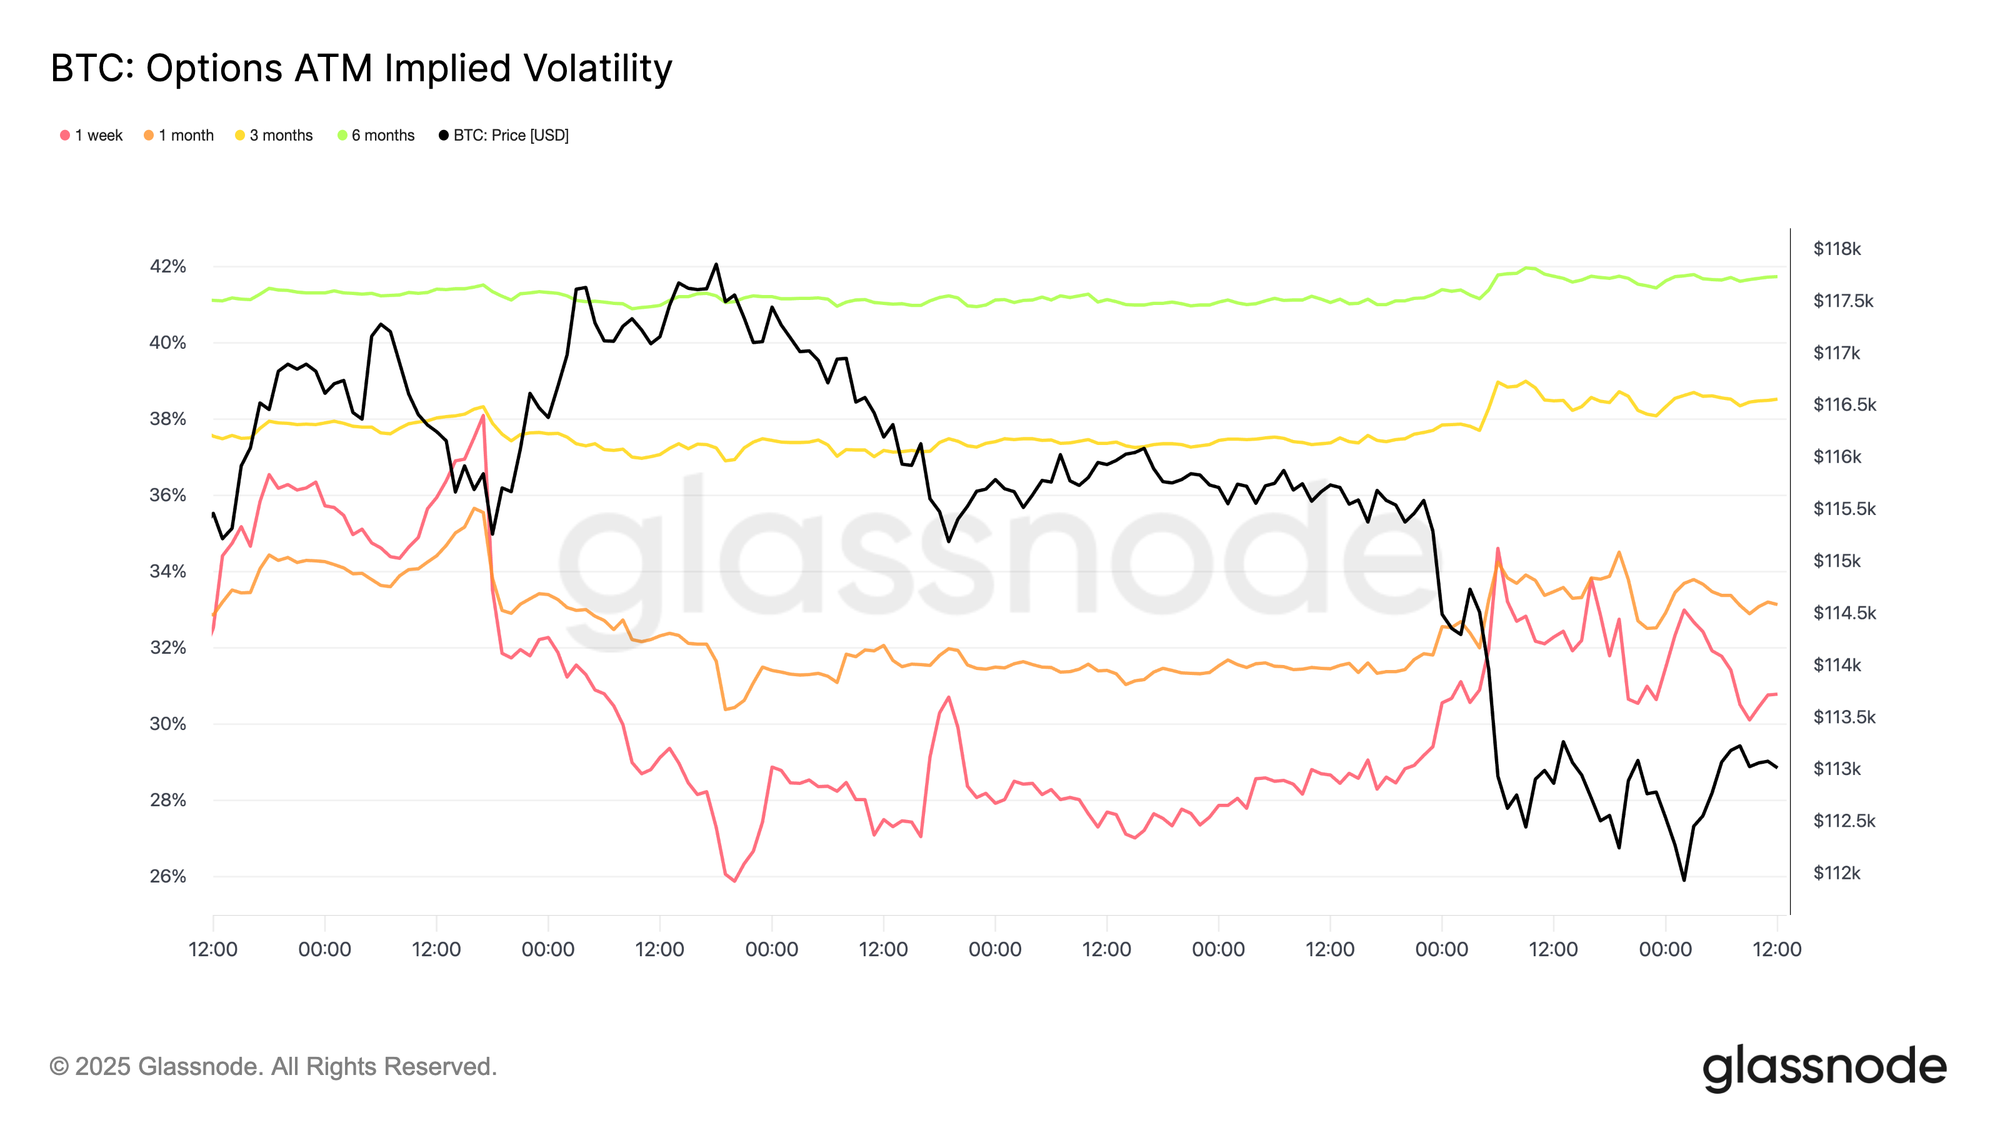
Turning to the options market, implied volatility provides a clear lens on how traders navigated a turbulent week. Two major catalysts shaped the landscape: the first rate cut of the year and the largest liquidation event since 2021. Volatility climbed into the FOMC as hedging demand built, only to fade quickly once the cut was confirmed, signaling the move was largely priced in. However, the sharp Sunday night futures liquidation reignited demand for protection, with one-week IV leading the rebound and strength extending across maturities.
Skew Repricing
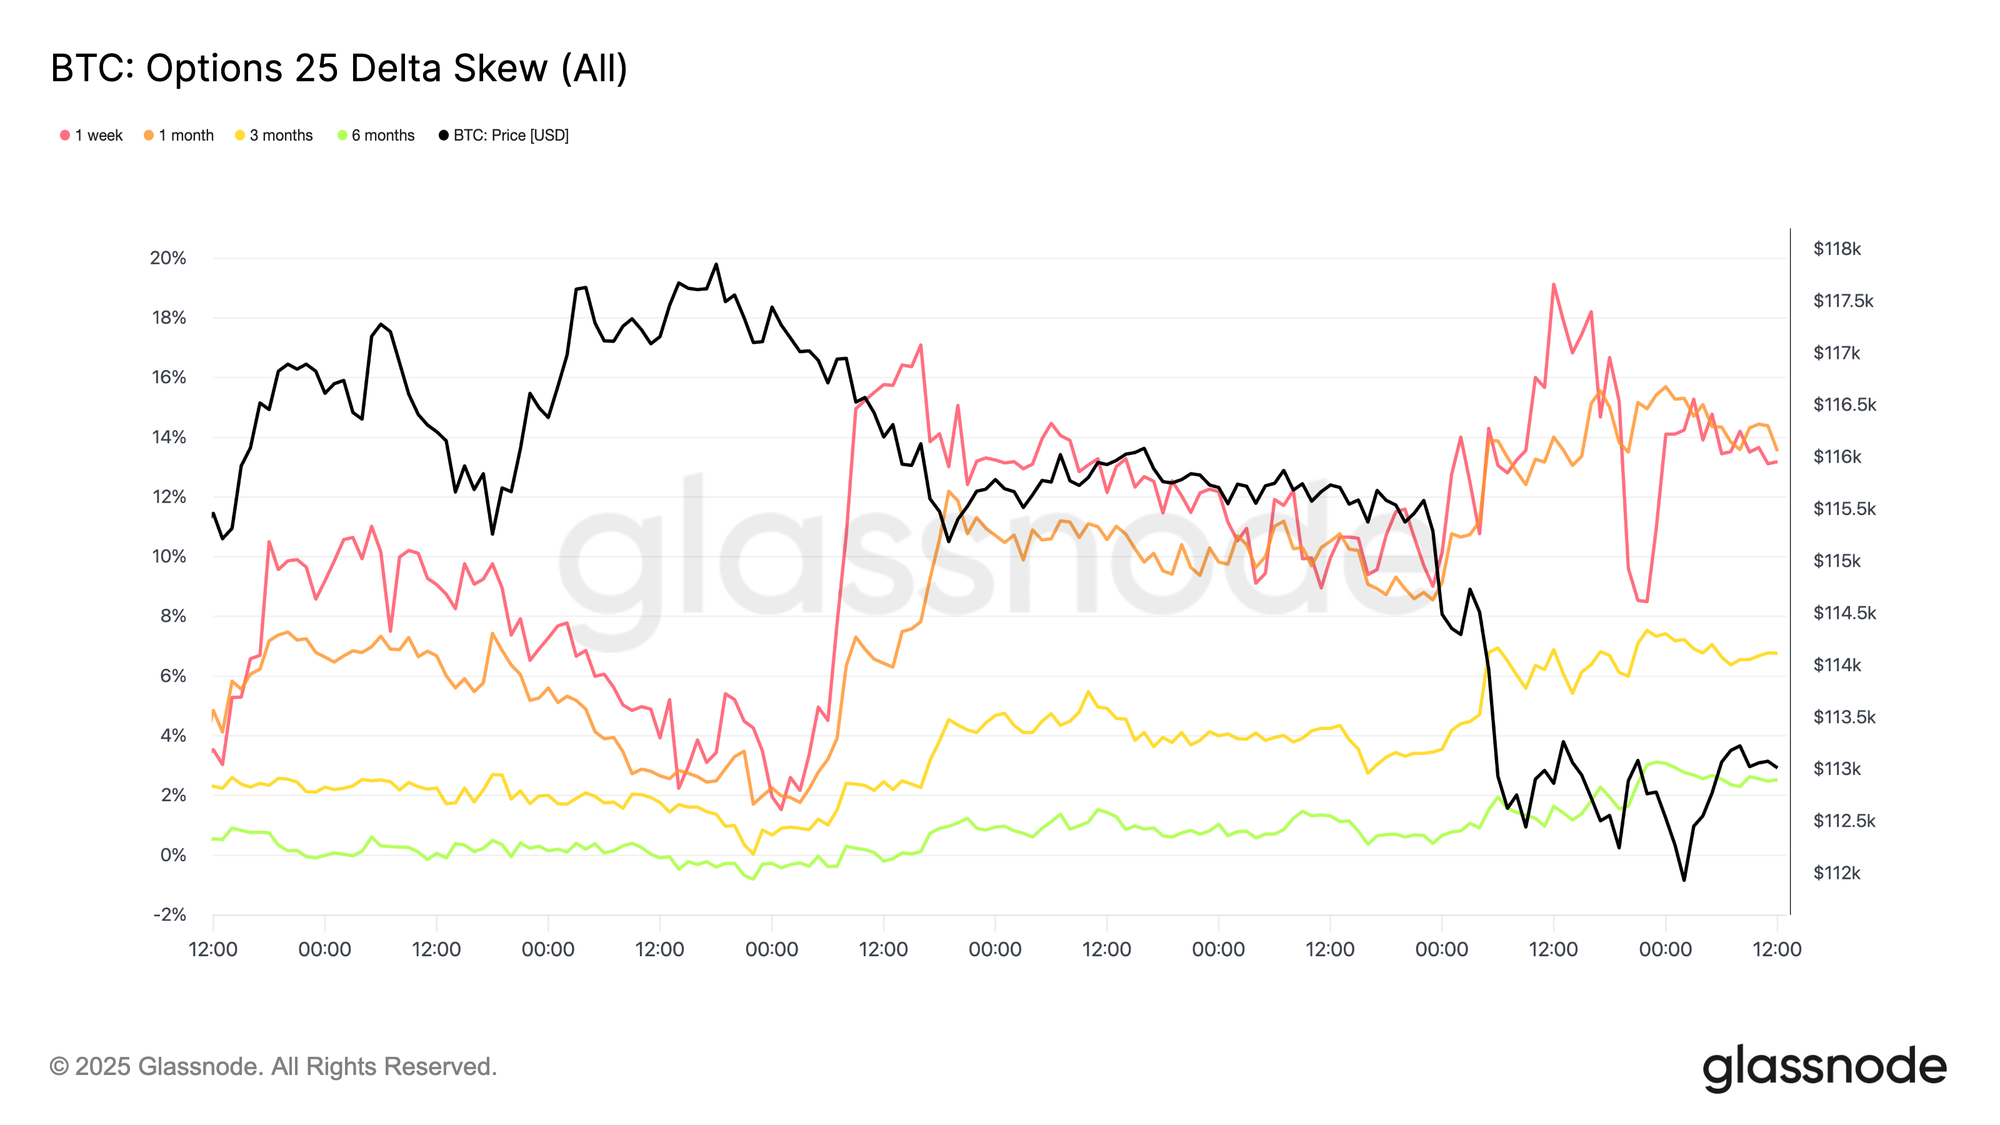
After the FOMC, BTC skew briefly approached equilibrium, with downside puts carrying little premium over calls. That calm quickly faded. On Friday, 1W skew spiked from ~1.5% to 17%, a sharp repricing that also lifted longer expiries.
While skew is often more reactive than predictive, in this case it revealed aggressive demand for puts — either as protection against a sharp drawdown or as a way to monetize volatility. Just two days later, the market delivered on that signal with the largest liquidation event since 2021.
Put/Call Flows
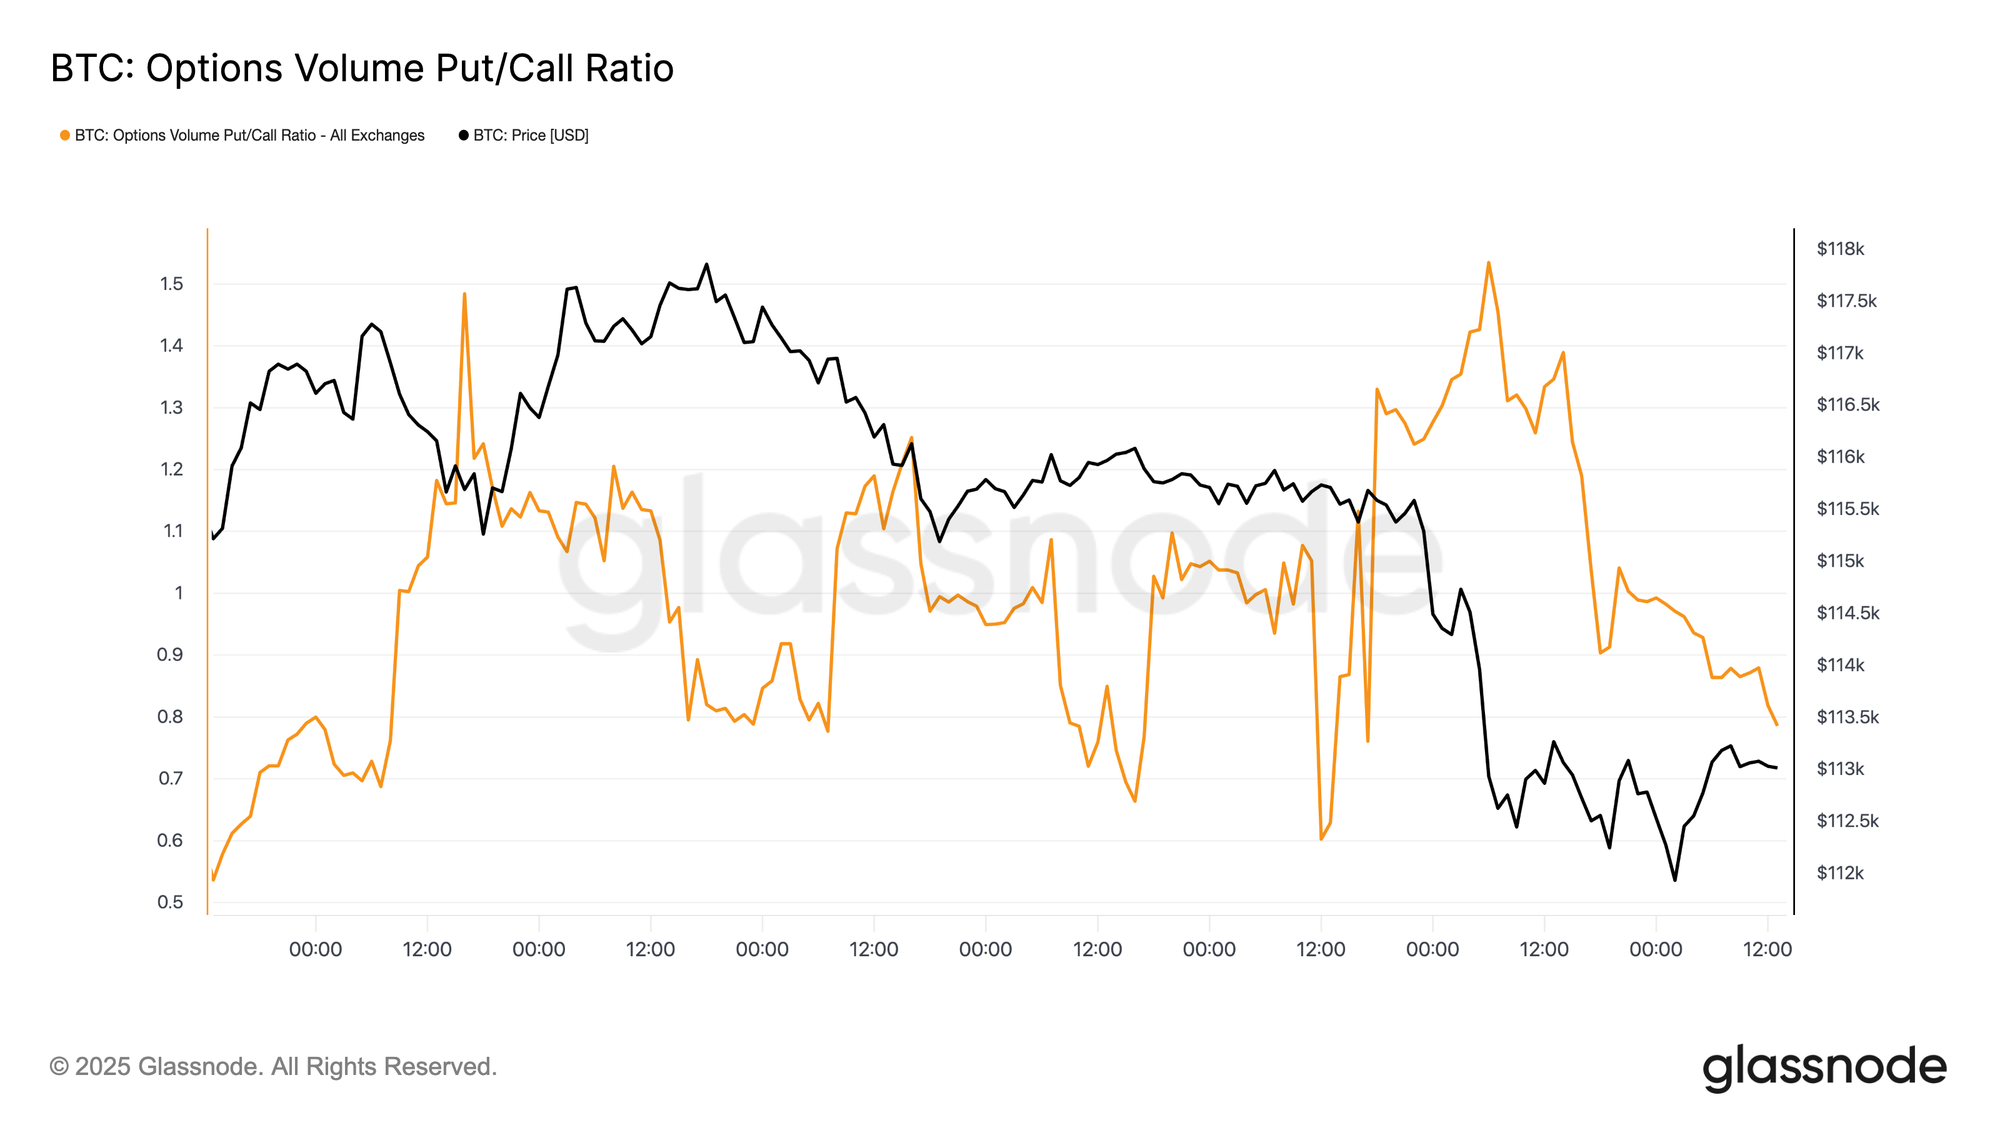
Following the sell-off, the put/call volume ratio has trended lower as traders locked in profits on in-the-money puts and others rotated into cheaper calls. Skew reinforces this picture: short- and mid-dated options remain heavily tilted toward puts, leaving downside protection expensive relative to upside. For participants with a constructive view into year-end, this imbalance creates opportunities — either by accumulating calls at relatively low cost or financing them through selling richly priced downside exposure.
Gamma Overhang
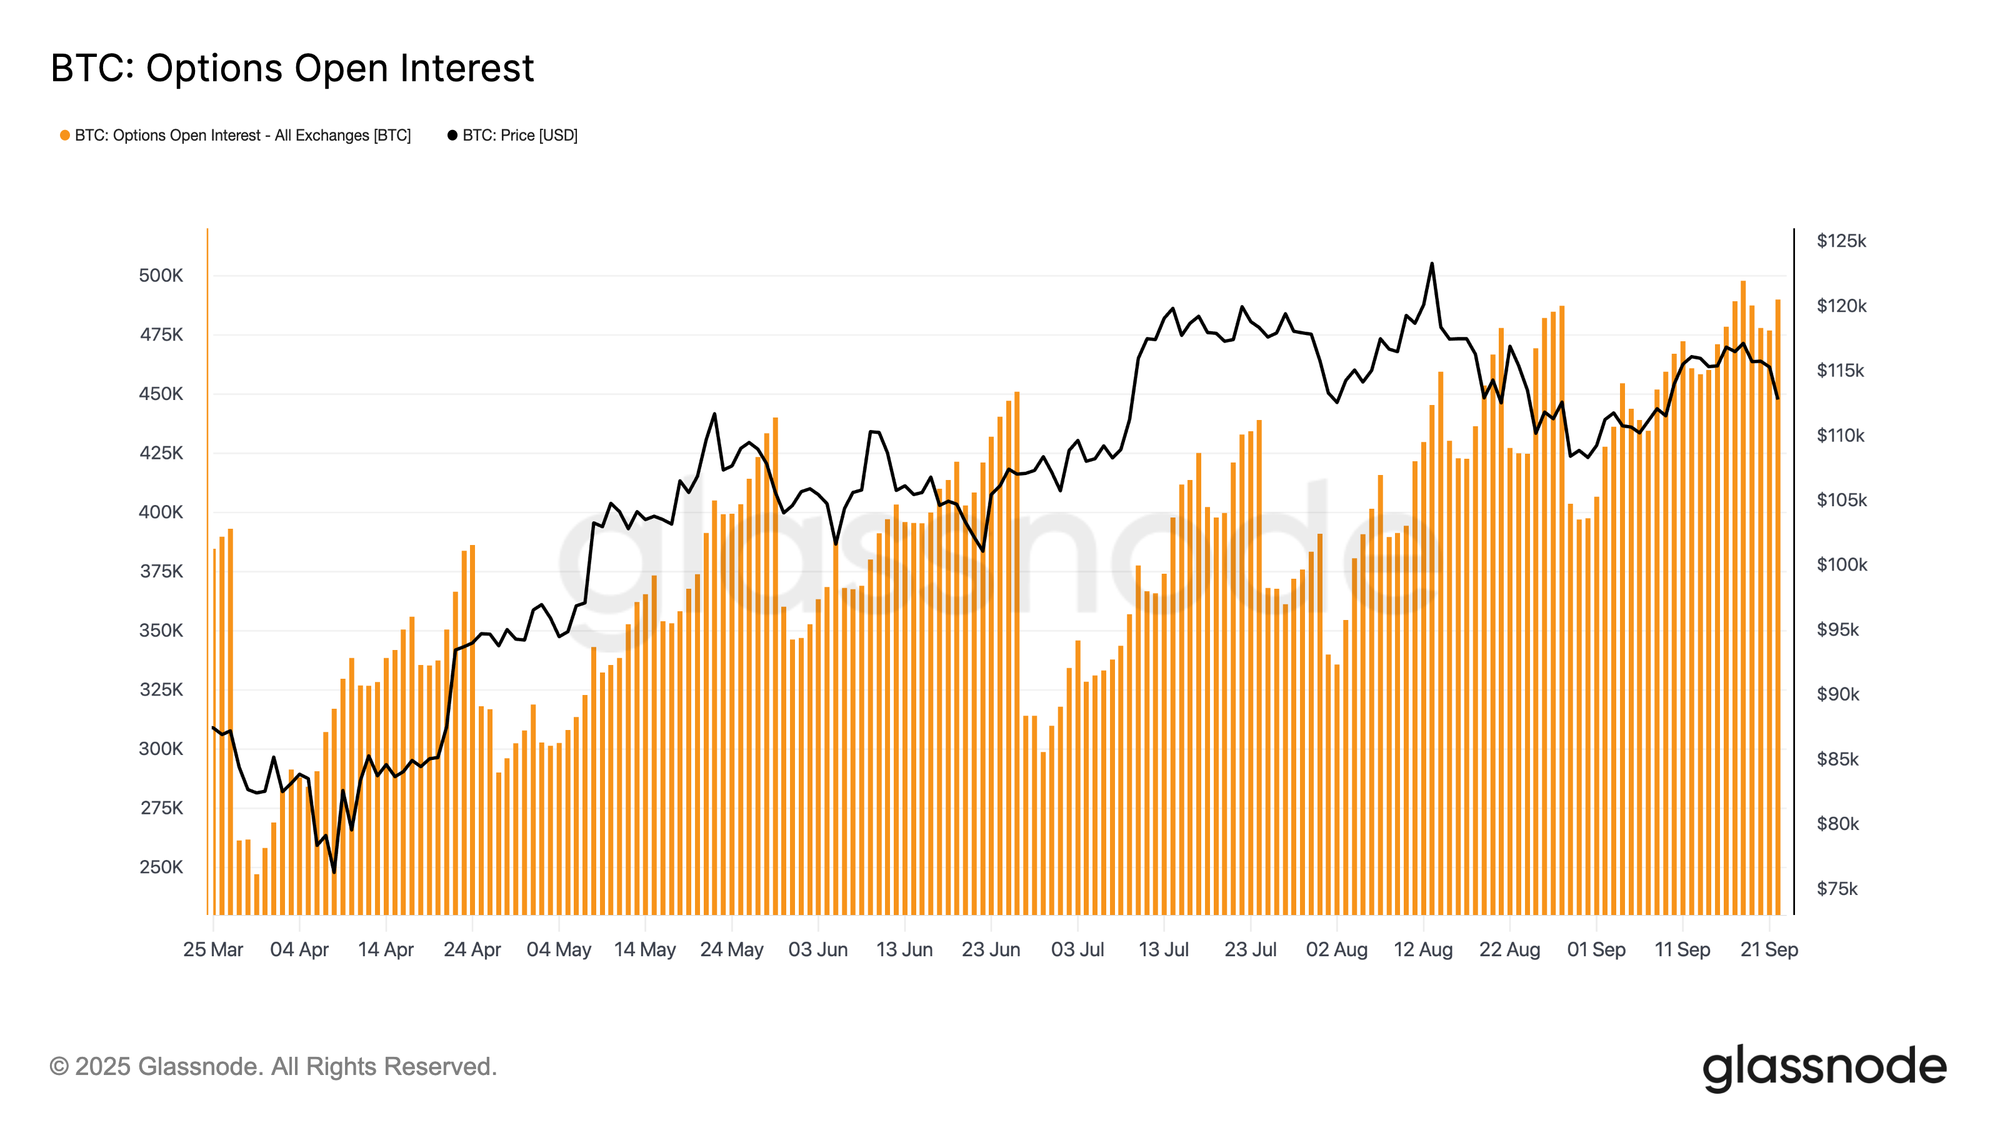
Total options open interest is hovering near all-time highs and will unwind sharply at Friday morning’s expiry, before rebuilding into December. For now, the market sits in a peak gamma zone, where even small price swings force aggressive dealer hedging. Dealers are positioned short gamma on the downside and long gamma on the upside, a structure that amplifies sell-offs while capping rallies. This dynamic skews near-term volatility risk to the downside, reinforcing fragility until expiry clears and positioning resets.
Conclusion
Bitcoin’s retreat following the FOMC reflects a textbook “buy the rumour, sell the news” pattern, but the broader backdrop points to growing exhaustion. On-chain, the current 8% drawdown is modest compared to past cycles, yet comes after three major waves of capital inflows that lifted realized cap by $678B, almost double the prior cycle. Long-term holders have already realized 3.4M BTC in profits, underscoring the heavy distribution and maturity of the rally.
At the same time, ETF inflows that previously absorbed supply have slowed, creating a fragile balance. Spot volumes spiked on forced selling, futures saw sharp deleveraging, and options markets priced in downside risk as skew surged. Together, these signals suggest a market running out of fuel, with liquidity-driven swings dominating.
Unless demand from institutions and holders aligns again, the risk of deeper cooling remains high, highlighting a macro structure that increasingly resembles exhaustion.
Disclaimer: This report does not provide any investment advice. All data is provided for informational and educational purposes only. No investment decision shall be based on the information provided here, and you are solely responsible for your own investment decisions.
Exchange balances presented are derived from Glassnode’s comprehensive database of address labels, which are amassed through both officially published exchange information and proprietary clustering algorithms. While we strive to ensure the utmost accuracy in representing exchange balances, it is important to note that these figures might not always encapsulate the entirety of an exchange’s reserves, particularly when exchanges refrain from disclosing their official addresses. We urge users to exercise caution and discretion when utilizing these metrics. Glassnode shall not be held responsible for any discrepancies or potential inaccuracies.
Please read our Transparency Notice when using exchange data.
- Join our Telegram channel.
- For on-chain metrics, dashboards, and alerts, visit Glassnode Studio.