Давайте создадим простую гипотетическую торговую стратегию. Ее предпосылка проста и основана на широко обсуждаемой концепции: когда монеты покидают биржи, это обычно бычий сигнал. Логика интуитивна: перемещение монет с бирж обычно сигнализирует о том, что держатели выводят их в собственное хранение, сокращая доступное предложение для продажи. И наоборот, поступление монет на биржи может указывать на то, что держатели готовятся к продаже.
Однодневный отток, однако, это всего лишь шум. Чтобы выявить genuine trend (истинный тренд), мы применим скользящие средние (moving average crossover) к балансу на бирже. Когда краткосрочная средняя опускается ниже долгосрочной, это подтверждает, что монеты последовательно покидают биржи в виде устойчивой модели, а не единичных событий.
Используя данные Glassnode о балансе на бирже Binance, мы определяем следующее:
- Входить на рынок, когда 5-дневная скользящая средняя баланса BTC на Binance опускается ниже ее 14-дневной скользящей средней, что сигнализирует об устойчивом тренде оттока.
- Выходить с рынка, когда 5-дневная средняя снова поднимается выше 14-дневной, что сигнализирует о развороте тренда оттока и возврате монет на биржу.
Затем мы сравниваем эту стратегию с простым удержанием (HODL) BTC за тот же период, начиная с 1 января 2024 года по 9 марта 2026 года, с начальным капиталом в 1000 долларов и комиссией за сделку в 0,1%.
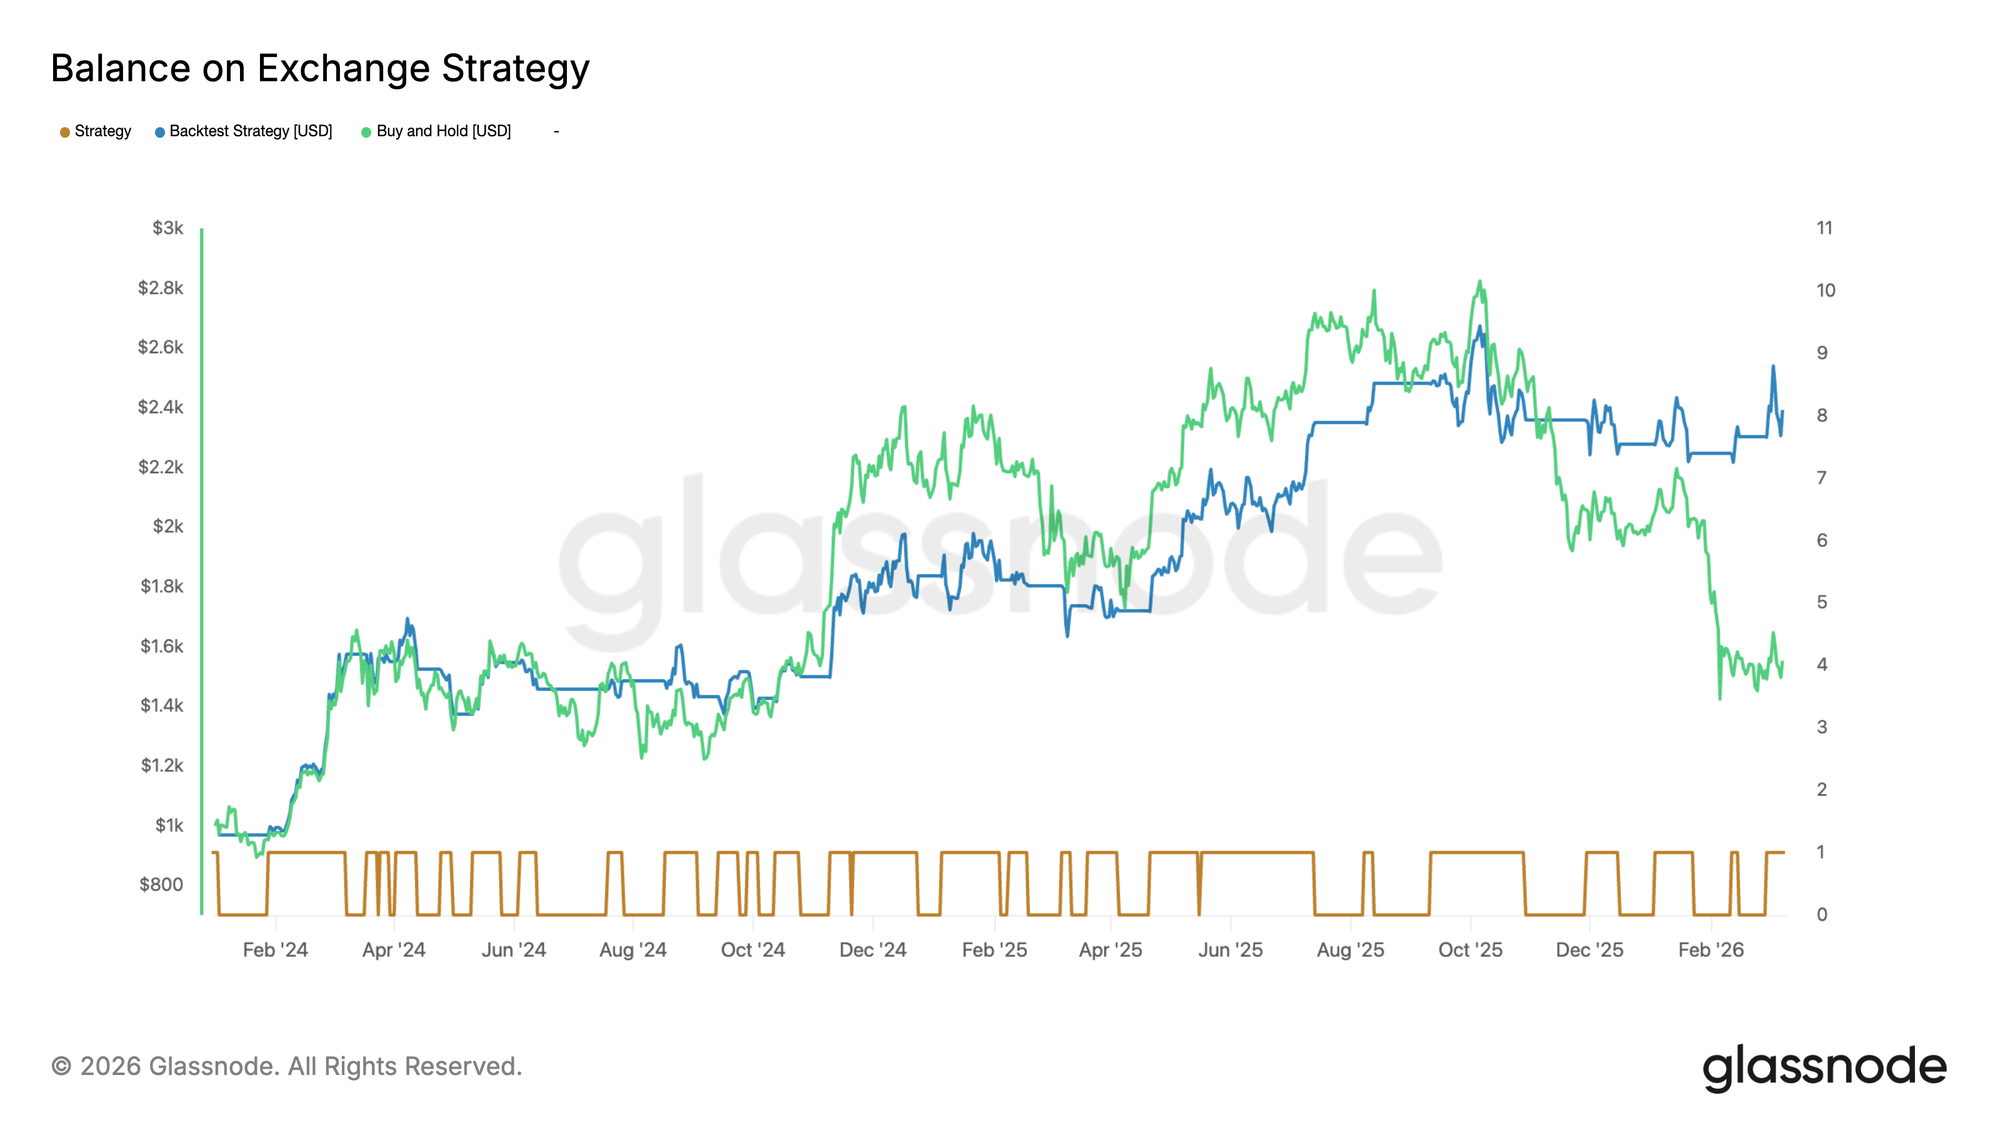
Вот как читать этот график:
🟫 Коричневая линия внизу — это бинарный торговый сигнал, переключающийся между нахождением на рынке (1) и вне рынка (0).
🟦 Синяя линия отслеживает стоимость портфеля стратегии с течением времени.
🟩 Зеленая линия — это эталонный портфель стратегии «купи и держи» (buy-and-hold).
Мы можем наблюдать, что стратегия, основанная на биржевом балансе, показала себя довольно хорошо, хотя временами стратегия «купи и держи» превосходила ее. Однако в последние дни исследовательского периода стратегия на основе биржевого баланса догнала. Хотя некоторых инвесторов может привлечь сочетание сниженной волатильности и в конечном итоге сопоставимой с buy-and-hold производительности, итоговые цифры вводят в заблуждение — и вот почему.
Проблема: Мутация данных и смещение взгляда вперед (Look-Ahead Bias)
Метрики не статичны. Многие из них ретроспективно пересматриваются по мере поступления новой информации. Это особенно верно для метрик, которые зависят от кластеризации адресов или маркировки объектов, таких как балансы on-chain бирж. Однако это также касается и таких метрик, как объем торгов или цена, поскольку отдельные биржи иногда могут передавать свои данные с небольшой задержкой.
Это означает, что значение, которое вы видите сегодня, скажем, за 15 января 2024 года, может не совпадать со значением, опубликованным 15 января 2024 года. Данные были пересмотрены задним числом. Когда вы проводите бэктест стратегии на этих пересмотренных данных, вы неявно используете информацию, которая не была доступна в момент принятия торговых решений. Это вводит смещение взгляда вперед (look-ahead bias).
Честный бэктест: Использование данных на момент времени (Point-in-Time Data)
Поэтому давайте повторим точь-в-точь тот же бэктест — та же логика сигналов, те же параметры, те же даты, те же комиссии — но на этот раз используя вариант метрики Биржевого Баланса «На момент времени» (Point-in-Time, PiT), доступный в Glassnode Studio.
Метрики PiT строго добавляются только путем дополнения (append-only) и неизменяемы (immutable). Каждая историческая точка данных отражает только ту информацию, которая была известна на момент ее первоначального вычисления. Никаких ретроспективных пересмотров, никакого смещения взгляда вперед.
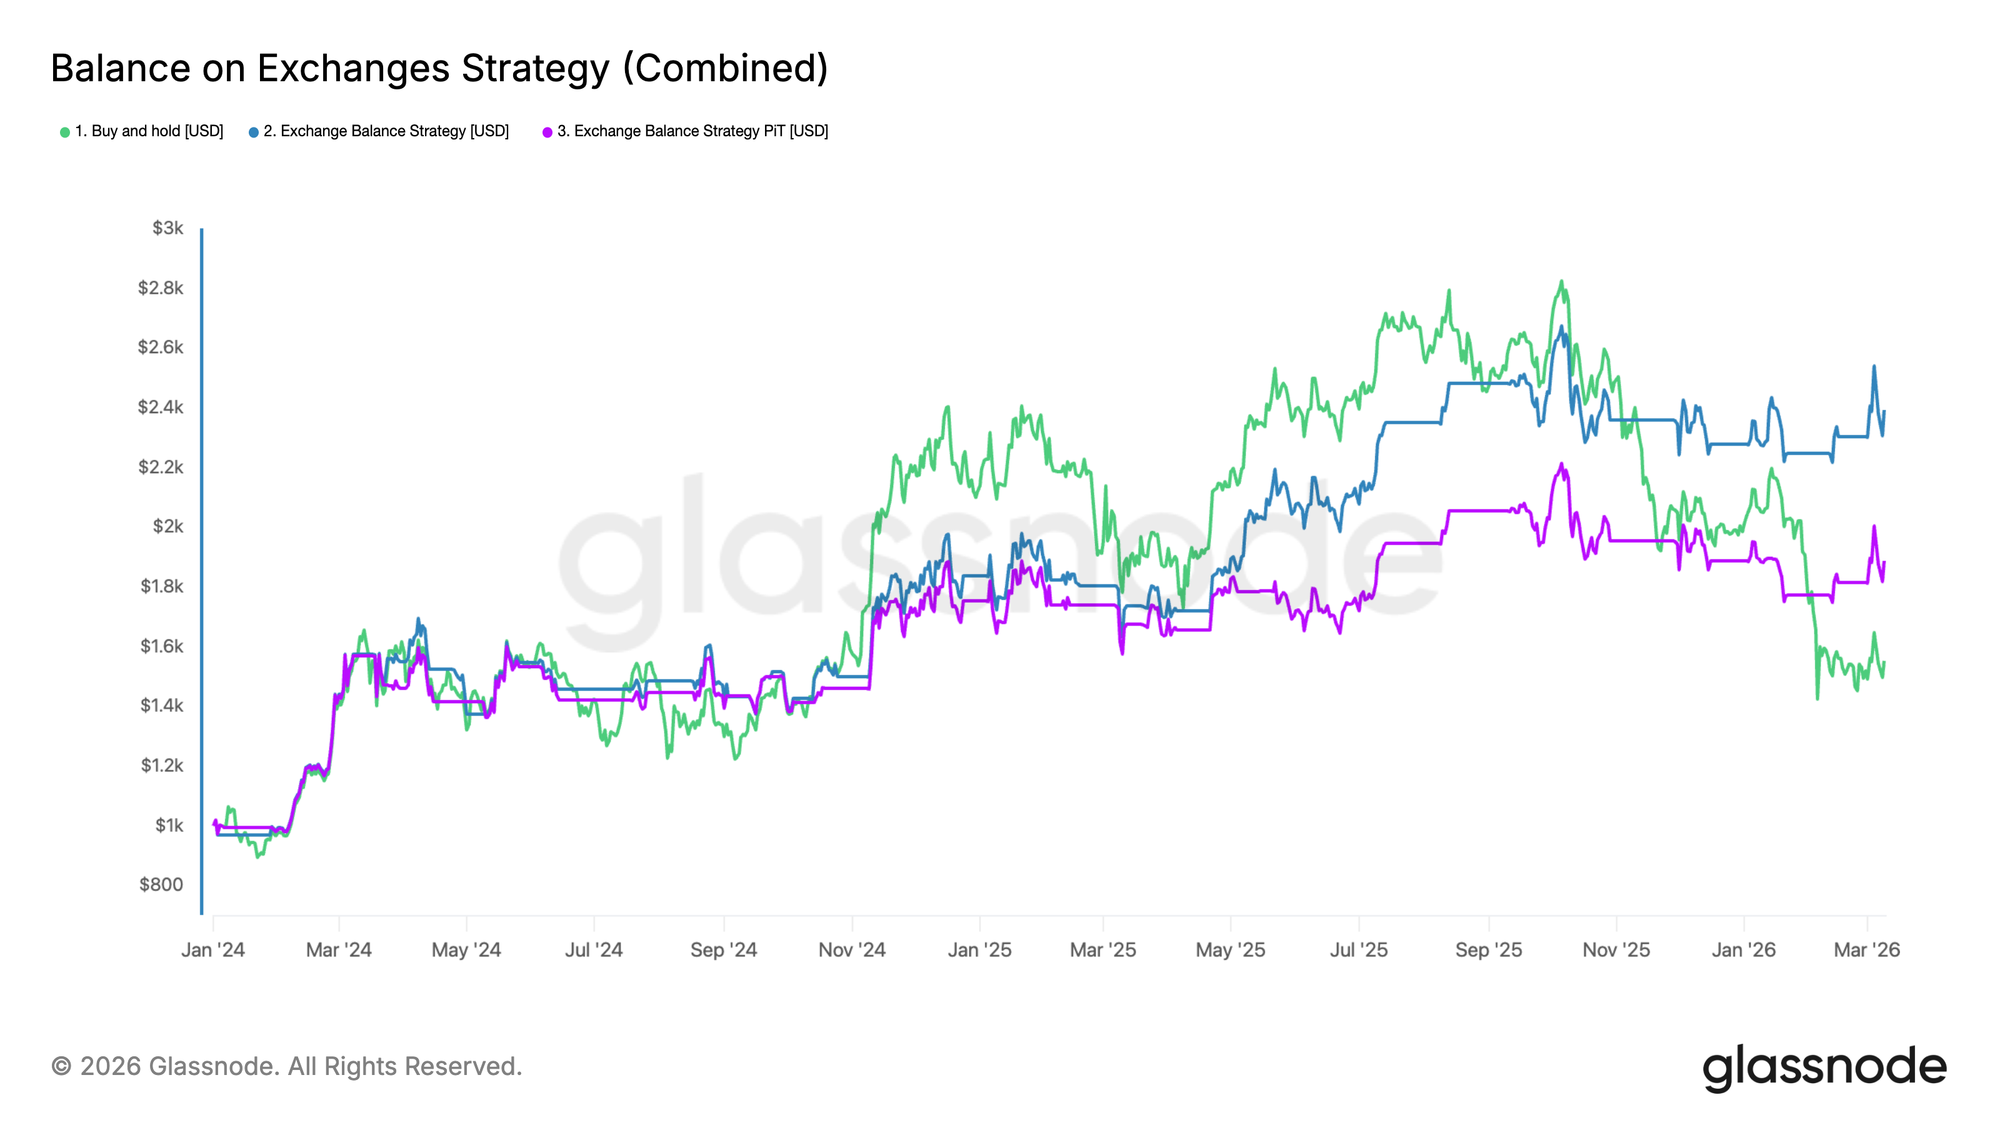
Хотя мы используем ту же метрику, стратегия теперь дает значительно другие результаты, что иллюстрируется фиолетовой линией на новом графике ниже. Общая производительность заметно хуже.
Хотя обе стратегии ведут себя схожим образом большую часть 2024 года, мы наблюдаем, что версия на основе PiT не так эффективно захватывает сильные всплески в ноябре 2024 года и марте 2025 года. В результате совокупная производительность существенно расходится и в конечном итоге оказывается значительно ниже.
Ключевой вывод
В этом примере фиолетовая стратегия, которая имеет доступ только к информации, доступной на тот момент, показывает заметно худшие результаты. ► Бэктесты будут лгать, если их кормить неверными или пересмотренными данными. Только неизменяемые метрики «На момент времени» (Point-in-Time) гарантируют, что вы воспроизводите историю так, как она происходила на самом деле.