Venice Token [VVV] поднялся до $7,06 после ежедневного роста на 14,55%, поддержанный растущим участием и увеличением объема.
Цена приблизилась к критической зоне предложения, что держит внимание на том, смогут ли покупатели продолжить движение.
Торговый объем вырос на 83,5% до $45,42 млн, что свидетельствует о более сильной вовлеченности в рамках ралли. Однако движение приблизилось к региону, который исторически ограничивал рост.
Это оставило VVV на ключевой точке принятия решения, где структура и активность должны были совпасть для продолжения.
Могут ли более высокие минимумы пробить сопротивление?
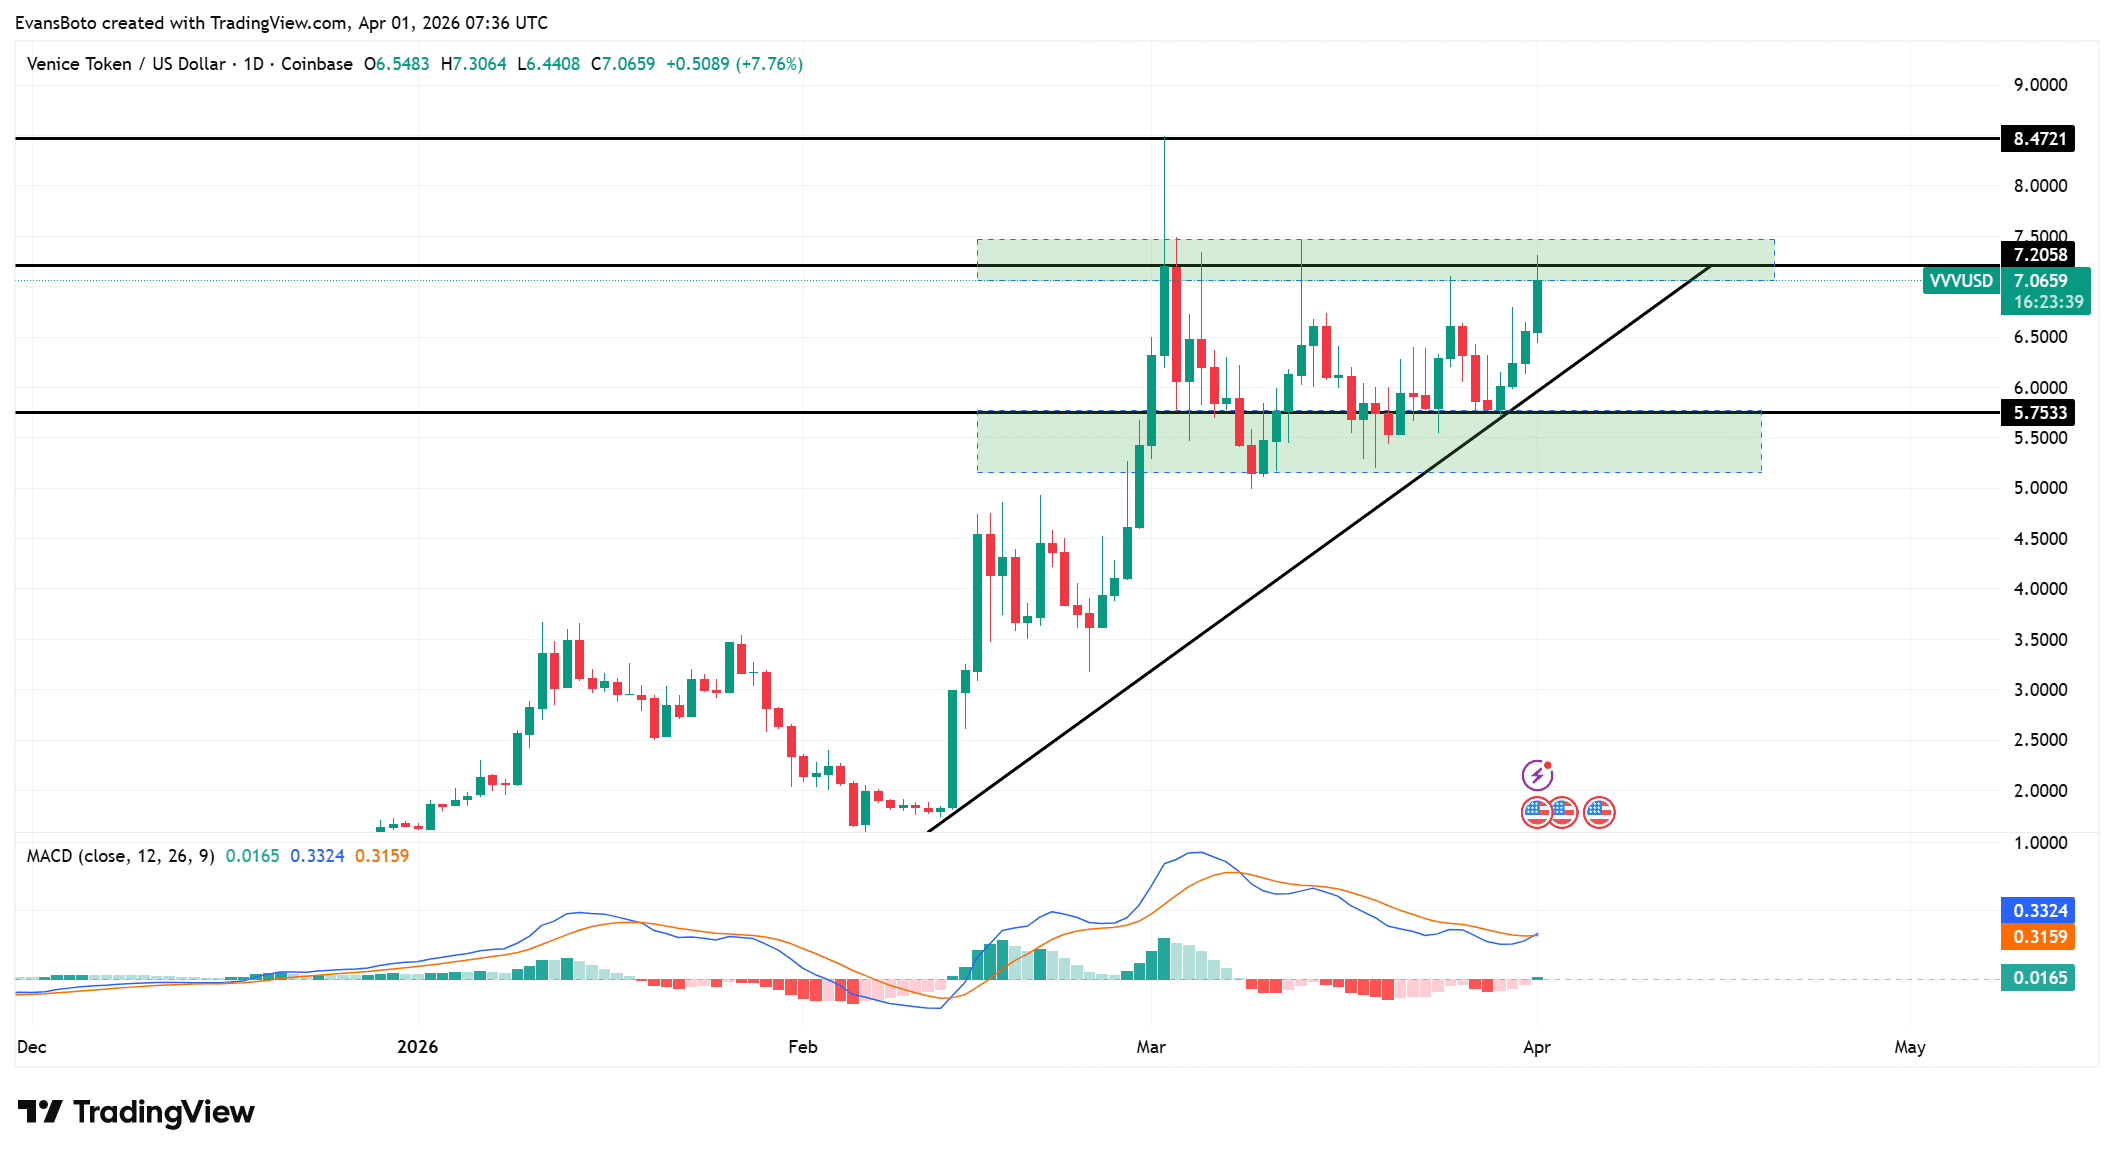
VVV сформировал серию более высоких минимумов вдоль восходящей линии тренда, сохраняя общую структуру нетронутой.
Цена сжалась ниже сопротивления $7,20, удерживаясь выше поддержки $5,75. Эта структура показала, что покупатели входят на более высоких уровнях, усиливая восходящее давление.
Тем не менее, повторные тесты сопротивления сигнализировали, что предложение оставалось активным в этой зоне.
По мере того как цена сжималась near верхней границы, структура указывала на потенциальное расширение. Если пробой удержится, поддержка линии тренда может привести к продолжению движения beyond сопротивление.
В дополнение к этому, MACD пересек сигнальную линию, а гистограмма стала положительной. Этот сдвиг указывал на усиление бычьего импульса behind движением.

Сигнализируют ли притоки VVV о давлении продаж?
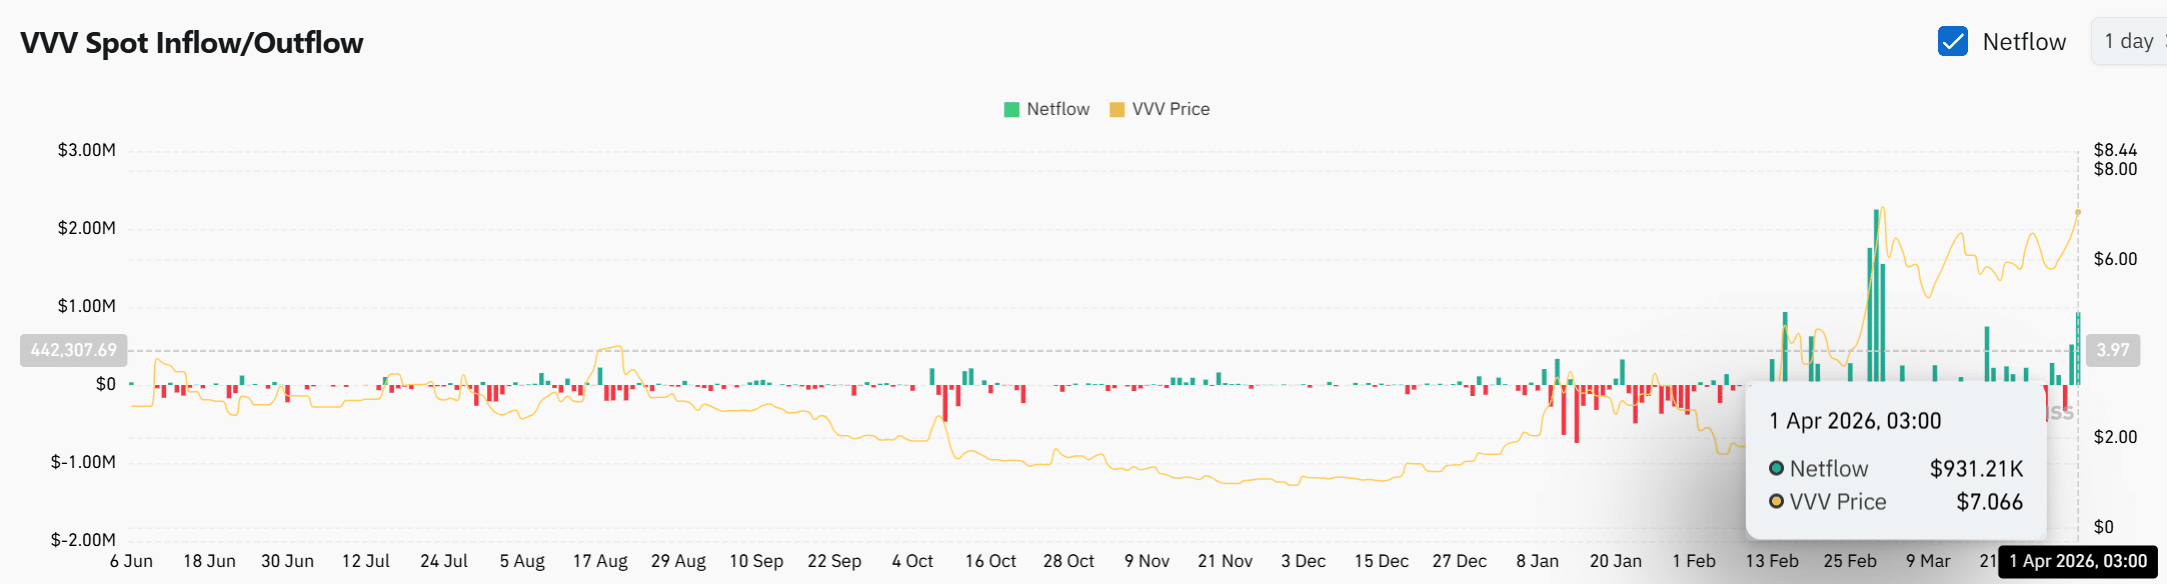
Спотовые чистые потоки стали положительными, зафиксирован приток в $931,21 тыс., что означает смену прежнего доминирования оттока.
Этот переход предполагает, что токены возвращаются на биржи, что создает потенциальную ликвидность для продажи.
Однако время этих притоков совпадает с тестированием ценой сопротивления, что часто отражает корректировку позиционирования, а не немедленную дистрибуцию.
Депозиты на биржах увеличивают доступное предложение, но они не всегда переводятся в мгновенное давление продаж.
Поскольку цена удерживается near верхнего диапазона, эти притоки создают уровень осторожности. Рынок теперь наблюдает, замедлит ли эта добавленная ликвидность ралли или просто будет сопровождать продолжение восходящего движения.

Короткое сжатие меняет позиционирование
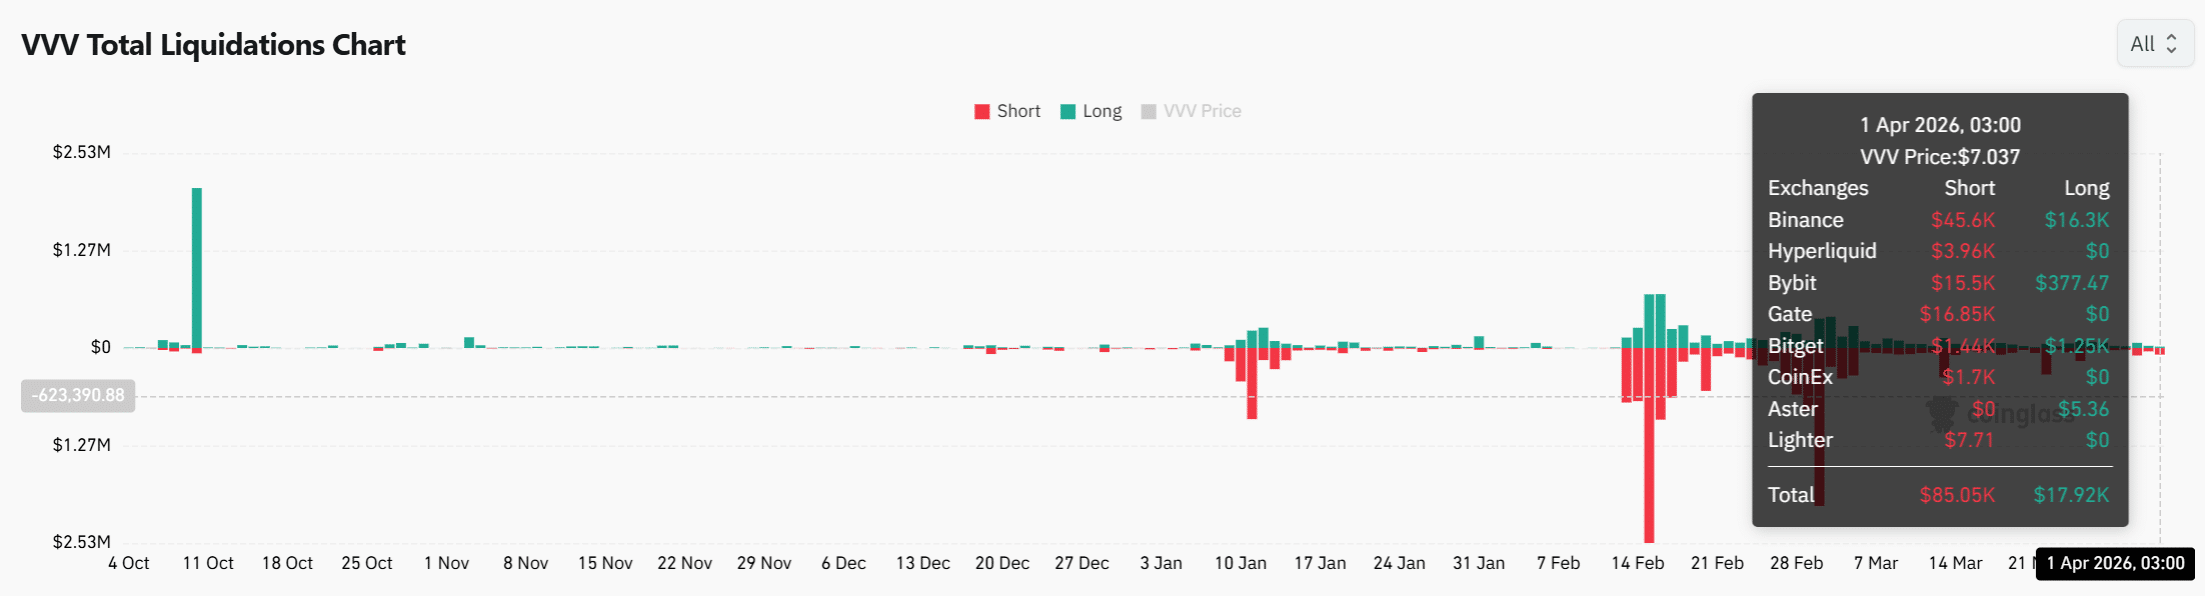
Данные о ликвидациях показали $85,05 тыс. коротких ликвидаций против $17,92 тыс. длинных ликвидаций. Этот дисбаланс указывал на то, что медвежьи позиции столкнулись с более сильным давлением.
Это движение совпало со сбросом плеча, удаляя ставки на понижение с рынка.
Когда короткие позиции закрываются, вынужденные покупки могут поддержать цену и снизить давление продаж.
Однако это также снизило немедленный потенциал сжатия после выхода более слабых коротких позиций. Профиль ликвидаций предположил, что рынок очистил хрупкие медвежьи позиции.
В результате цена столкнулась с меньшим сопротивлением со стороны leveraged давления на понижение.

Может ли VVV поддержать пробой?
VVV протестировал сопротивление, поскольку структура, индикаторы и позиционирование совпали в сторону продолжения.
Более высокие минимумы поддержали тренд, в то время как MACD подтвердил устойчивый импульс. Короткие ликвидации снизили медвежье давление, оставив путь вверх менее оспариваемым.
Тем не менее, растущие биржевые притоки ввели предложение near сопротивления. Если спрос поглотит это предложение, VVV мог бы попытаться пробиться beyond $7,20.
Итоговый обзор
- Venice Token [VVV] вырос до $7,06, поддержанный ежедневным ростом на 14,55% и скачком Торгового Объема на 83,5%.
- Цена приблизилась к зоне сопротивления $7,20, ключевому уровню, который ранее ограничивал рост.


