1 марта 2026 года глобальные макрорынки столкнулись с эпическим событием типа «черный лебедь»: прямые военные удары США и Израиля по Ирану привели к гибели верховного лидера Ирана Хаменеи.
Это экстремальное событие хвостового риска мгновенно изменило модели премии за риск для глобальных классов активов. Полномасштабная эскалация на Ближнем Востоке не только вызвала резкие колебания традиционных активов, таких как нефть и убежища, но и подтолкнула рынок криптовалют, находящийся в ключевой точке博弈 (противостояния), к перекрестку ликвидности и ценообразования.
Анализируя данные спотового рынка Binance и опционов Deribit с количественной точки зрения и перспективы博弈 (торговых стратегий) деривативов, мы глубоко исследуем немедленное влияние этого геополитического кризиса на рынок криптовалют и даем前瞻性 (опережающий) прогноз относительно пути волатильности и будущего направления рынка.
Суть геополитических конфликтов заключается в изменении глобальных цепочек поставок, цен на энергоносители и связанных с ними инфляционных ожиданий. Финансовые рынки отреагировали на эту внезапную атаку США и Израиля на Иран по классическому сценарию избегания риска: нефть и золото стали убежищами первого выбора среди товаров, в то время как активы с высоким риском подверглись немедленной массовой продаже.
Высокоинтенсивный конфликт на Ближнем Востоке в первую очередь затрагивает глобальные цепочки поставок энергоносителей и настроения бегства в убежища в системе фиатного доверия. На традиционных финансовых рынках Brent crude, вероятно, откроется с гэпом вверх на фоне паники из-за разрыва цепочек поставок, а традиционные убежища, такие как золото, увидят активное накопление позиций институциональными инвесторами. Однако в сфере криптоактивов происходит острое внутреннее противоречие между нарративом BTC как «цифрового золота» и его属性 (атрибутом) «высоко волатильного рискового актива».
С точки зрения макроликвидности, паника, вызванная геополитикой (рост индекса VIX), обычно мгновенно провоцирует массовые продажи across the board (по всем активам) для получения долларовой ликвидности. Но после кратковременного выжимания ликвидности, Bitcoin, не контролируемый конкретными государствами и обладающий свойствами цензуроустойчивости и портативности, часто привлекает часть капитала, бегущего из рисковых фиатных валют развивающихся рынков.
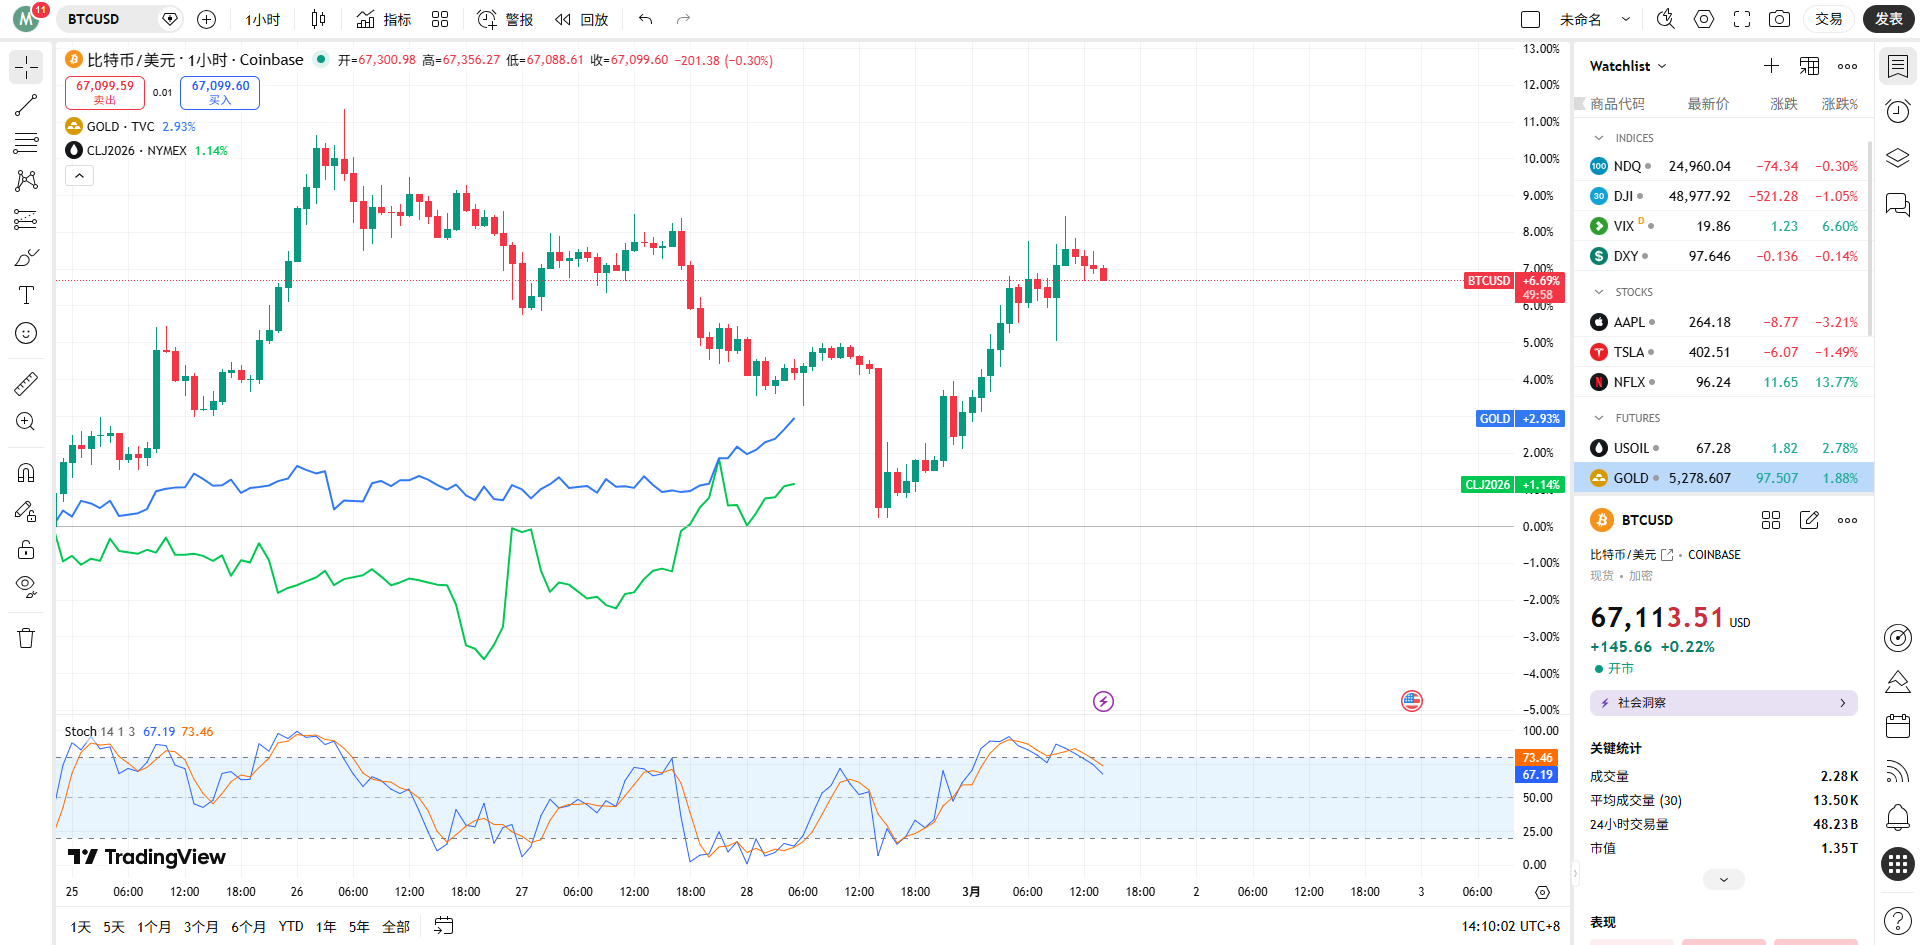
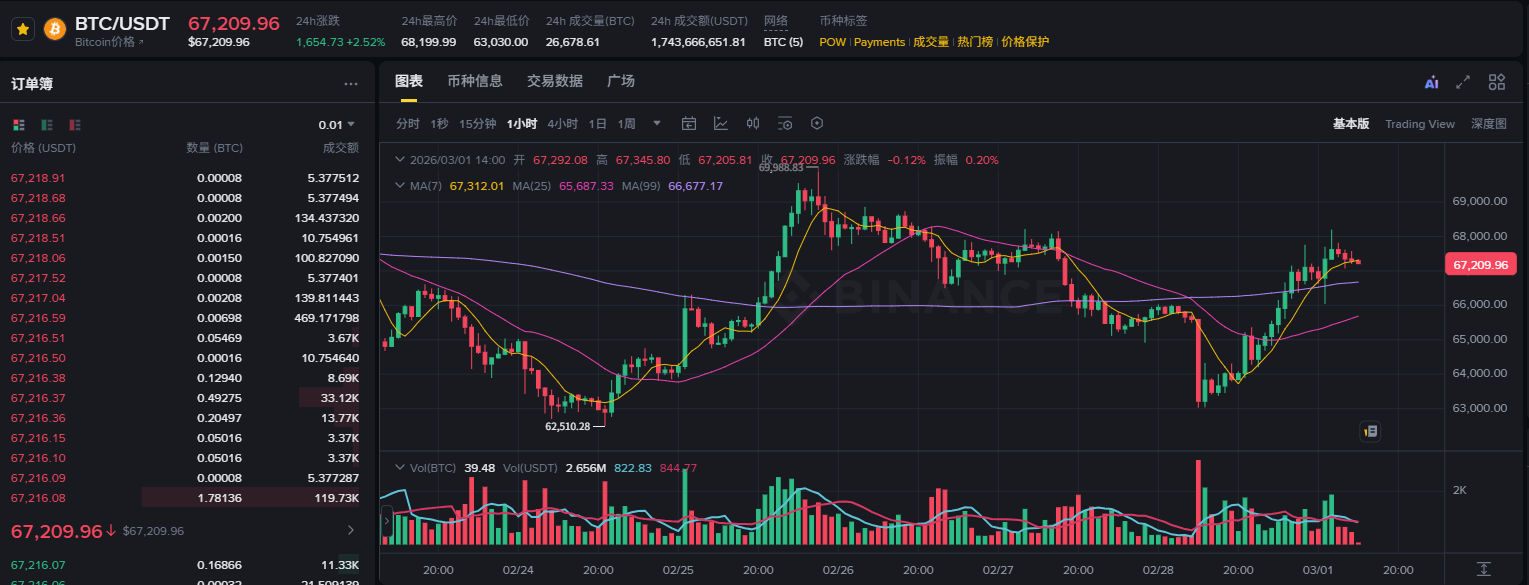
Согласно данным спотового и фьючерсного рынка Binance (по состоянию на 14:00 1 марта 2026 года), цена BTC/USDT колебалась около $67 392. В начале такого масштабного геополитического кризиса BTC не обвалился по сценарию «312» 2020 года, а упорно удерживал ключевую поддержку на уровне $67 000.
Объем торгов за последние 24 часа достиг $1.74 миллиарда, что указывает на значительные разногласия и смену позиций между быками и медведями на этом уровне. На графике цены система скользящих средних показывает格局 высоких колебаний после бычьего выстраивания, что свидетельствует о异常 устойчивой (исключительно устойчивой) силе поглощения на спотовом рынке при шоке от внезапных новостей. Долгосрочные配置底仓 (базовые позиции для размещения) институциональных средств не претерпели фундаментальных изменений.
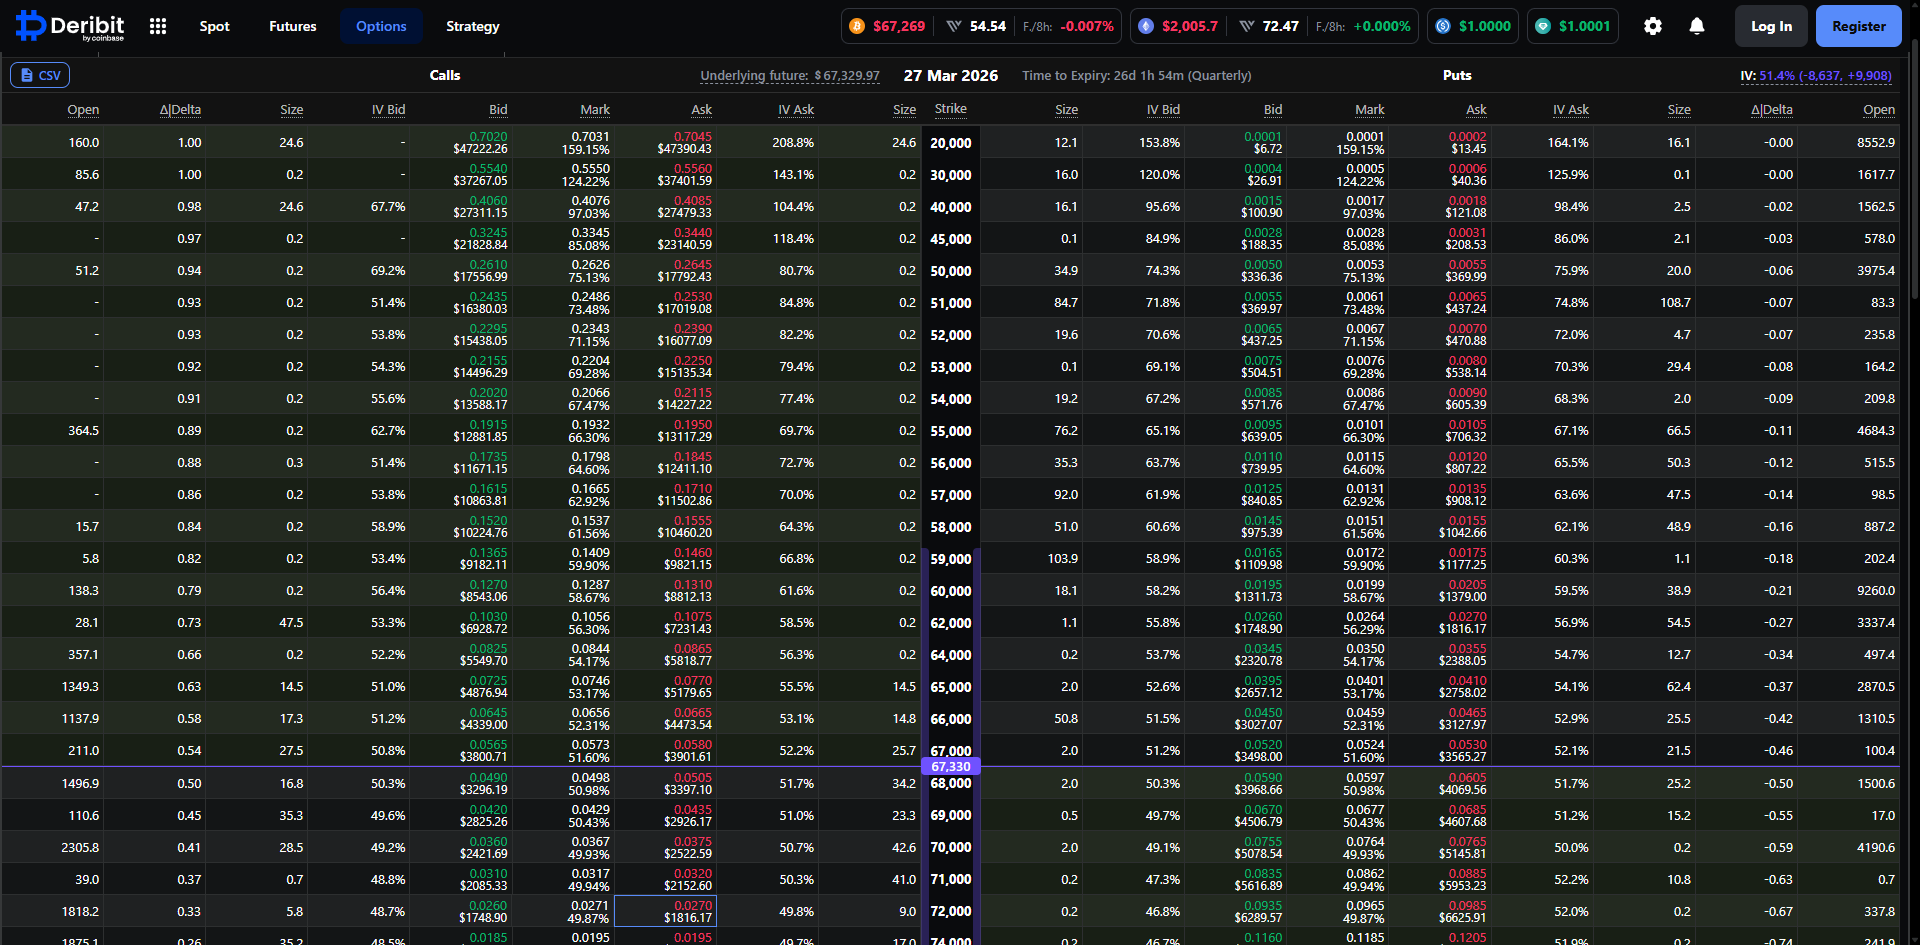
Чтобы понять истинные намерения умных денег, данные по деривативам, особенно по опционам, предоставляют наиболее直观ное количественное сечение. Анализируя данные по опционам BTC с истечением 27 марта 2026 года на платформе Deribit, мы можем четко описать путь, который主力的机构 (основные институты) прогнозируют на ближайший месяц.
Подразумеваемая волатильность (IV) опционов BTC с истечением 27 марта currently достигла相对高位 (относительно высокого уровня) в 51.3%. На фоне геополитического кризиса продавцы опционов быстро подняли volatility surface (поверхность волатильности), чтобы хеджировать риски Gamma-экспозиции от экстремальных движений. IV выше 51% indicates that рынок хеджируется against возможных широких колебаний в ближайшие две-три недели. Для количественных трейдеров соотношение риск/доходность при продаже волатильности сейчас крайне невыгодное, рынок в целом находится в состоянии ажиотажа по «покупке стрэддлов» или построению защиты от хвостовых рисков.
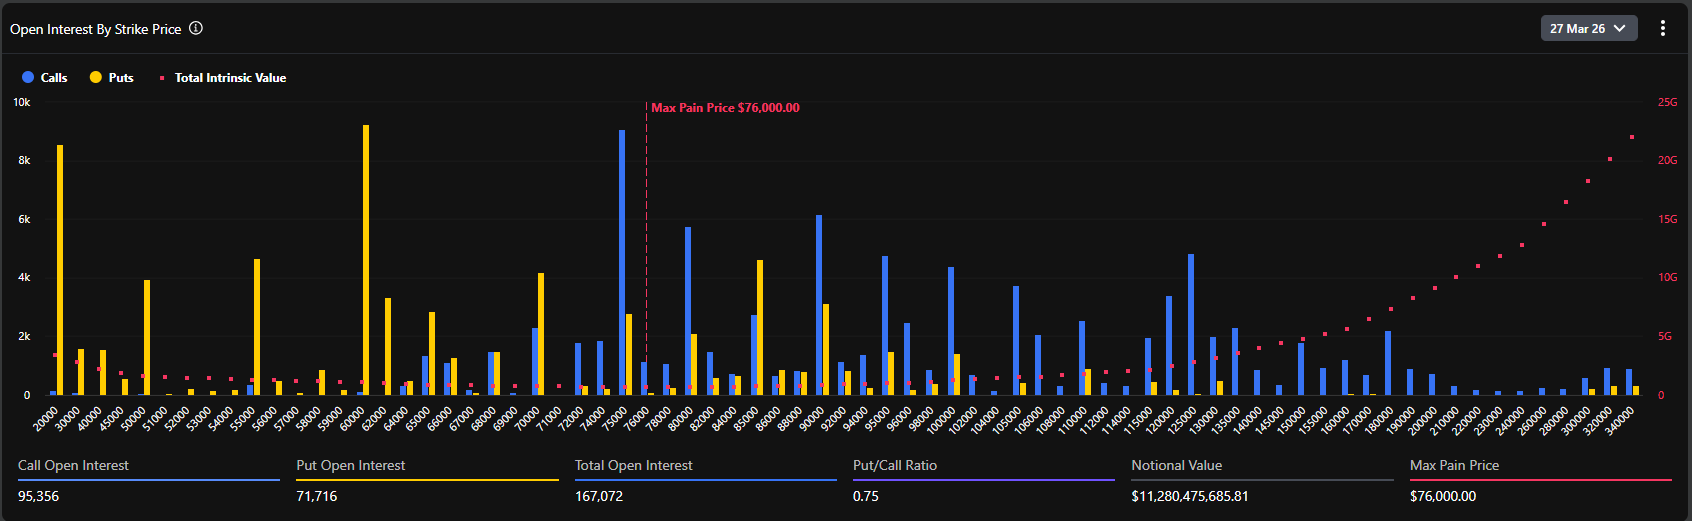
Согласно分布图 (графику распределения) открытых интересов по опционам, текущая максимальная боль (Max Pain) для всего рынка составляет高达 (целых) $76 000. Это чрезвычайно前瞻性 (прогнозные) и спорные данные.
Обычно при приближении экспирации цена базового актива имеет тенденцию двигаться к точке максимальной боли, чтобы минимизировать общую стоимость для покупателей опционов. Однако текущая спотовая цена (около $67 400) имеет скидку (дисконт) почти в 12%+ по сравнению с максимальной болью ($76 000). Это значительное отклонение раскрывает две核心逻辑 (ключевые логики):
Во-первых, до кризиса рынок изначально находился в состоянии крайнего оптимизма и бычьих настроений, большие средства ставили на прорыв к новым историческим максимумам (диапазон $75 000–80 000) к концу марта, что напрямую подняло уровень максимальной боли.
Во-вторых, геополитический кризис стал сильным внешним шоком, подавив восходящий импульс спотовой цены. Но судя по общему объему открытых интересов в 167 072 BTC (номинальная стоимость превышает $11.2 миллиарда), медвежье давление из-за военных новостей не привело к массовому закрытию long-позиций и каскадным продажам.
Данные показывают, что текущее соотношение путов и коллов по открытым интересам (Put/Call Ratio, OI) составляет 0.75. Значение ниже 1 indicates that с точки зрения общего объема коллы (Call) по-прежнему占据绝对主导地位 (занимают абсолютно доминирующее положение). Особенно на страйках $75 000, $80 000 и даже $100 000 скопились огромные объемы коллов (максимальный объем для одного страйка приближается к 10k BTC).
Однако值得注意的是 (стоит отметить), что соотношение объемов торгов путов и коллов за 24 часа (Put/Call Volume Ratio) достигло 1.37. Расхождение между долгосрочным bias в сторону покупок (0.75) и краткосрочным bias в сторону продаж (1.37) идеально отражает текущую рыночную психологию: долгосрочные институты по-прежнему维持原有的多头敞口 (сохраняют原有的 long-экспозицию, не продают спот, не закрывают long-term коллы), но в краткосрочной перспективе после начала войны на Ближнем Востоке большие средства хлынули на покупку вне-денежных путов (OTM Puts) для тактического хеджирования, что привело к резкому росту объема торгов путами.
Анализируя детальные данные опционов Deribit, мы наблюдаем, что в диапазоне от $67 000 до $70 000 распределение значений Delta крайне плотное. Текущая спотовая цена $67 495 находится в зоне «мясорубки»多空争夺 (борьбы между быками и медведями).
Если геополитическая ситуация further ухудшится, что приведет к масштабному оттоку макрокапитала, и спот провалится below $65 000 (уровень сильной поддержки), маркет-мейкеры, чтобы хеджировать свою экспозицию от продажи путов, будут вынуждены продавать на спотовом или фьючерсном рынке, что может спровоцировать локальную负反馈 (негативную обратную связь) ликвидности и тестирование психологической отметки $60 000.
И наоборот, если ситуация на Ближнем Востоке после кратковременного ожесточенного конфликта перейдет в фазу僵持 (патовой ситуации) при посредничестве крупных держав, и панические настроения достигнут пика и пойдут на спад, отскок на крипторынке будет extremely резким. Поскольку выше, в диапазоне $70 000–76 000, скопилось большое количество коллов,一旦 (как только) спотовая цена стабилизируется и突破 (прорвется) above сопротивления $70 000, маркет-мейкеры будут вынуждены покупать спот для хеджирования своей негативной Gamma-экспозиции. Этот классический эффект «Gamma Squeeze (Гамма-сжатия)» с невиданной скоростью поднимет цену BTC к максимальной боли около $76 000.
Отголоски ближневосточных потрясений будут продолжаться. Последующие действия США и Ирана определят конечное направление потоков глобального капитала в убежища. В обозримом краткосрочном периоде спот BTC будет совершать剧烈上下插针 (резкие движения с пиками вверх и вниз) в широком диапазоне $62 000–70 000. Кредитное плечо на фьючерсном рынке будет反复清洗 (неоднократно вымываться) в этом процессе. Количественные стратегии должны быть нацелены на «снижение плеча, получение выгоды от волатильности», подходит построение календарных спредов или маркет-мейкинг по ключевым уровням поддержки/сопротивления, избегая односторонней экспозиции.
С точки зрения структуры открытых интересов опционов,巨量交割 (огромная экспирация) 27 марта является гравитационным центром, которого рынок не может избежать. Если только не разразится глобальный, неконтролируемый кризис ликвидности уровня третьей мировой войны, то по мере边际递减 (предельного снижения) панических настроений, «свойства убежища» и «свойства защиты от инфляции» BTC будут переоценены. Во второй половине марта рынок, вероятно, начнет восстановительный отскок, и у спотовой цены будет强烈动机 (сильный стимул) приблизиться к $75 000–76 000 (максимальная боль и плотный диапазон страйков коллов).
Это событие знаменует вступление геополитики в более опасную фазу. Будь то возрождение инфляционных ожиданий из-за войны (резкий рост нефти), или кризис доверия к фиату, вызванный финансовыми санкциями против specific стран, все это на уровне базовой логики усиливает стратегическую ценность Bitcoin как «неподконтрольного границам негосударственного твердого актива». Для крупных институтов, таких как семейные офисы, макр хедж-фонды, традиционная 60/40 комбинация US bonds + US stocks уже не может справиться с текущими хвостовыми рисками. Доля BTC в инвестиционном портфеле как «актива без корреляции» после этого кризиса迎来系统性跃升) (испытает систематический скачок).
Удар США и Израиля по Ирану стал первым громом, изменившим глобальный финансовый ландшафт в начале 2026 года. Под поверхностью паники данные рынка крипто-опционов冷静地揭示 (хладнокровно раскрывают) карты институциональных денег: «краткосрочное защитное хеджирование, долгосрочный рост».
Для профессиональных финансовых специалистов, отделение эмоционального шума, пристальное внимание к тенденциям изменения подразумеваемой волатильности и转移 (переносу) Gamma-экспозиции маркет-мейкеров — это ключевой код к проникновению сквозь туман войны и захвату права на ценообразование следующего раунда активов. В то время как максимальная боль опционов в $76 000 стоит как маяк, каждая глубокая коррекция, вызванная паникой, накапливает потенциал для будущего прорыва.
Twitter:https://twitter.com/BitpushNewsCN
Чат TG比推 (Bitpush):https://t.me/BitPushCommunity
Подписка TG比推 (Bitpush): https://t.me/bitpush


