The Most Crowded Short in History Is Paving the Way for a Bull Market in U.S. Bonds

marsbitОпубликовано 2026-01-20Обновлено 2026-01-20

Введение

An experienced macro trader presents a contrarian thesis that 2026 will be the "year of the bond," with long-duration U.S. Treasuries (TLT/TMF) poised to outperform stocks. The core argument is built on several pillars: gold's 200% rally historically signals deflationary risk, not sustained inflation; the U.S. faces a crushing $1.2 trillion annual interest bill, creating a fiscal doom loop; Treasury issuance is dangerously short-term, amplifying refinancing risk; and long bond short interest is at extreme, crowded levels. Additional factors include cooling inflation, weak economic indicators, deflationary trade war risks, and the high probability of Fed intervention (QE/Yield Curve Control) to lower long-term yields if stress emerges. The trade offers asymmetric upside: TLT yields ~4.5% while waiting, and a 200bps drop in yields could trigger a 35-45%+ price surge, accelerated by a short squeeze. The author has allocated 60% of their portfolio to this thesis, betting on a policy and macro regime shift.

Author: Common Sense Investor (CSI)

Compiled by: Deep Tide TechFlow

Deep Tide Guide: With the dramatic changes in the macroeconomic environment in 2026, market logic is undergoing a profound shift. Veteran macro trader Common Sense Investor (CSI) presents a contrarian view: 2026 will be the year bonds outperform stocks.

Based on the U.S. government's heavy interest payment pressure, the deflationary signals released by gold, the extremely crowded bond short positions, and the imminent trade conflicts, the author believes that long-duration U.S. Treasuries (such as TLT) are at an inflection point with an "asymmetric game" advantage.

At a time when the market generally considers bonds "uninvestable," this article, through rigorous macro mathematical deduction, reveals why long bonds could become the highest-returning asset in 2026.

The main text is as follows:

Why I Am Overweight TLT and TMF — and Why Stocks Will Underperform in 2026

I do not write these words lightly: 2026 is destined to be the year bonds outperform stocks. This is not because bonds are "safe," but because macro mathematics, positioning, and policy constraints are converging in an unprecedented way—and this situation rarely ends with "Higher for Longer."

I have put my money where my mouth is.

TLT (20+ Year Treasury ETF) and TMF (3x Leveraged Long 20+ Year Treasury ETF) currently make up about 60% of my investment portfolio. This article compiles data from my recent posts, adds new macro context, and outlines a bullish scenario for long-duration bonds, especially TLT.

Core Arguments at a Glance:

  • Gold's Movement: Gold's historical performance does not signal sustained inflation—it signals deflation/deflation risk.

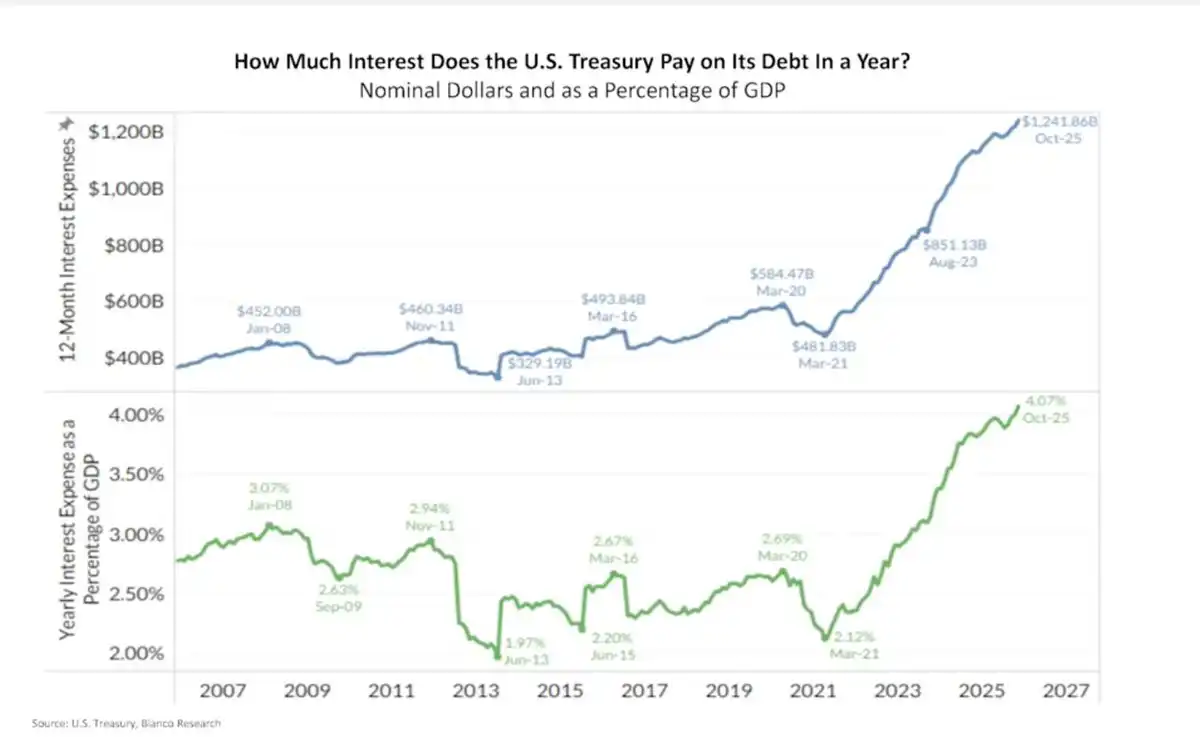
  • Fiscal Deficit: U.S. fiscal math is collapsing: approximately $1.2 trillion in annual interest expenses, and rising.

  • Issuance Structure: Treasury bond issuance is skewed short-term, quietly increasing systemic refinancing risk.

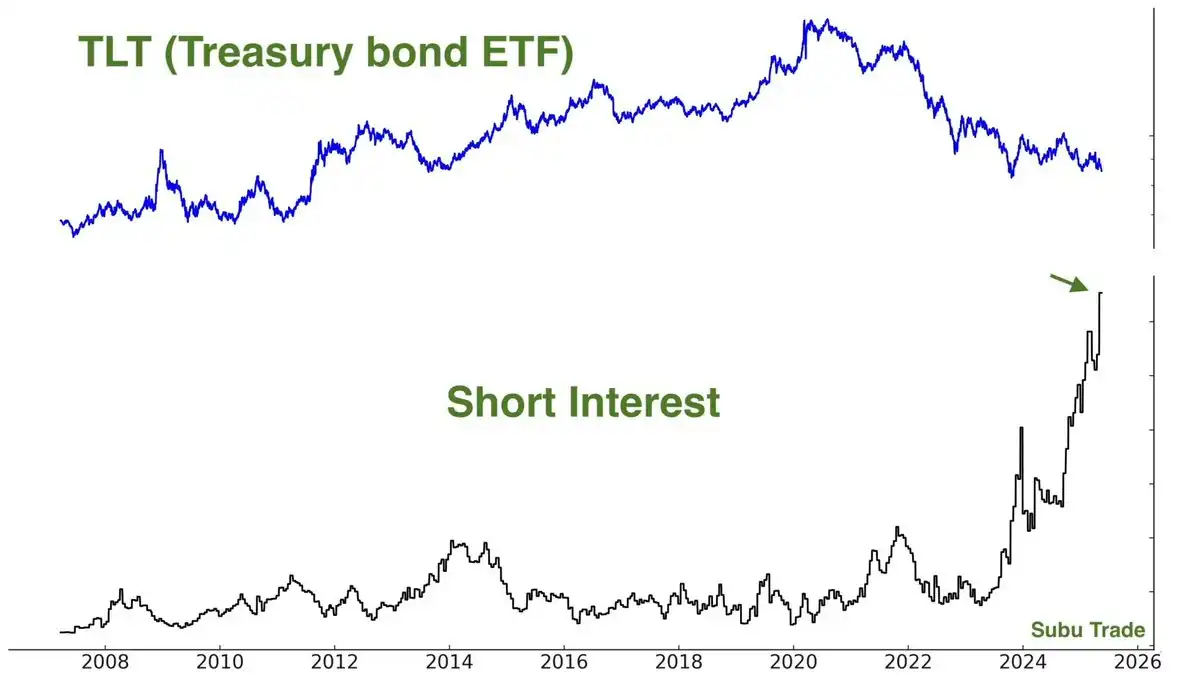
  • Short Squeeze: Long bonds are one of the most crowded short positions in the market.

  • Economic Indicators: Inflation data is cooling, sentiment is weak, labor market pressures are rising.

  • Geopolitics: Geopolitical and trade headlines are turning "risk-off," not "reflationary."

  • Policy Intervention: When something breaks, policy always turns to lowering long-end rates.

This combination has historically been rocket fuel for TLT.

Gold Is Not Always an Inflation Warning Bell

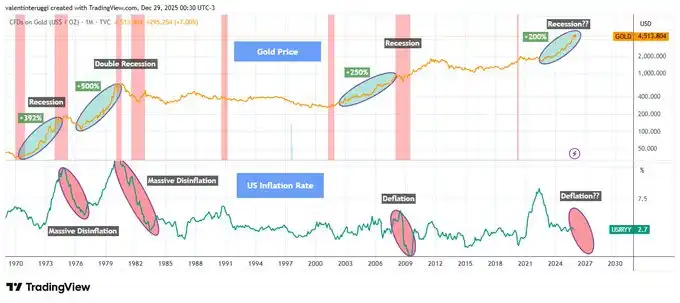
Whenever gold rises more than 200% in a short period, it signals not runaway inflation but economic stress, recession, and falling real rates (see Chart 1 below).

Historical experience shows:

  • The gold surge in the 1970s was followed by recession + disinflation.

  • The early 1980s surge was followed by a double-dip recession, breaking inflation.

  • The early 2000s gold rise foreshadowed the 2001 recession.

  • The 2008 breakout was followed by a deflationary shock.

Since 2020, gold has risen about 200% again. This pattern has never ended in lasting inflation.

When growth flips, gold acts more like a safe-haven asset.
U.S. Interest Expenses Are Exploding Compounded

The U.S. currently has annual interest expenses of about $1.2 trillion, roughly 4% of GDP (see Chart 2 below).

This is no longer a theoretical issue. This is real money flowing out—and interest compounds rapidly when long-term yields stay high.
This is so-called "Fiscal Dominance":

  • High rates mean higher deficits

  • Higher deficits mean more debt issuance

  • More debt issuance leads to higher term premium

  • Higher term premium leads to higher interest expenses!

This doom loop won't resolve itself with "Higher for Longer." It must be resolved through policy intervention!

The Treasury's Short-Term Trap

To ease immediate pain, the Treasury has drastically cut long-bond issuance:

  • 20/30-year bonds now make up only about 1.7% of total issuance (see Chart 3 below).

  • The rest is all pushed into short-term T-bills.

This doesn't solve the problem—it just kicks the can down the road:

  • Short-term debt constantly rolls over.

  • Refinancing will happen at future rates.

  • The market sees the risk and demands a higher term premium.

Ironically, this is why long-end yields stay high... and why they will collapse violently if growth cracks.

The Fed's Trump Card: Yield Curve Control

The Fed controls the short end, not the long end. When long-end yields:

  • Threaten economic growth

  • Trigger exploding fiscal costs

  • Disrupt asset markets

...the Fed has historically only done two things:

  • Buy long bonds (QE)

  • Cap yields (Yield Curve Control)

They won't act preemptively. They only act after stress appears.

Historical references:

  • 2008–2014: 30-year yield fell from ~4.5% to ~2.2% → TLT surged +70%

  • 2020: 30-year yield fell from ~2.4% to ~1.2% → TLT surged +40% in under 12 months

This isn't just theory—this has happened before!

Inflation Is Cooling, Economic Cracks Appearing

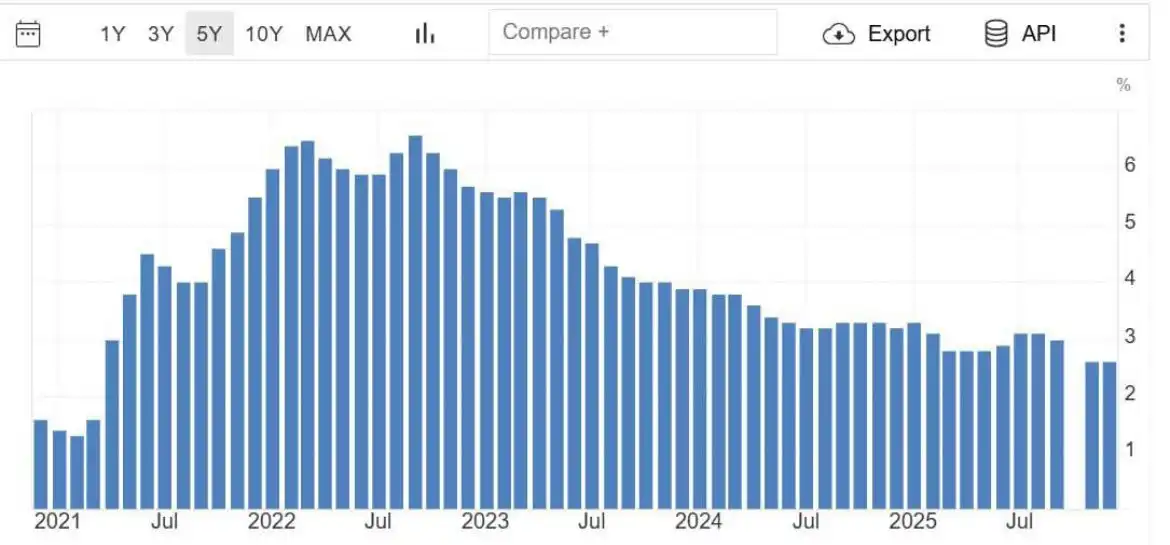
Recent data shows core inflation falling back to 2021 levels (see Chart 4).

  • CPI momentum is fading.

  • Consumer confidence is at a decade low.

  • Credit stress is building.

    Labor market is starting to crack.
Markets are forward-looking. The bond market is already starting to smell this.

Extremely Crowded Short Positions

TLT's short interest is very high:

  • Approximately 144 million shares sold short.

  • Days to cover exceeds 4 days.

Crowded trades don't unwind slowly. They reverse violently—especially when the market narrative shifts.

And importantly:

"Shorts piled in AFTER the move, not before."

This is classic late-cycle behavior!

Smart Money Is Moving In

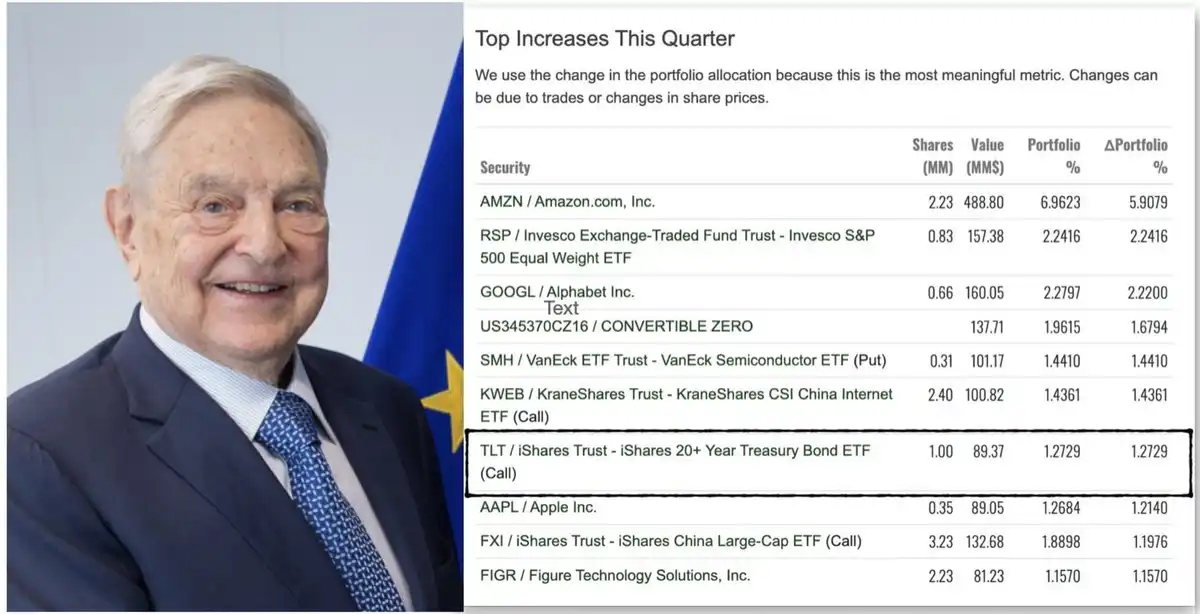
Recently, widely circulated 13F institutional holding reports showed a large fund's top quarterly additions included a significant number of TLT call options.

Regardless of who gets the credit, the message is simple: Sophisticated capital is starting to reposition for duration. Even George Soros's fund held TLT call options in the latest 13F disclosure.
Deflationary Shock from Tariff Frictions

The latest news is reinforcing the "risk-off" logic. President Trump announced new tariff threats targeting the Denmark/Greenland dispute, and European officials are now openly discussing freezing or suspending participation in the EU-US tariff agreement in response.

Trade friction will:

  • Hurt growth

  • Squeeze margins

  • Reduce demand

  • Push capital into bonds over stocks

This is not an inflationary impulse; it is a deflationary shock.

Valuation Mismatch: Stocks vs. Bonds

Today's stock pricing reflects:

  • Strong growth

  • Stable margins

  • Benign financing conditions

While bond pricing reflects:

  • Fiscal stress

  • Sticky inflation fears

  • Permanently high yields

If just one of these narratives is wrong, returns will diverge violently.

Long-duration bonds have "convexity"; stocks do not.

Upside Case Analysis for $TLT

TLT has:

  • An effective duration of ~15.5 years

  • You earn ~4.4–4.7% yield while you wait

Scenario Analysis:

  • If long-end yields fall 100 basis points (bps), TLT price return is +15–18%.

  • Fall 150 bps, TLT return is +25–30%.

  • Fall 200 bps (not extreme historically),意味着 it could surge +35–45% or more!

This doesn't include interest income, convexity bonuses, or the acceleration effect of short covering. This is why I see "asymmetric upside."

Conclusion

Honestly: After the carnage of 2022, I swore I'd never touch long bonds again. Watching duration assets get crushed was a deeply frustrating experience.

But the market doesn't care about your psychological trauma—it only cares about probabilities and prices.

When everyone agrees bonds are "uninvestable," when sentiment bottoms, when shorts pile up, when yields are high and growth risks are rising...

That's when I start buying!

  • TLT + TMF currently make up ~60% of my portfolio. I made 75% returns in the 2025 stock market and redeployed most of it into bond ETFs in November 2025.

  • I am "getting paid to wait" (earning over 4% yield).

  • My position is based on policy and growth shifts, not flimsy narratives.

2026 will finally be the "Year of the Bond."

Связанные с этим вопросы

QAccording to the article, why does the author believe that 2026 will be the year bonds outperform stocks?

AThe author believes 2026 will be the year bonds outperform stocks due to a convergence of macro mathematics, positioning, and policy constraints. Key reasons include the U.S. government's exploding interest expense burden, gold signaling deflationary risks, extremely crowded short positions in long bonds, cooling inflation, weakening economic indicators, and imminent policy intervention to lower long-end yields.

QWhat historical pattern does the author cite regarding gold's performance and what it signals for the economy?

AThe author cites a historical pattern where whenever gold rallies over 200% in a short period, it has not signaled runaway inflation but instead foreshadowed economic stress, recession, and falling real rates. Examples given are the 1970s (followed by recession/disinflation), early 1980s (double-dip recession), early 2000s (2001 recession), and 2008 (deflationary shock).

QWhat is 'Fiscal Dominance' as described in the article, and why is it a problem for the U.S.?

A'Fiscal Dominance' is described as a vicious cycle where high interest rates lead to higher deficits, which require more debt issuance. This increased issuance leads to a higher term premium, which in turn causes even higher interest expenses. This is a problem because the U.S. is already spending ~$1.2 trillion annually on interest, creating a compounding fiscal burden that cannot be solved by 'higher for longer' rates and necessitates policy intervention.

QHow does the extremely crowded short interest in long-term bonds (like TLT) create a potential opportunity?

AThe extremely crowded short interest in TLT (approx. 144 million shares short) creates a potential for a violent short squeeze. Crowded trades like this do not unwind slowly; they reverse sharply, especially when the market narrative shifts. This positioning provides 'rocket fuel' for a rapid price increase in long bonds as shorts are forced to cover their positions.

QWhat specific policy tools does the author suggest the Federal Reserve will use if long-end yields threaten the economy, and what historical examples are given?

AThe author suggests the Federal Reserve will use Quantitative Easing (QE - buying long bonds) and Yield Curve Control (YCC - capping yields) if long-end yields threaten growth, cause fiscal costs to explode, or disrupt asset markets. Historical examples given are from 2008-2014 (30-year yield fell from ~4.5% to ~2.2%, TLT surged +70%) and 2020 (30-year yield fell from ~2.4% to ~1.2%, TLT surged +40% in under 12 months).

Похожее

От золота к биткойну: фиксированное предложение + институциональная лихорадка — повторится ли история «взрывного» роста цен?

Аналитики проводят параллели между биткоином и золотом, отмечая схожие черты: фиксированное предложение, статус негенерирующих доход активов-убежищ и зависимость цены от настроений инвесторов. Эксперт Bloomberg Intelligence Эрик Бальчунас указывает, что история золотых ETF за 22 года может служить дорожной картой для биткоин-ETF. После запуска в 2004 году золотые ETF пережили взлёты, болезненные коррекции и долгое восстановление, но каждый цикл устанавливал новые максимумы. Биткоин-ETF, одобренные в 2024 году, стали одними из самых быстрорастущих в истории, открыв криптоактив для институциональных инвесторов. Однако это привело к повышенной волатильности: крупные оттоки средств из ETF, как у BlackRock IBIT, могут оказывать значительное давление на рынок. Несмотря на падение цены более чем на 50% с октября 2025 года, многие остаются оптимистичны в долгосрочной перспективе, видя в биткоине "цифровое золото". Устойчивый институциональный спрос на ETF и растущее включение биткоина в инвестиционные портфели компаний помогают смягчать продажи. Если биткоин сможет занять даже небольшую часть рыночной капитализации золота (около $28 трлн), это откроет огромный потенциал для роста. Путь, вероятно, будет сопряжён с высокой волатильностью, но фиксированное предложение в сочетании с волнами институционального спроса может вновь привести к взрывному росту цены.

Foresight News11 мин. назад

От золота к биткойну: фиксированное предложение + институциональная лихорадка — повторится ли история «взрывного» роста цен?

Foresight News11 мин. назад

Почему AI-агенты для покупок не так широко распространены?

**Почему AI-агенты для покупок не получили широкого распространения?** Идея о том, что AI-агент с кошельком может полностью заменить человека в совершении покупок, кажется простой, но содержит логические изъяны. Она смешивает два ключевых аспекта шопинга: **информационный поиск** (сбор, фильтрация, сравнение) и **ценностную оценку** (субъективное суждение о качестве, уместности, доверии к продавцу). Машинный поиск данных успешно автоматизируется. Однако ценностная оценка, особенно **определение потребностей** (что важно для меня и почему), остается прерогативой человека. Исследования показывают, что предпочтения нестабильны и формируются в процессе выбора, поэтому взаимодействие с AI должно быть итеративным, а не разовым. Критическое разграничение — является ли сам процесс выбора **рутиной или удовольствием**. * **Стандартные товары** (бумага, батарейки): выбор не имеет ценности, идеальны для полной автоматизации. * **Товары для удовольствия** (вино, книги, одежда): сам выбор — часть наслаждения. Здесь AI должен выступать как помощник, сужая опции для финального решения человека. Схема **«дать AI кошелек»** решает лишь самую простую проблему — проведение платежа, и только в сценарии, где AI обладает полной автономией. Отраслевые решения (Stripe, Mastercard, Google, Visa) уже разделяют **авторизацию** и **хранение средств**, предоставляя AI ограниченные, одноразовые платежные токены, а не полный контроль над кошельком. Истинные сценарии для автономных AI-кошельков лежат не в розничной торговле, а в **B2B-закупках** и **межмашинных расчетах (M2M)**, где процессы стандартизированы, а решения лишены субъективизма. Таким образом, главными препятствиями для повсеместного внедрения AI2C-покупок являются не технологии платежей, а: 1. **Недостаток достоверных данных** (фальшивые отзывы, поддельные товары), без которых любая автоматизация опасна. 2. **Принципиальная невозможность автоматизировать определение человеческих потребностей и ценностей**. Итог: будущее AI в шопинге — не в полном замещении, а в усилении. AI должен взять на себя утомительный поиск и анализ, оставляя человеку ключевые права: **определять критерии выбора** и **получать удовольствие от самого акта выбора**. Платформам следует сосредоточиться на улучшении именно этого опыта.

Foresight News1 ч. назад

Почему AI-агенты для покупок не так широко распространены?

Foresight News1 ч. назад

После девяти месяцев шортинга полный переход в лонг: известный трейдер открывает позицию по биткоину около 64 000 долларов, расхождения между быками и медведями на крипторынке усиливаются

Популярный трейдер Doctor Profit закрыл все короткие позиции по биткойну после девяти месяцев успешного шортинга и начал покупать на уровне около $64 000, заявив, что фундаментальные изменения — такие как возможное принятие закона CLARITY и институциональный спрос — могут привести к досрочному достижению дна рыночного цикла. Тем временем, аналитик on-chain gumsays отмечает, что бычье расхождение на недельном графике биткойна длится уже 147 дней, что близко к 161 дню перед минимумом 2022 года. Однако исследователь циклов Джейк Пахор указывает, что три ключевых условия для рыночного дна, наблюдавшихся с 2014 года, пока не выполнены: с момента пика октября 2025 года прошло лишь 9 месяцев (вместо типичных 12), индекс страха CSH ни разу не опускался ниже 20, а цена не пробивала реализованную цену (~$53 000). Рынок разделён: одни считают, что институциональный спрос через ETF и регулирование изменили правила игры, другие ждут классических сигналов капитуляции. Стратегия Пахора отражает этот раскол — он продолжает периодические покупки, но сохраняет крупный капитал для более низких цен, если историческая модель повторится.

marsbit1 ч. назад

После девяти месяцев шортинга полный переход в лонг: известный трейдер открывает позицию по биткоину около 64 000 долларов, расхождения между быками и медведями на крипторынке усиливаются

marsbit1 ч. назад

Опытный трейдер рассказывает: Как торговать на ошибочных ожиданиях рынка?

Опытный трейдер делится историей успешной сделки, построенной на торговле против ошибочных рыночных ожиданий. В основе его метода — анализ не самих данных (например, слабого CPI), а того, как рынок *ожидает*, что эти данные повлияют на цены, и проверка, остаётся ли этот механизм влияния (функция реакции) в силе. На примере сделки с Nasdaq (NQ) он показывает: после слабых данных CPI рынок ожидал общего снижения ставок и роста акций, особенно технологических. Однако долгосрочные реальные ставки (10-30 лет) достигли многолетних максимумов, отказавшись подтверждать этот сценарий. Это означало, что «дешёвых» долгосрочных денег для роста дорогих tech-акций не будет. Рост NQ на фоне слабого CPI стал ошибочным定价ованием. Трейдер выявил несоответствие: рынок предполагал цепочку «слабый CPI → смягчение политики → падение долгосрочных ставок → рост оценки NQ», но ключевое звено (падение долгосрочных ставок) не сработало. Это создало возможность для short-позиций по NQ, наиболее уязвимому к дорогим долгосрочным деньгам индексу. В статье изложена структура для поиска подобных возможностей: 1. Определить текущую рыночную причинно-следственную цепочку. 2. Найти в ней ключевую переменную с «правом вето». 3. Проверить, отказывается ли эта переменная подтверждать цепочку. 4. Дождаться, пока цена по инерции продолжит двигаться по старому сценарию. 5. Выбрать наиболее чистый актив для выражения этой ошибки. 6. Заранее определить условия для выхода (опровержение гипотезы или реализация логики). Главный вывод: альфа часто возникает не из-за информпреимущества, а из-за разницы в функциях реакции. Когда макрорежим меняется, рынок может по привычке реагировать на данные по-старому, создавая ошибку в цене. Ключевой вопрос: «На какую причинно-следственную цепочку опирается первая рыночная реакция, и остаётся ли она справедливой сегодня?».

marsbit2 ч. назад

Опытный трейдер рассказывает: Как торговать на ошибочных ожиданиях рынка?

marsbit2 ч. назад

Торговля

Спот
活动图片