The Most Crowded Short in History Is Paving the Way for a Bull Market in U.S. Bonds

marsbitОпубликовано 2026-01-20Обновлено 2026-01-20

Введение

An experienced macro trader presents a contrarian thesis that 2026 will be the "year of the bond," with long-duration U.S. Treasuries (TLT/TMF) poised to outperform stocks. The core argument is built on several pillars: gold's 200% rally historically signals deflationary risk, not sustained inflation; the U.S. faces a crushing $1.2 trillion annual interest bill, creating a fiscal doom loop; Treasury issuance is dangerously short-term, amplifying refinancing risk; and long bond short interest is at extreme, crowded levels. Additional factors include cooling inflation, weak economic indicators, deflationary trade war risks, and the high probability of Fed intervention (QE/Yield Curve Control) to lower long-term yields if stress emerges. The trade offers asymmetric upside: TLT yields ~4.5% while waiting, and a 200bps drop in yields could trigger a 35-45%+ price surge, accelerated by a short squeeze. The author has allocated 60% of their portfolio to this thesis, betting on a policy and macro regime shift.

Author: Common Sense Investor (CSI)

Compiled by: Deep Tide TechFlow

Deep Tide Guide: With the dramatic changes in the macroeconomic environment in 2026, market logic is undergoing a profound shift. Veteran macro trader Common Sense Investor (CSI) presents a contrarian view: 2026 will be the year bonds outperform stocks.

Based on the U.S. government's heavy interest payment pressure, the deflationary signals released by gold, the extremely crowded bond short positions, and the imminent trade conflicts, the author believes that long-duration U.S. Treasuries (such as TLT) are at an inflection point with an "asymmetric game" advantage.

At a time when the market generally considers bonds "uninvestable," this article, through rigorous macro mathematical deduction, reveals why long bonds could become the highest-returning asset in 2026.

The main text is as follows:

Why I Am Overweight TLT and TMF — and Why Stocks Will Underperform in 2026

I do not write these words lightly: 2026 is destined to be the year bonds outperform stocks. This is not because bonds are "safe," but because macro mathematics, positioning, and policy constraints are converging in an unprecedented way—and this situation rarely ends with "Higher for Longer."

I have put my money where my mouth is.

TLT (20+ Year Treasury ETF) and TMF (3x Leveraged Long 20+ Year Treasury ETF) currently make up about 60% of my investment portfolio. This article compiles data from my recent posts, adds new macro context, and outlines a bullish scenario for long-duration bonds, especially TLT.

Core Arguments at a Glance:

  • Gold's Movement: Gold's historical performance does not signal sustained inflation—it signals deflation/deflation risk.

  • Fiscal Deficit: U.S. fiscal math is collapsing: approximately $1.2 trillion in annual interest expenses, and rising.

  • Issuance Structure: Treasury bond issuance is skewed short-term, quietly increasing systemic refinancing risk.

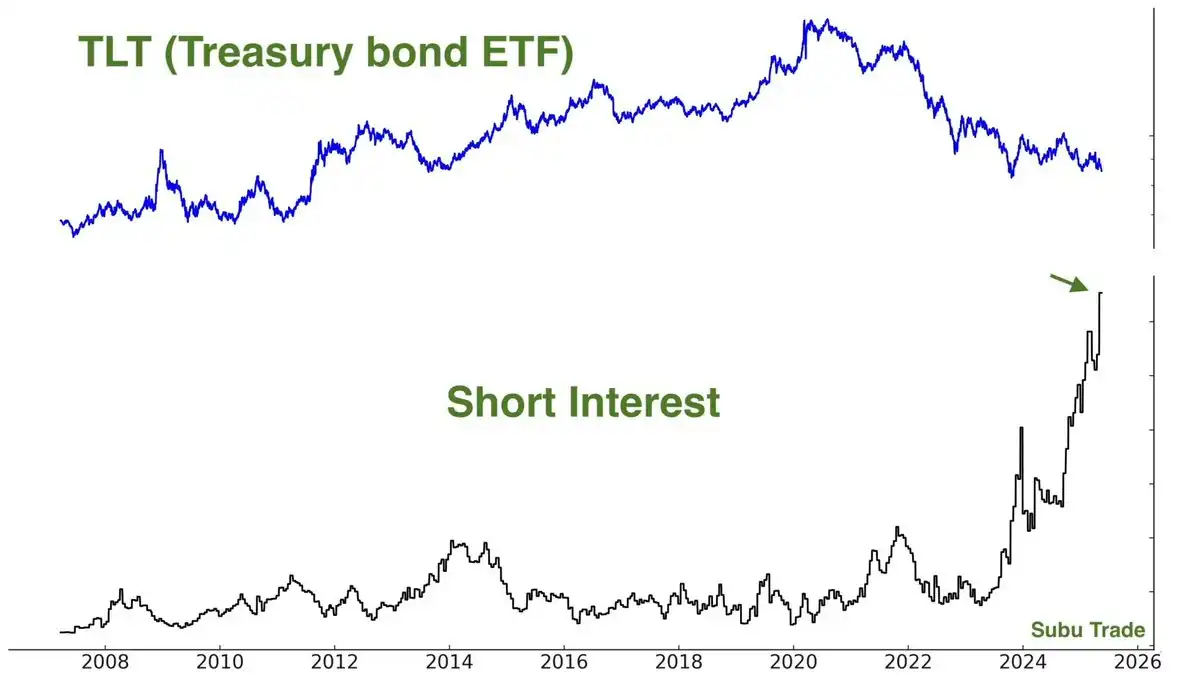
  • Short Squeeze: Long bonds are one of the most crowded short positions in the market.

  • Economic Indicators: Inflation data is cooling, sentiment is weak, labor market pressures are rising.

  • Geopolitics: Geopolitical and trade headlines are turning "risk-off," not "reflationary."

  • Policy Intervention: When something breaks, policy always turns to lowering long-end rates.

This combination has historically been rocket fuel for TLT.

Gold Is Not Always an Inflation Warning Bell

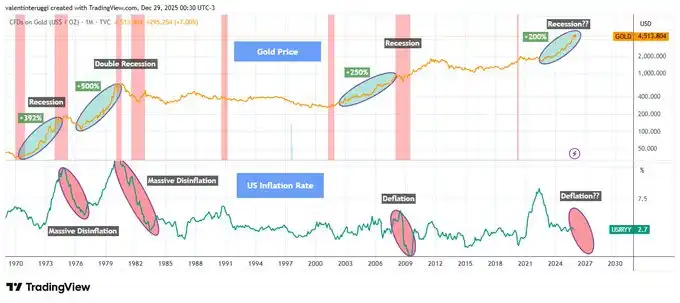
Whenever gold rises more than 200% in a short period, it signals not runaway inflation but economic stress, recession, and falling real rates (see Chart 1 below).

Historical experience shows:

  • The gold surge in the 1970s was followed by recession + disinflation.

  • The early 1980s surge was followed by a double-dip recession, breaking inflation.

  • The early 2000s gold rise foreshadowed the 2001 recession.

  • The 2008 breakout was followed by a deflationary shock.

Since 2020, gold has risen about 200% again. This pattern has never ended in lasting inflation.

When growth flips, gold acts more like a safe-haven asset.
U.S. Interest Expenses Are Exploding Compounded

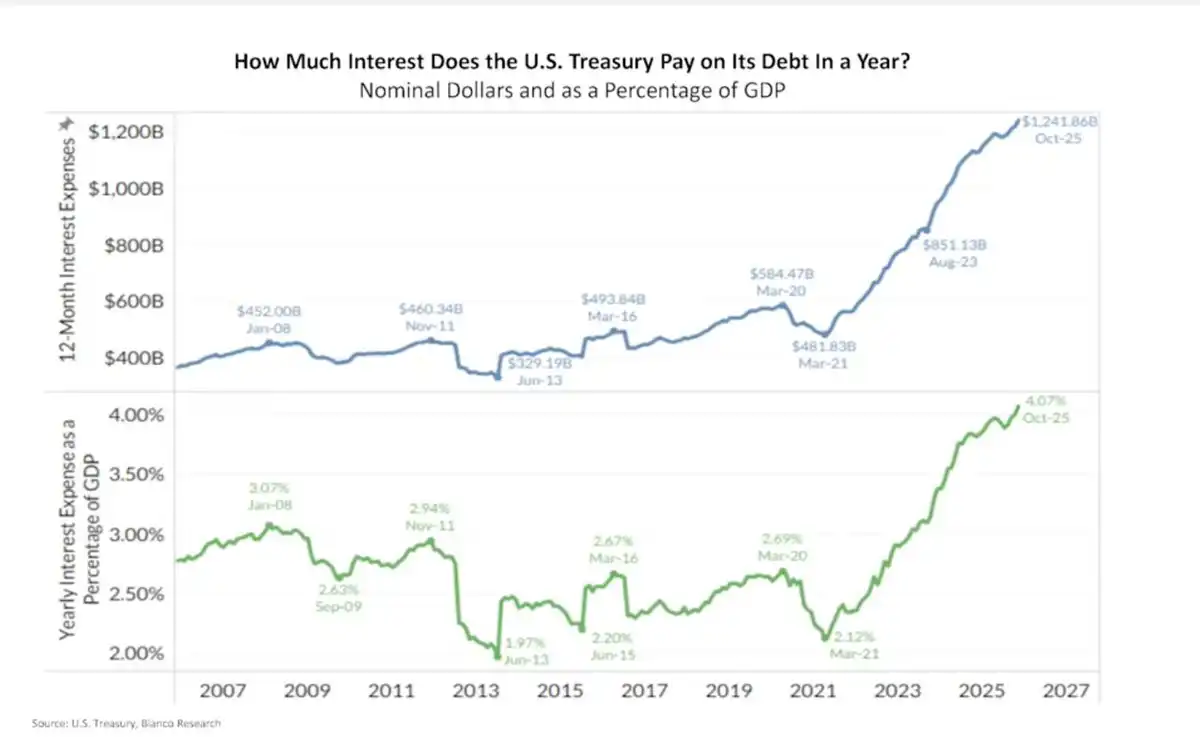
The U.S. currently has annual interest expenses of about $1.2 trillion, roughly 4% of GDP (see Chart 2 below).

This is no longer a theoretical issue. This is real money flowing out—and interest compounds rapidly when long-term yields stay high.
This is so-called "Fiscal Dominance":

  • High rates mean higher deficits

  • Higher deficits mean more debt issuance

  • More debt issuance leads to higher term premium

  • Higher term premium leads to higher interest expenses!

This doom loop won't resolve itself with "Higher for Longer." It must be resolved through policy intervention!

The Treasury's Short-Term Trap

To ease immediate pain, the Treasury has drastically cut long-bond issuance:

  • 20/30-year bonds now make up only about 1.7% of total issuance (see Chart 3 below).

  • The rest is all pushed into short-term T-bills.

This doesn't solve the problem—it just kicks the can down the road:

  • Short-term debt constantly rolls over.

  • Refinancing will happen at future rates.

  • The market sees the risk and demands a higher term premium.

Ironically, this is why long-end yields stay high... and why they will collapse violently if growth cracks.

The Fed's Trump Card: Yield Curve Control

The Fed controls the short end, not the long end. When long-end yields:

  • Threaten economic growth

  • Trigger exploding fiscal costs

  • Disrupt asset markets

...the Fed has historically only done two things:

  • Buy long bonds (QE)

  • Cap yields (Yield Curve Control)

They won't act preemptively. They only act after stress appears.

Historical references:

  • 2008–2014: 30-year yield fell from ~4.5% to ~2.2% → TLT surged +70%

  • 2020: 30-year yield fell from ~2.4% to ~1.2% → TLT surged +40% in under 12 months

This isn't just theory—this has happened before!

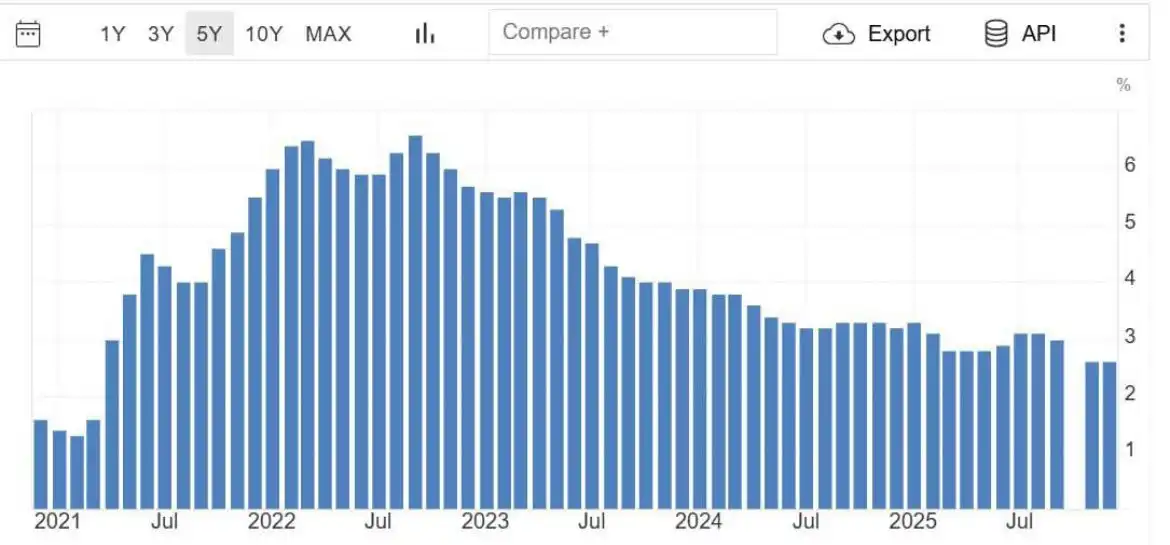
Inflation Is Cooling, Economic Cracks Appearing

Recent data shows core inflation falling back to 2021 levels (see Chart 4).

  • CPI momentum is fading.

  • Consumer confidence is at a decade low.

  • Credit stress is building.

    Labor market is starting to crack.
Markets are forward-looking. The bond market is already starting to smell this.

Extremely Crowded Short Positions

TLT's short interest is very high:

  • Approximately 144 million shares sold short.

  • Days to cover exceeds 4 days.

Crowded trades don't unwind slowly. They reverse violently—especially when the market narrative shifts.

And importantly:

"Shorts piled in AFTER the move, not before."

This is classic late-cycle behavior!

Smart Money Is Moving In

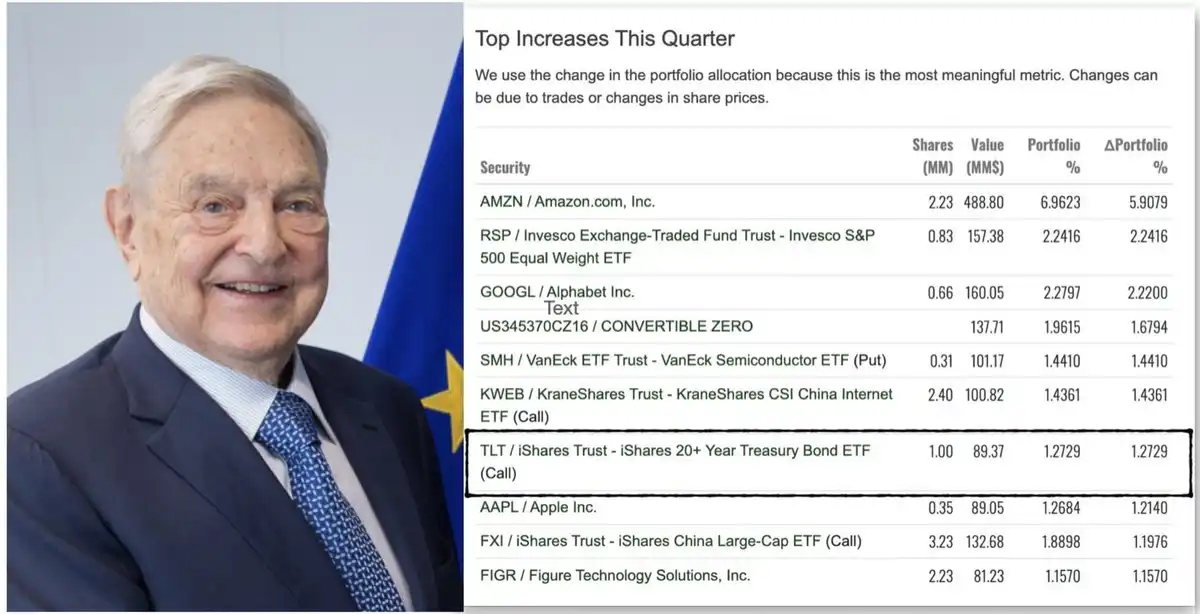
Recently, widely circulated 13F institutional holding reports showed a large fund's top quarterly additions included a significant number of TLT call options.

Regardless of who gets the credit, the message is simple: Sophisticated capital is starting to reposition for duration. Even George Soros's fund held TLT call options in the latest 13F disclosure.
Deflationary Shock from Tariff Frictions

The latest news is reinforcing the "risk-off" logic. President Trump announced new tariff threats targeting the Denmark/Greenland dispute, and European officials are now openly discussing freezing or suspending participation in the EU-US tariff agreement in response.

Trade friction will:

  • Hurt growth

  • Squeeze margins

  • Reduce demand

  • Push capital into bonds over stocks

This is not an inflationary impulse; it is a deflationary shock.

Valuation Mismatch: Stocks vs. Bonds

Today's stock pricing reflects:

  • Strong growth

  • Stable margins

  • Benign financing conditions

While bond pricing reflects:

  • Fiscal stress

  • Sticky inflation fears

  • Permanently high yields

If just one of these narratives is wrong, returns will diverge violently.

Long-duration bonds have "convexity"; stocks do not.

Upside Case Analysis for $TLT

TLT has:

  • An effective duration of ~15.5 years

  • You earn ~4.4–4.7% yield while you wait

Scenario Analysis:

  • If long-end yields fall 100 basis points (bps), TLT price return is +15–18%.

  • Fall 150 bps, TLT return is +25–30%.

  • Fall 200 bps (not extreme historically),意味着 it could surge +35–45% or more!

This doesn't include interest income, convexity bonuses, or the acceleration effect of short covering. This is why I see "asymmetric upside."

Conclusion

Honestly: After the carnage of 2022, I swore I'd never touch long bonds again. Watching duration assets get crushed was a deeply frustrating experience.

But the market doesn't care about your psychological trauma—it only cares about probabilities and prices.

When everyone agrees bonds are "uninvestable," when sentiment bottoms, when shorts pile up, when yields are high and growth risks are rising...

That's when I start buying!

  • TLT + TMF currently make up ~60% of my portfolio. I made 75% returns in the 2025 stock market and redeployed most of it into bond ETFs in November 2025.

  • I am "getting paid to wait" (earning over 4% yield).

  • My position is based on policy and growth shifts, not flimsy narratives.

2026 will finally be the "Year of the Bond."

Связанные с этим вопросы

QAccording to the article, why does the author believe that 2026 will be the year bonds outperform stocks?

AThe author believes 2026 will be the year bonds outperform stocks due to a convergence of macro mathematics, positioning, and policy constraints. Key reasons include the U.S. government's exploding interest expense burden, gold signaling deflationary risks, extremely crowded short positions in long bonds, cooling inflation, weakening economic indicators, and imminent policy intervention to lower long-end yields.

QWhat historical pattern does the author cite regarding gold's performance and what it signals for the economy?

AThe author cites a historical pattern where whenever gold rallies over 200% in a short period, it has not signaled runaway inflation but instead foreshadowed economic stress, recession, and falling real rates. Examples given are the 1970s (followed by recession/disinflation), early 1980s (double-dip recession), early 2000s (2001 recession), and 2008 (deflationary shock).

QWhat is 'Fiscal Dominance' as described in the article, and why is it a problem for the U.S.?

A'Fiscal Dominance' is described as a vicious cycle where high interest rates lead to higher deficits, which require more debt issuance. This increased issuance leads to a higher term premium, which in turn causes even higher interest expenses. This is a problem because the U.S. is already spending ~$1.2 trillion annually on interest, creating a compounding fiscal burden that cannot be solved by 'higher for longer' rates and necessitates policy intervention.

QHow does the extremely crowded short interest in long-term bonds (like TLT) create a potential opportunity?

AThe extremely crowded short interest in TLT (approx. 144 million shares short) creates a potential for a violent short squeeze. Crowded trades like this do not unwind slowly; they reverse sharply, especially when the market narrative shifts. This positioning provides 'rocket fuel' for a rapid price increase in long bonds as shorts are forced to cover their positions.

QWhat specific policy tools does the author suggest the Federal Reserve will use if long-end yields threaten the economy, and what historical examples are given?

AThe author suggests the Federal Reserve will use Quantitative Easing (QE - buying long bonds) and Yield Curve Control (YCC - capping yields) if long-end yields threaten growth, cause fiscal costs to explode, or disrupt asset markets. Historical examples given are from 2008-2014 (30-year yield fell from ~4.5% to ~2.2%, TLT surged +70%) and 2020 (30-year yield fell from ~2.4% to ~1.2%, TLT surged +40% in under 12 months).

Похожее

После трёх кварталов падения: получится ли у крипторынка стабилизироваться в третьем квартале?

Криптовалютный рынок пережил худший квартал с 2022 года, общая капитализация упала на 12,6% до $2,1 трлн, а дневные объемы торгов снизились на 20,9%. Впервые за три года сократилась и капитализация стейблкоинов. Основные факторы спада — отток средств из биткоин-ETF, распродажа биткоинов корпоративным казначейством Strategy и ужесточение монетарной политики ФРС. Второй квартал завершился чистым оттоком $46,7 млрд из ETF, при этом в июне отток достиг рекордных $45 млрд. Ключевым событием третьего квартала станет заседание ФРС 28–29 июля. Мягкий сигнал может поддержать биткоин в диапазоне $68 000–84 000 и вернуть приток в ETF, тогда как жесткая риторика способна сместить торговый диапазон к $50 000–56 000. Законодательная неопределенность также давит на рынок: прогресс по закону CLARITY Act, определяющему регуляторные границы, замедлился, и вероятность его принятия в 2026 году упала до 40–45%. Несмотря на общий спад, два сегмента показали рост: объемы на рынках предсказаний выросли на 48,7%, а торговля токенизированными коллекционными предметами увеличилась на 143%. Сектор RWA продолжает стабильно развиваться, достигнув $28,1 млрд. Рынок, вероятно, миновал фазу острой распродажи, но для устойчивого восстановления необходимы ясность от ФРС и регуляторный прогресс.

marsbit12 ч. назад

После трёх кварталов падения: получится ли у крипторынка стабилизироваться в третьем квартале?

marsbit12 ч. назад

BIT Торговые часы: BTC по-прежнему под давлением 200 EMA на недельном графике, после отскока возможен перезапуск нисходящего движения; секторы хранения данных и полупроводников, выросшие ночью, начали падение в вечерней сессии

**Краткий обзор рынка: BTC под давлением, коррекция на рынке акций, внимание к данным и событиям** Рынок криптовалют демонстрирует осторожное восстановление. Bitcoin торгуется около $66 000, сталкиваясь со значительным сопротивлением в районе $68 000, где сосредоточены объемные "застрявшие" позиции. Ключевые технические уровни — 200-недельная скользящая средняя (~$63 333) и 200-недельная EMA (~$68 328). Аналитики отмечают низкую ликвидность, характерную для летнего периода. На фондовом рынке после сильного роста во вторник наблюдается коррекция. Фьючерсы на основные индексы США снижаются. Акции полупроводниковой и памяти, которые резко выросли накануне, падают в ночных торгах. Исключением стал SMCI, который вырос более чем на 15% после оптимистичного прогноза. На общий настрой негативно влияют рост цен на нефть (более $91 за баррель Brent) и доходности государственных облигаций США (10-летние — около 4,64%), что возрождает инфляционные опасения. Азиатские рынки показали нестабильную динамику. Индекс KOSPI в Корее вырос на 0,74%, а японский Nikkei 225 снизился на 0,18%. Основной риск для региона — ослабление японской иены до минимумов с 1986 года, что повышает вероятность вмешательства властей. **Ключевые события для наблюдения:** * **24 июля:** Финансовые отчеты Alphabet (Google), Tesla, IBM. Событие AMD, посвященное ИИ. * **25 июля:** Решение по процентной ставке ЕЦБ и пресс-конференция Кристин Лагард. Финансовые отчеты Intel, American Airlines, Honeywell и других. Данные по числу первичных заявок на пособие по безработице в США.

marsbit13 ч. назад

BIT Торговые часы: BTC по-прежнему под давлением 200 EMA на недельном графике, после отскока возможен перезапуск нисходящего движения; секторы хранения данных и полупроводников, выросшие ночью, начали падение в вечерней сессии

marsbit13 ч. назад

Бывший глава CFTC и президент Circle Тарберт: призывает к долгосрочной стратегии, но сам выводит $30 млн

Бывший председатель CFTC и президент Circle Хит Тарберт, публично пропагандируя долгосрочное видение компании для инвесторов на фоне падения акций на 70% с пиковых значений, сам активно распродавал свои акции CRCL. С момента IPO Circle он по плану 10b5-1 продал более 360 тысяч акций, выручив около 30 миллионов долларов, и при этом ни разу не докупал акции на открытом рынке. Эта разница между его публичными заявлениями и личными действиями вызвала критику. Карьера Тарберта демонстрирует классическое использование «вращающейся двери» между регулирующими органами и частным сектором. Уйдя с поста председателя CFTC в 2021 году, через 27 дней он занял должность главного юрисконсульта в маркет-мейкере Citadel Securities, который в тот момент находился под пристальным вниманием из-за скандала с акциями GameStop. Позже, уже работая в Citadel, Тарберт выступал за расширение полномочий CFTC на крипторынок, в то время как его работодатель планировал выход на этот рынок. В 2023 году Тарберт присоединился к Circle, где его опыт и связи сыграли ключевую роль в успешном проведении IPO компании в 2025 году. Однако его последующие массовые продажи акций, совпавшие с падением котировок и его же призывами к долгосрочным инвестициям, ставят под сомнение искренность его уверенности в будущем компании. Критики видят в его карьере образец превращения регуляторного опыта и политических связей в личную выгоду, в то время как риски несут обычные инвесторы, верящие его нарративам.

marsbit13 ч. назад

Бывший глава CFTC и президент Circle Тарберт: призывает к долгосрочной стратегии, но сам выводит $30 млн

marsbit13 ч. назад

Gate Research: Взлет «уолл-стритизации» криптофинансовых продуктов — это конкуренция или интеграция?

**Аналитический обзор Gate Research Institute: Волна "уолл-стритизации" криптофинансовых продуктов — конкуренция или интеграция?** Создание биткоина в 2009 году было ответом на финансовый кризис и стремлением построить децентрализованную систему без доверенных посредников. Однако к 2026 году значительная часть биткоинов (около 7,14%) хранится через ETF таких гигантов, как BlackRock. Это символизирует глубокую интеграцию традиционных финансов (TradFi) и крипторынка. С появлением биткоин-ETF, фьючерсов, RWA (токенизированных реальных активов) и государственных облигаций на блокчейне, традиционные институты получают всё больше влияния на выпуск, ценообразование, кастодию и дистрибуцию криптоактивов. Однако это не одностороннее поглощение, а взаимодополняющая конвергенция. Криптосфера приносит TradFi глобальную 24/7 ликвидность и программируемость, а TradFi предоставляет криптосфере регулируемые каналы, институциональное доверие и массовый доступ. Яркий пример — две противоположные, но ведущие к одной цели траектории: * **Путь А:** Криптобиржи, такие как Gate, начинают с токенизированных акций и CFD, а затем напрямую подключаются к инфраструктуре традиционных брокеров, предлагая реальную торговлю акциями США, Гонконга и Кореи за стейблкоины. * **Путь Б:** Традиционные брокеры, такие как Robinhood, интегрируют криптоактивы, а затем создают собственные Layer 2 для токенизации своих акций, стремясь к круглосуточной торговле. Обе стратегии нацелены на создание **универсального финансового аккаунта будущего** — единой точки доступа к акциям, криптовалютам, ETF, токенизированным облигациям и другим активам. Ключевой конкурентной борьбой становится не между CEX и брокерами, а между этими "супераккаунтами". Параллельно, слой RWA и токенизированных гособлигаций растёт даже на медвежьем рынке, становясь "прослойкой" для объединения капиталов. Хотя этот рынок (около $150 млрд токенизированных казначейских облигаций) ещё мал по сравнению с традиционным ($30 трлн), он демонстрирует устойчивый структурный тренд, привлекающий крупнейшие финансовые институты (JPMorgan, DTCC и др.). **Вывод:** "Уолл-стритизация" — это не поражение идеалов децентрализации, а формирование новой гибридной модели. Децентрализованные протоколы продолжают работать на базовом уровне, в то время как на уровне приложений и пользовательского опыта формируется более эффективный, глобальный и свободный объединённый рынок капитала, где активы TradFi и DeFi торгуются бок о бок в одном интерфейсе. Уолл-стрит не завоевала криптосферу, а криптосфера не обошла Уолл-стрит — они совместно строят новые финансовые рельсы.

marsbit13 ч. назад

Gate Research: Взлет «уолл-стритизации» криптофинансовых продуктов — это конкуренция или интеграция?

marsbit13 ч. назад

S&P Dow Jones и Pantera выпускают криптоиндекс, биткоин оставлен за бортом из-за «отсутствия прибыли»

Стандард энд Пурс (S&P Dow Jones Indices) совместно с Pantera Capital запускает индекс S&P Pantera Digital Asset Index. Новый индекс включает 18 токенов, но исключает биткоин, XRP и мем-токены. Критерием отбора послужила «финансовая жизнеспособность», по аналогии с S&P 500: протокол должен демонстрировать положительный доход в течение нескольких кварталов и распределять стоимость среди держателей токенов. Это первое применение фундаментального подхода к оценке криптоактивов со стороны крупнейшего в мире провайдера индексов. В первую пятерку активов вошли Ethereum (ETH), BNB, Solana (SOL), TRON (TRX) и Hyperliquid (HYPE). Pantera отмечает, что совокупный годовой доход всех протоколов индекса превышает $30 млрд. Биткоин был исключен по трем причинам: он рассматривается как монетарный актив, доступный через отдельные ETF; он не генерирует доход протокола; а смешивание его в индексе с доходными активами затрудняет фундаментальный анализ для институциональных инвесторов. Пока индекс является эталонным, но Pantera ведет переговоры о создании на его основе ETF и других инвестиционных продуктов. Компания также отмечает значительный разрыв на рынке: многие институциональные инвесторы готовы к аллокации в криптоактивы, но им не хватает структурированных продуктов, фокусирующихся на активах с реальной экономической деятельностью.

marsbit13 ч. назад

S&P Dow Jones и Pantera выпускают криптоиндекс, биткоин оставлен за бортом из-за «отсутствия прибыли»

marsbit13 ч. назад

Торговля

Спот
活动图片