Bitcoin continues to struggle below the $70,000 level, with repeated attempts to regain upward momentum meeting persistent selling pressure. The inability to sustain rallies has kept market sentiment cautious, and several analysts are increasingly warning that a deeper correction below $60,000 remains possible if current conditions persist. Volatility has risen in recent weeks, while liquidity conditions appear tighter, contributing to a defensive posture among both retail and institutional participants.
Despite this fragile backdrop, a recent CryptoQuant report offers a more nuanced perspective on the current phase. According to the analysis, Bitcoin has been trending downward for roughly four months following its all-time high reached in October 2025. While price action reflects sustained weakness, the report suggests the market may now be approaching what could be considered an undervalued zone from an on-chain valuation standpoint.
Such phases have historically emerged during later stages of corrective cycles, when market participants gradually reassess positioning and speculative excesses are reduced. Although this does not necessarily signal an immediate rebound, it introduces the possibility that downside risk may begin to moderate if broader liquidity conditions stabilize.
The report further notes that valuation metrics are beginning to approach levels historically associated with accumulation phases. The Market Value to Realized Value (MVRV) ratio, a widely followed on-chain indicator, is currently near 1.1. Traditionally, readings below 1 have signaled that Bitcoin is trading below its aggregate cost basis, a condition often interpreted as undervaluation. While the indicator has not yet crossed that threshold, its proximity suggests the market may be entering a zone where downside risk gradually compresses.
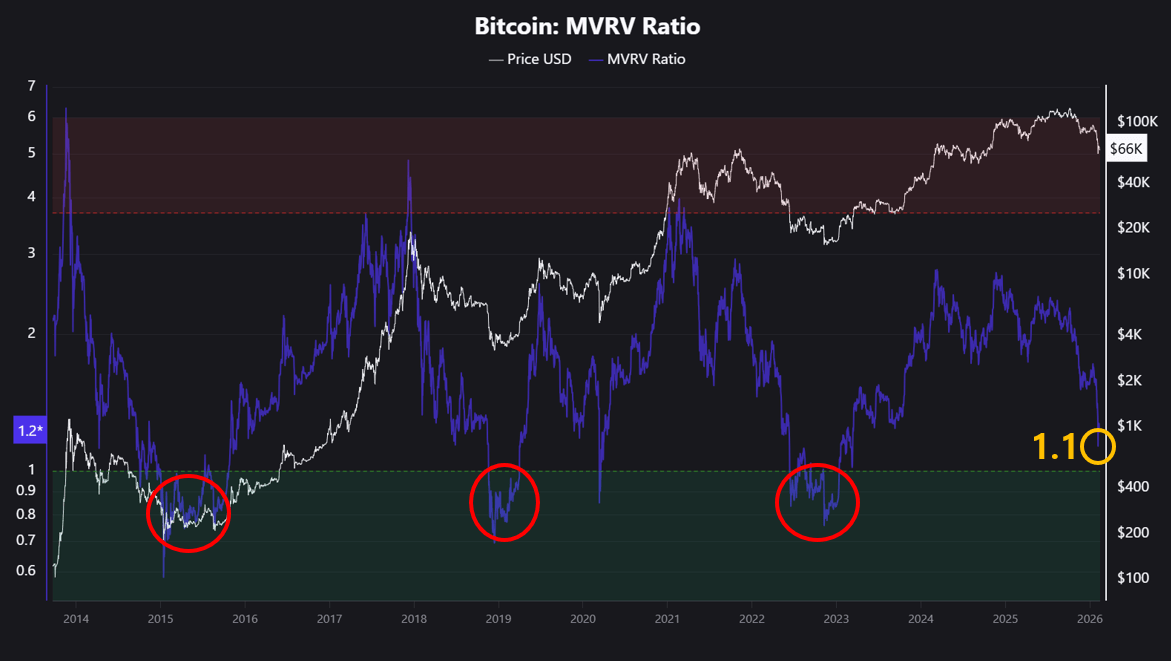
At the same time, analysts emphasize an important structural distinction from previous cycles. Unlike earlier bull markets, Bitcoin did not surge deep into a clearly overheated valuation zone before the recent correction began. This implies the current drawdown may not follow the same capitulation dynamics seen in prior bear market bottoms, complicating direct historical comparisons.
From a strategic standpoint, the analysis suggests that periods of market weakness often provide the most effective window for long-term positioning. For assets with a persistent upward macro trajectory, preparation during downturns tends to improve risk-adjusted outcomes. However, this does not eliminate near-term volatility risks, particularly while macro liquidity conditions remain uncertain and sentiment continues to shift.
Bitcoin price action continues to show persistent weakness, with the chart illustrating a clear sequence of lower highs and lower lows since the late-2025 peak near the $120K–$125K region. The recent breakdown below the $70K level reinforces the bearish structure, particularly as price remains well below the 50-week and 100-week moving averages, both of which are now sloping downward. This alignment typically reflects sustained distribution rather than a temporary correction.
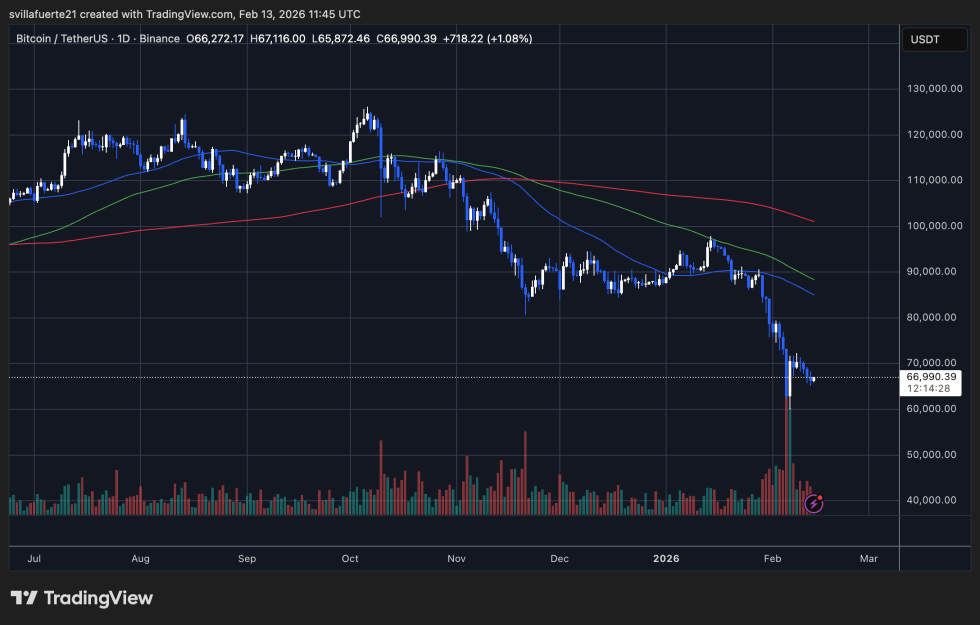
The sharp selloff into the mid-$60K area was accompanied by a noticeable spike in trading volume, suggesting forced liquidations or aggressive spot selling rather than routine profit-taking. While price has attempted minor stabilization around the $65K–$68K range, the lack of strong rebound momentum indicates buyers remain cautious. Historically, such muted recoveries after high-volume declines often signal ongoing market uncertainty rather than immediate reversal.
From a structural standpoint, the next critical technical focus lies near the $60K psychological level, which could act as interim support if selling pressure continues. Conversely, any sustained recovery would first require reclaiming the $70K zone and stabilizing above key moving averages. Until that occurs, the broader trend remains defensive, with volatility likely to persist as the market searches for a clearer equilibrium.
Featured image from ChatGPT, chart from TradingView.com

Related Posts

Brazil Revives Strategic Bitcoin Reserve Plan Targeting Purchase Of Up To 1 Million BTC

Bitcoin Stares Down the $55,000 Floor: The Last Bastion Before On-Chain Capitulation

This Key Bitcoin Metric Signals That The Downside May Persist A Bit Longer

¿Por qué BTC es tan volátil y qué tiene que ver con su tecnología?

Bitcoin Developers Kick Off Quantum-Safety Track With BIP-360