Odaily приглашенный аналитик рынка Cody Feng, магистр финансовой статистики Колумбийского университета (США), со времен университета специализируется на количественной торговле акциями США, постепенно расширяя деятельность до биткойна и других цифровых активов. В процессе практики разработал систематическую модель количественной торговли и систему управления рисками; обладает острым аналитическим восприятием рыночной волатильности и стремится к постоянному углублению в профессиональную торговлю, добиваясь стабильной доходности. Еженедельно будет глубоко анализировать технические, макроэкономические и денежные аспекты BTC, проводить разборы и демонстрировать практические стратегии, а также анонсировать важные предстоящие события для справки.

Недельный разбор биткойна(05.01~11.01)
Сначала вывод:
Общее движение биткойна на этой неделе практически полностью происходило в рамках обозначенного нами в начале недели колебательного диапазона в $84 000~94 500. Цена точно встретила сопротивление в зоне давления $93 000~94 500, а затем отступила к средней и нижней части диапазона, что практически подтвердило верность определения ключевых точек.
В этой сделке мы открыли короткую позицию около $94 000 и закрыли всю позицию около $91 000, захватив около 3,4% прибыли (спот) за одну сделку в диапазоне, осуществив реализацию прибыли с высокой определенностью и низкой просадкой на колебательном рынке.
I. Проверка ключевого диапазона и точек на этой неделе
В начале недели мы четко указали, что на этой неделе необходимо уделить особое внимание ситуации с игрой быков и медведей на верхней и нижней границах диапазона $84 000~94 500.
Фактическое движение показало, что биткойн явно встретил сопротивление после отскока в зону давления $93 000~94 500, несколько раз безуспешно пытался пробиться вверх, а затем отступил под давлением, подтвердив эффективность этого региона в качестве временного «потолка».
Что касается точек поддержки, то после снижения до $86 000~86 500 цена явно показала признаки остановки падения и стабилизации, покупатели начали поглощение, а ключевая линия защиты на $84 000 ниже пока не была достигнута, и общая структура по-прежнему сохраняется в рамках широкого колебательного диапазона.
II. Выполнение Плана А (от входа до выхода)
На основе суждения о колебаниях в диапазоне, разработанный нами в начале недели План А был эффективно выполнен.
Когда цена отскочила в регион $93 000~94 500 и появились признаки истощения роста, при этом две модели (импульсная и торговля на спреде)共振но подавали сигналы вершины, мы немедленно открыли короткую позицию по цене $93 771, после чего рынок, как и ожидалось, пошел вниз.
Когда модель «торговли на спреде» подала сигнал дна, мы в конечном итоге закрыли всю позицию по цене $90 584, завершив полную, свободную от эмоций короткую сделку. Весь торговый процесс не является «умением задним числом», а представляет собой планирование заранее, выполнение в процессе и проверку постфактум.
III. Идеи для операций во второй половине недели
График биткойна за 4 часа: (Модель количественного импульса + Модель торговли на спреде)
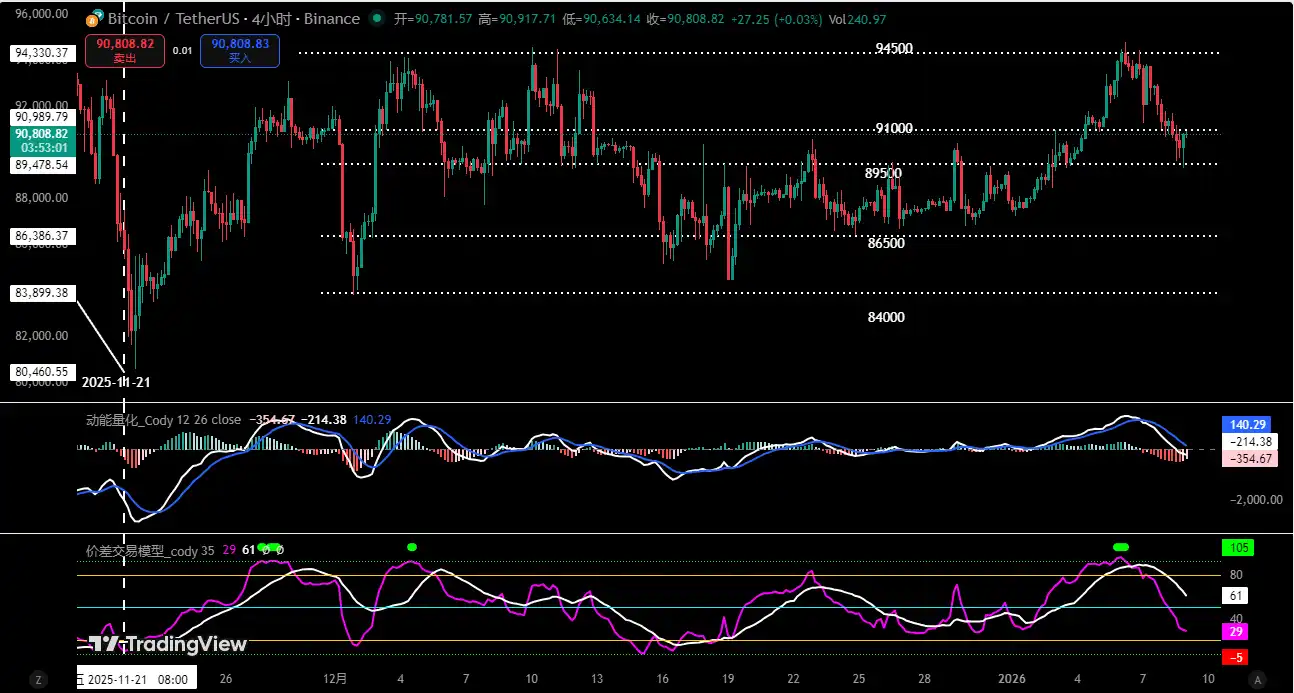
С точки зрения технической структуры на 4-часовом таймфрейме (см. график выше), биткойн в настоящее время находит эффективную поддержку около $86 500, несколько технических индикаторов вошли в зону перепроданности, что указывает на то, что краткосрочное давление продаж уже высвобождено, и рынок имеет потребность в техническом восстановительном отскоке (колебательный отскок), но этого еще недостаточно, чтобы подтвердить разворот нисходящего тренда.
Исходя из этого, мы ожидаем, что цена может сначала отскочить и протестировать регион $92 000~93 000, который одновременно является средней и верхней частью предыдущего колебательного диапазона и, как ожидается, снова сформирует давление.
В краткосрочных операциях по-прежнему следует придерживаться диапазонного мышления: если отскок достигает этой зоны и появляются признаки истощения импульса, неудачного прорыва вверх, можно рассмотреть возможность открытия коротких позиций на пиках; если произойдет эффективный пробой $94 500, необходимо果断止损 и переоценить структуру рыночного движения.
IV. Итог
В целом, биткойн по-прежнему движется в рамках широкого колебательного паттерна, определенного в начале недели: поддержка снизу предоставляет пространство для отскока, сопротивление сверху ограничивает высоту. В настоящее время, чем делать ставку на одностороннее движение, лучше уважать структуру диапазона, сосредоточившись на точках с высокой определенностью и строгом контроле рисков.
На колебательном рынке разработка гибких стратегий реагирования и стабильное получение прибыли гораздо важнее, чем предсказание направления.
Отказ от ответственности: Вышеизложенное является лишь изложением личной точки зрения на рынок и не представляет собой какое-либо инвестиционное предложение. Криптовалюты highly волатильны, пожалуйста, обязательно принимайте независимые решения и строго контролируйте риски.


