Market Plunges into Extreme Panic, Five Major Data Indicators Reveal BTC Buying Signals

比推Опубликовано 2026-02-02Обновлено 2026-02-02

Введение

The cryptocurrency market is experiencing extreme fear, with Bitcoin (BTC) dropping to $75,700 and Ethereum (ETH) to $2,220, causing $435 million in liquidations. A survey of 1,189 investors revealed that 45.6% believe BTC’s 2026 bottom will be between $75,000–$85,000, while 30.2% see it at $60,000–$75,000. Nearly half of respondents (47.2%) plan to DCA and hold long-term. Key on-chain metrics from Glassnode indicate potential support levels: the short-term holder cost basis is $95,400, the active investor average is $87,300, the realized price is $80,500, and the network-wide average cost basis is $55,900. The ahr999 indicator, which recently fell below 0.45 for the first time since October 2023, suggests a buying opportunity below $76,000. Analyst Willy Woo’s CVDD model points to a hard bottom near $45,000, while the cost basis of large holder “Strategy” ($76,040) is seen as a critical support level. Overall, data suggests a potential bottom formation between $45,000–$76,000.

Author: Ma He, Foresight News

Original Title: 5 Major Data Indicators Revealed: Is There a BTC Buying Signal Below $75,000?


Wintermute stated last week that $85,000 is a key level for BTC and that a direction would be chosen soon. Unfortunately, the direction was not upward but sharply downward.

On February 2, BTC fell to $75,700, and ETH dropped to $2,220. Numerous altcoins continued to decline. Regarding liquidation data, Coinglass data shows that $435 million was liquidated in the past 12 hours, with long positions accounting for $324 million.

The market fear index is 15, indicating that market sentiment has once again fallen into extreme panic.
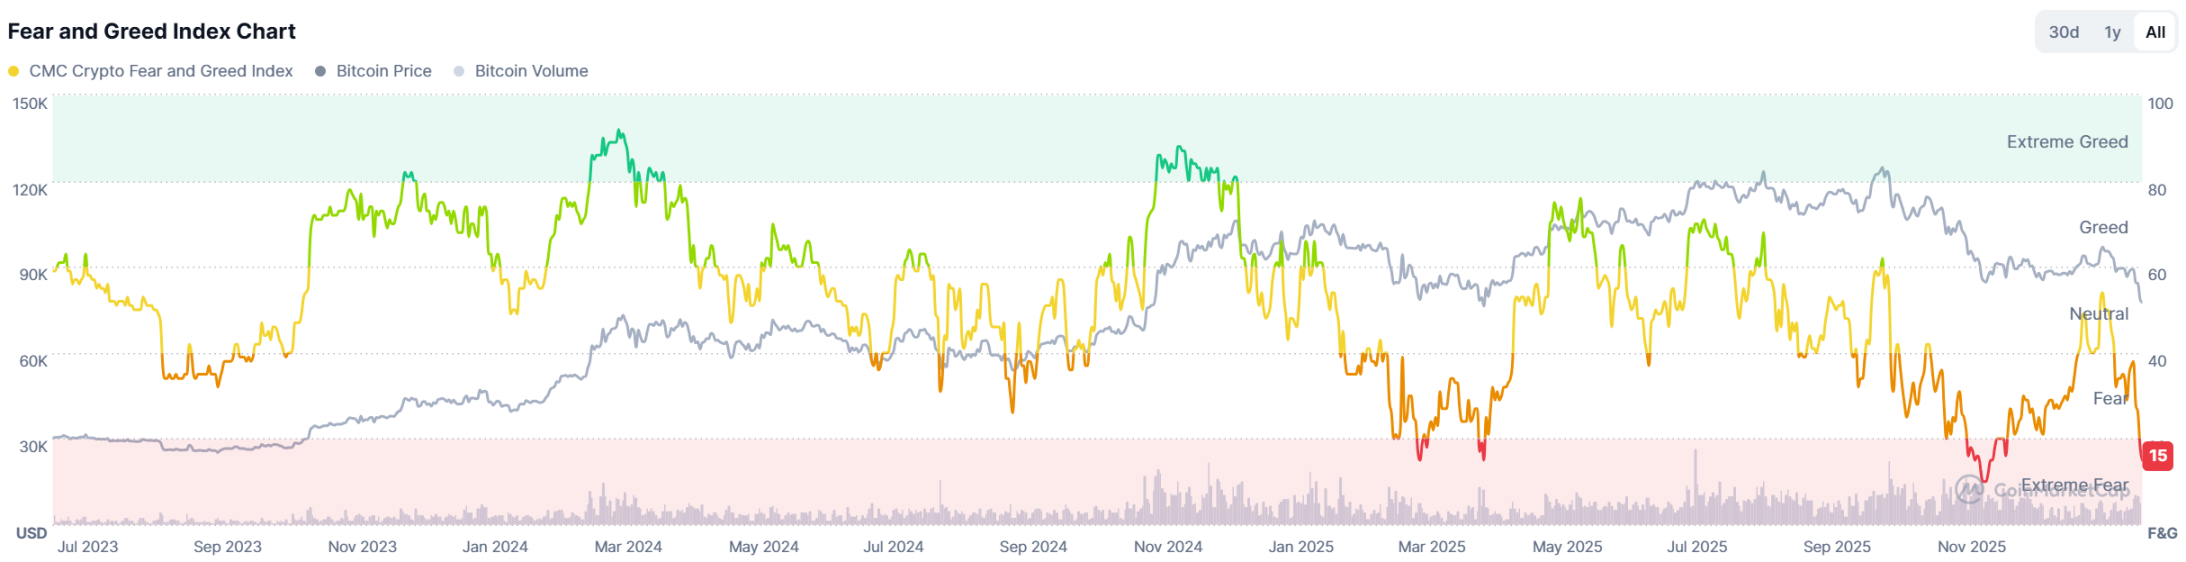
After the market turned bearish, where is BTC's bottom range? Five major data indicators reveal the answer.

Data Survey: 30% of Users Believe BTC's Bottom Range Is Between $60,000 and $75,000

On January 30, Foresight News conducted an investor market confidence survey. At the time of the survey, BTC was priced at $84,000. It has since fallen significantly over the following days, so the survey results are for reference only.

The poll (with 1,189 participants) showed that most respondents (45.6%) believe BTC's bottom price in 2026 will be between $75,000 and $85,000. Another 30.2% of respondents believe the bottom price will be between $60,000 and $75,000.
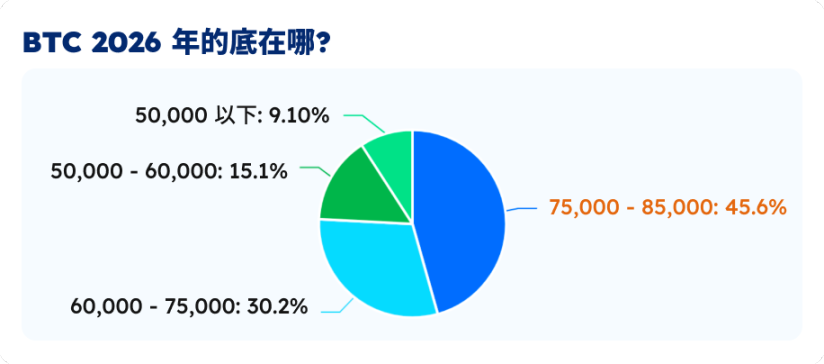
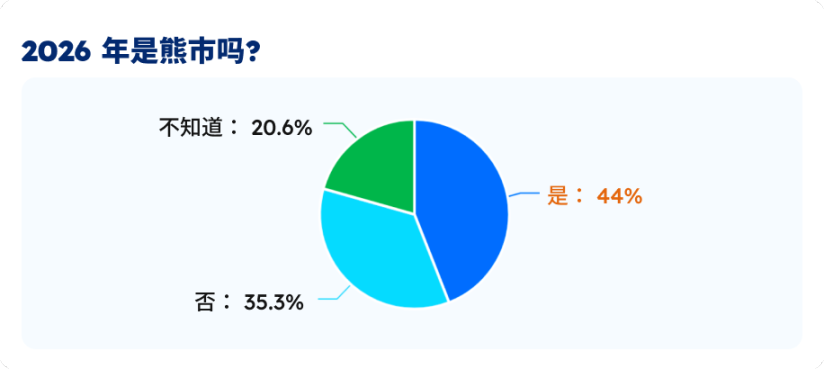
44% of respondents believe 2026 will be a bear market, while 35.3% disagree and do not think it will be a bear market. Another 20.6% of respondents are uncertain.
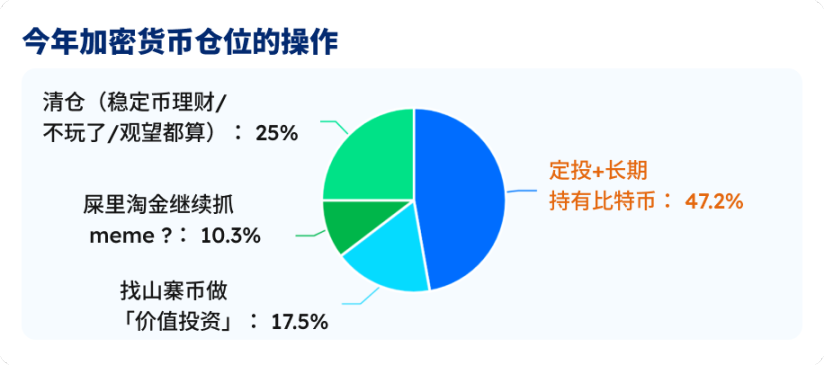
Nearly half of the respondents (47.2%) choose to dollar-cost average and hold Bitcoin long-term. Another 25% of respondents choose to liquidate their positions and switch to stablecoin investments or wait and see. 17.5% of respondents are looking for altcoins for value investing.
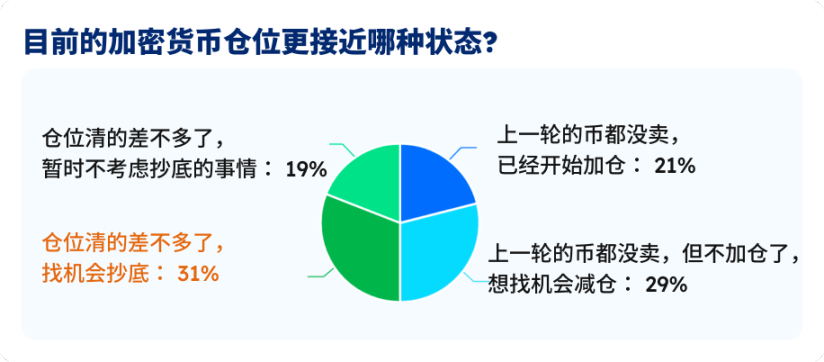
Currently, among the voting respondents, 31% say they have mostly cleared their positions but are still looking for opportunities to buy the dip. 29% say they haven't sold their holdings from the last cycle but are not adding positions for now and are looking for opportunities to reduce them. 21% say they haven't sold their holdings from the last cycle and have already started adding positions.
Glassnode Shows BTC's On-Chain Cost Basis Is $55,900

As Bitcoin falls below $78,000, Glassnode has updated the key on-chain price distribution as follows: The STH (Short-Term Holder) cost basis, reflecting the average holding price of new buyers/traders who entered the market in recent months, is $95,400.
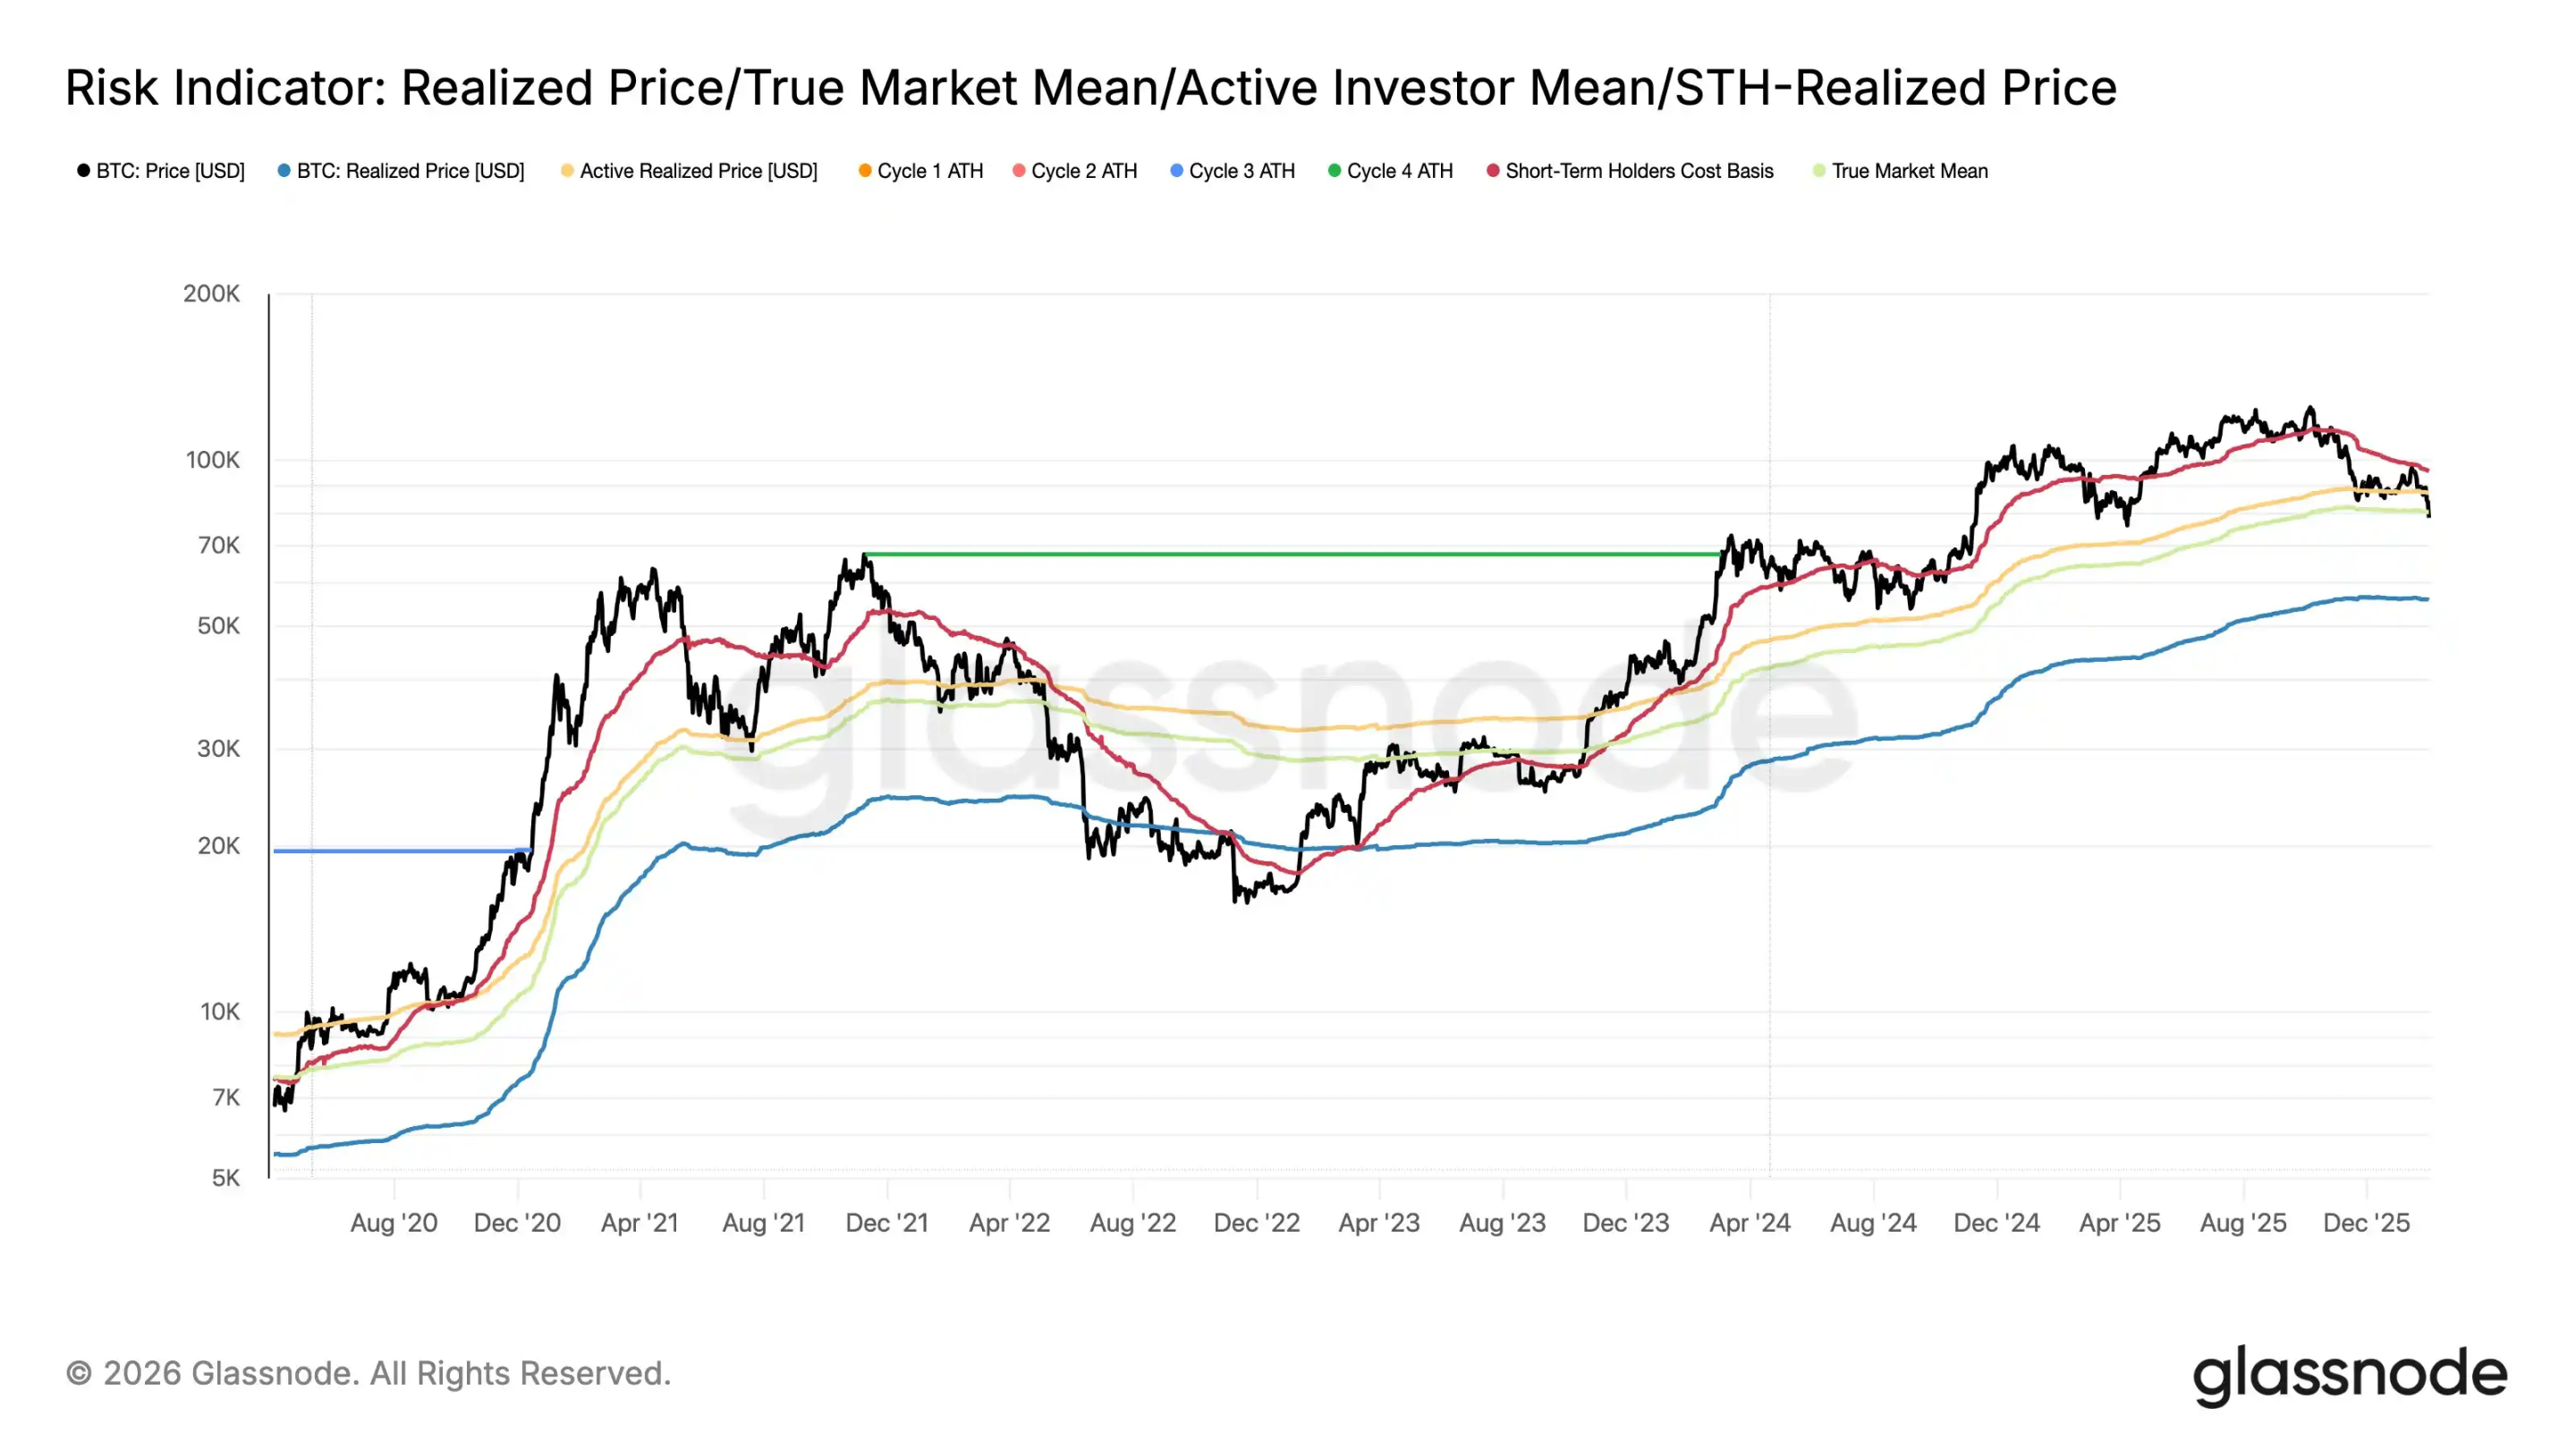
The average investment of active investors, representing the average holding cost of traders currently "on the field," is $87,300; the Realized Price, focusing on the cost basis of actual traders in the secondary market, is $80,500. The Coin Price, representing the average cost basis of all coins across the entire network, is $55,900.

This means that when the BTC price is below $80,500, your purchase price is lower than the cost price of other recent traders. If BTC falls below $55,900, it means your purchase price is already below the average cost of the entire network.

In the 2022 cycle, the BTC price once fell below the entire network's average cost basis. In this cycle, influenced by macro liquidity, spot ETFs, and other factors, whether BTC will fall below $55,900 remains unknown.

Ahr999 Indicator Shows Accumulation Signal

The ahr999 indicator was invented years ago by Weibo user ahr999 to evaluate BTC's short-term returns and price deviations. The calculation formula is (Current Price / 200-day Dollar-Cost Average) × (Current Price / Exponential Growth Valuation), where the exponential growth valuation is based on a fitting curve of historical prices and block height, representing the long-term "fair value." Historical experience shows: ahr999 1.2 is the high-price zone.
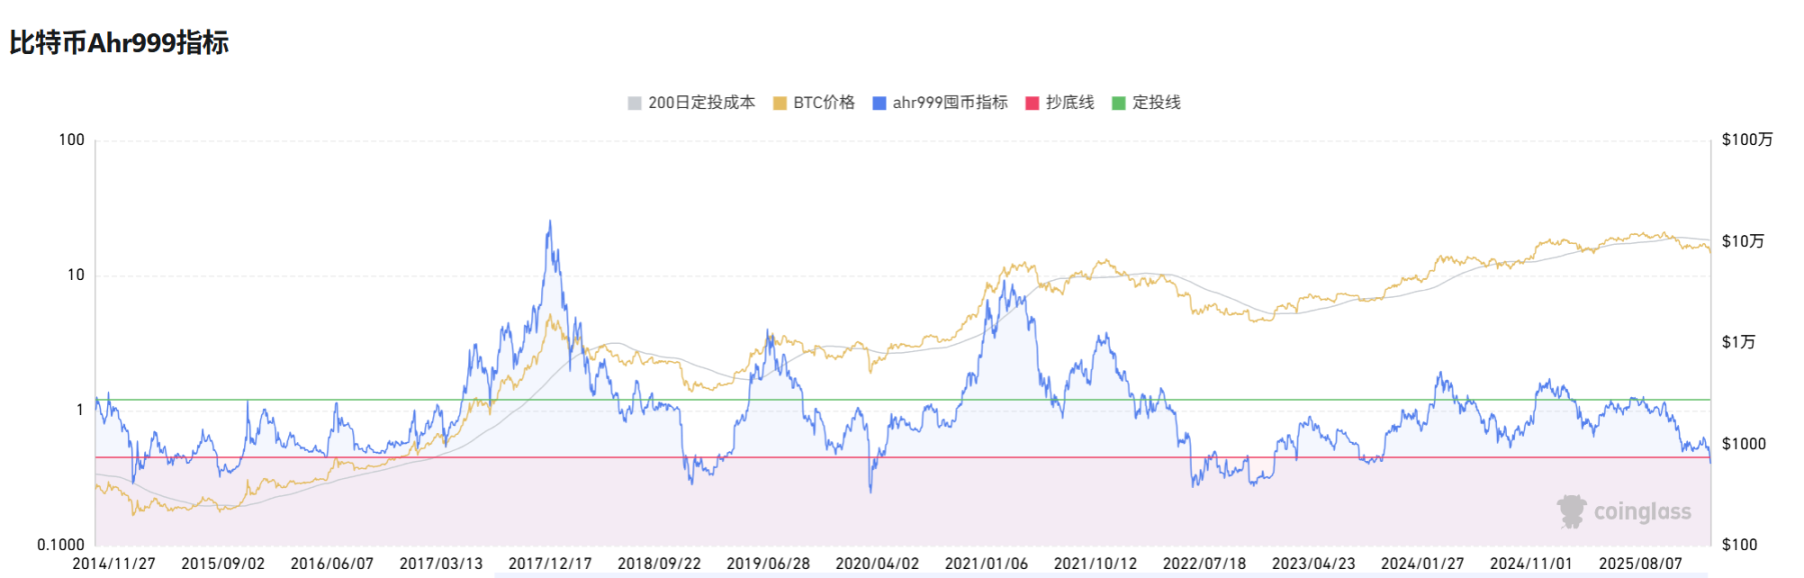
On February 1, 2026, ahr999 fell below 0.45 for the first time, the first occurrence in 839 days since October 16, 2023, marking a potential market bottom. The current break below the threshold suggests the BTC price is significantly below long-term growth expectations, similar to the end of the 2023 bear market. This signal strongly suggests buying the dip, but it needs to be confirmed with trading volume to avoid false breakouts. Buying strategy: If ahr999 stabilizes below 0.45, consider buying in batches below $76,000, and reduce positions when it rebounds above 1.2.

Willy Woo Indicator Shows BTC's Hard Bottom Is $45,000

The indicator developed by renowned analyst Willy Woo is the CVDD model. "When Bitcoin transfers from an old investor who bought at $1 to a new investor who buys at $100,000, the new investor will value these Bitcoins with a higher floor price, which helps raise the perceived floor price of the entire Bitcoin supply globally. Active custodian rotation (i.e., frequent transfers of Bitcoin between different investors or custodians) may also indicate that investors value these Bitcoins highly."

When many whales transfer BTC to new Bitcoin wallet addresses, the market's bottom price is rising.
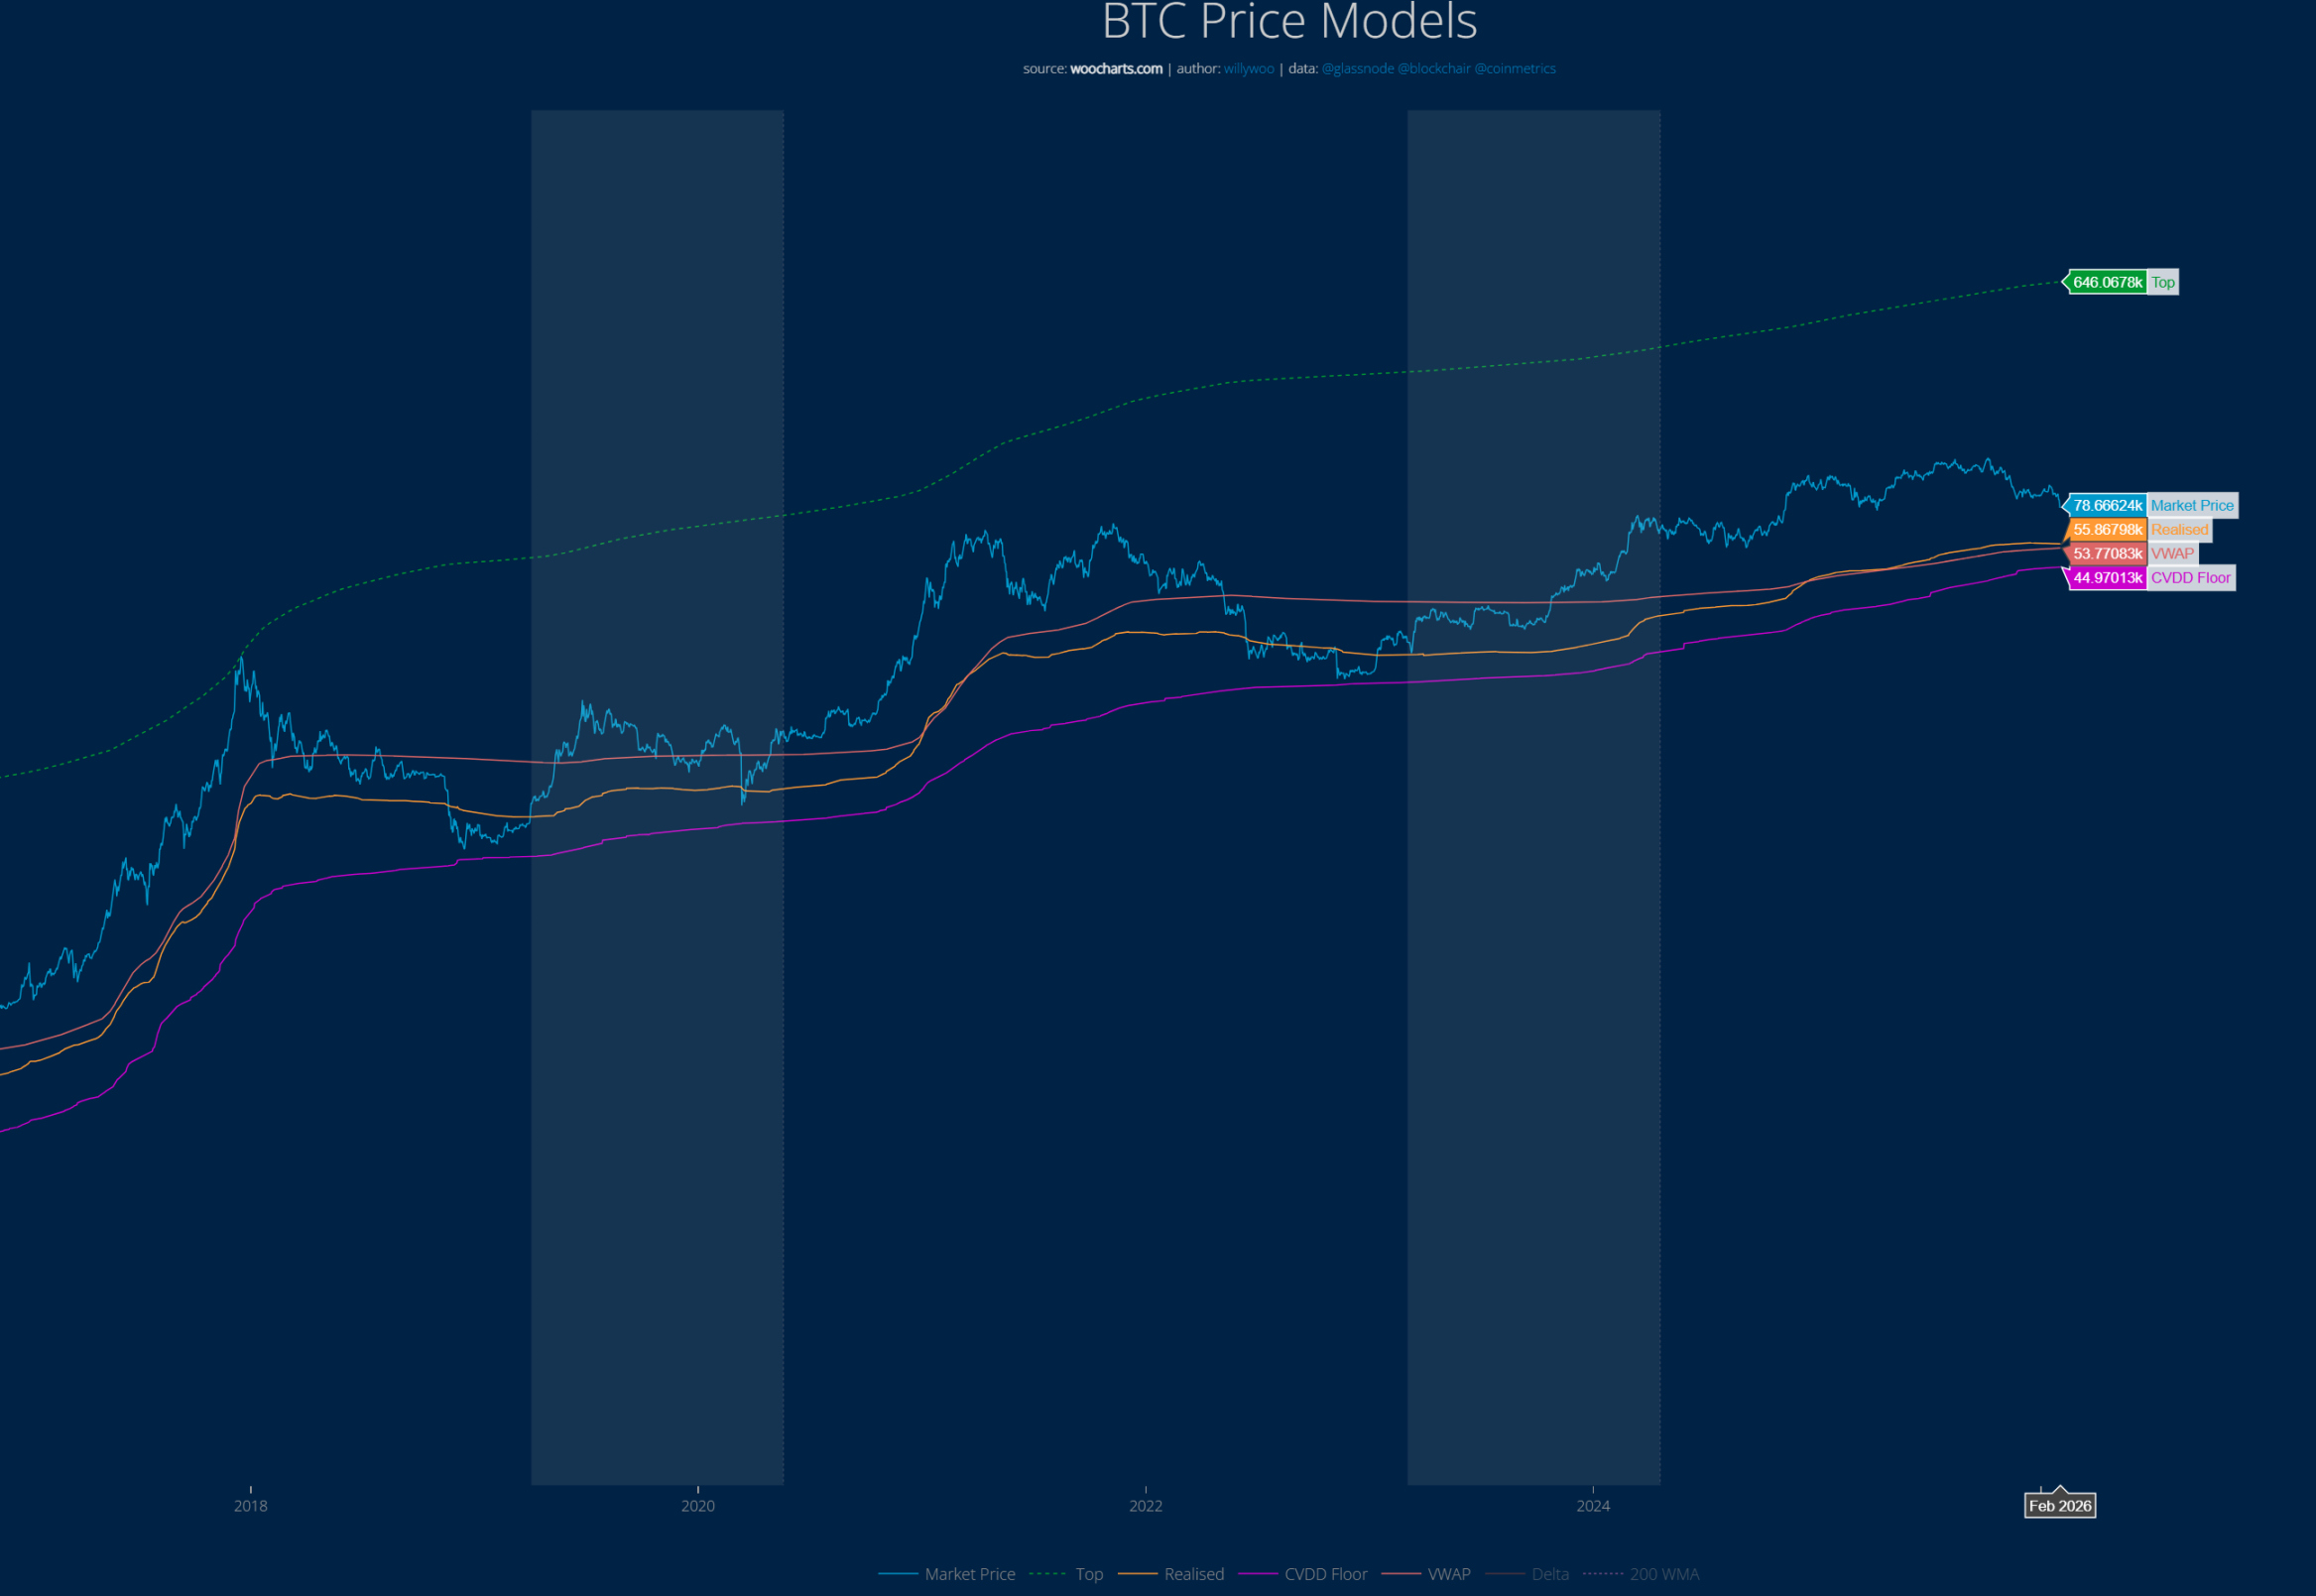
The BTC price has never fallen to the red line (CVDD model). Currently, the CVDD indicator shows a hard bottom of approximately $45,000. In past cycles, BTC once fell below the yellow line in the chart, which currently ranges from $53,000 to $56,000.

Strategy's Bitcoin Cost Price Is $76,040

As of February 2, the well-known Bitcoin accumulation大户 (large holder) Strategy holds a total value of approximately $54.2 billion, with 712,647 BTC. Their average holding cost is about $76,040.
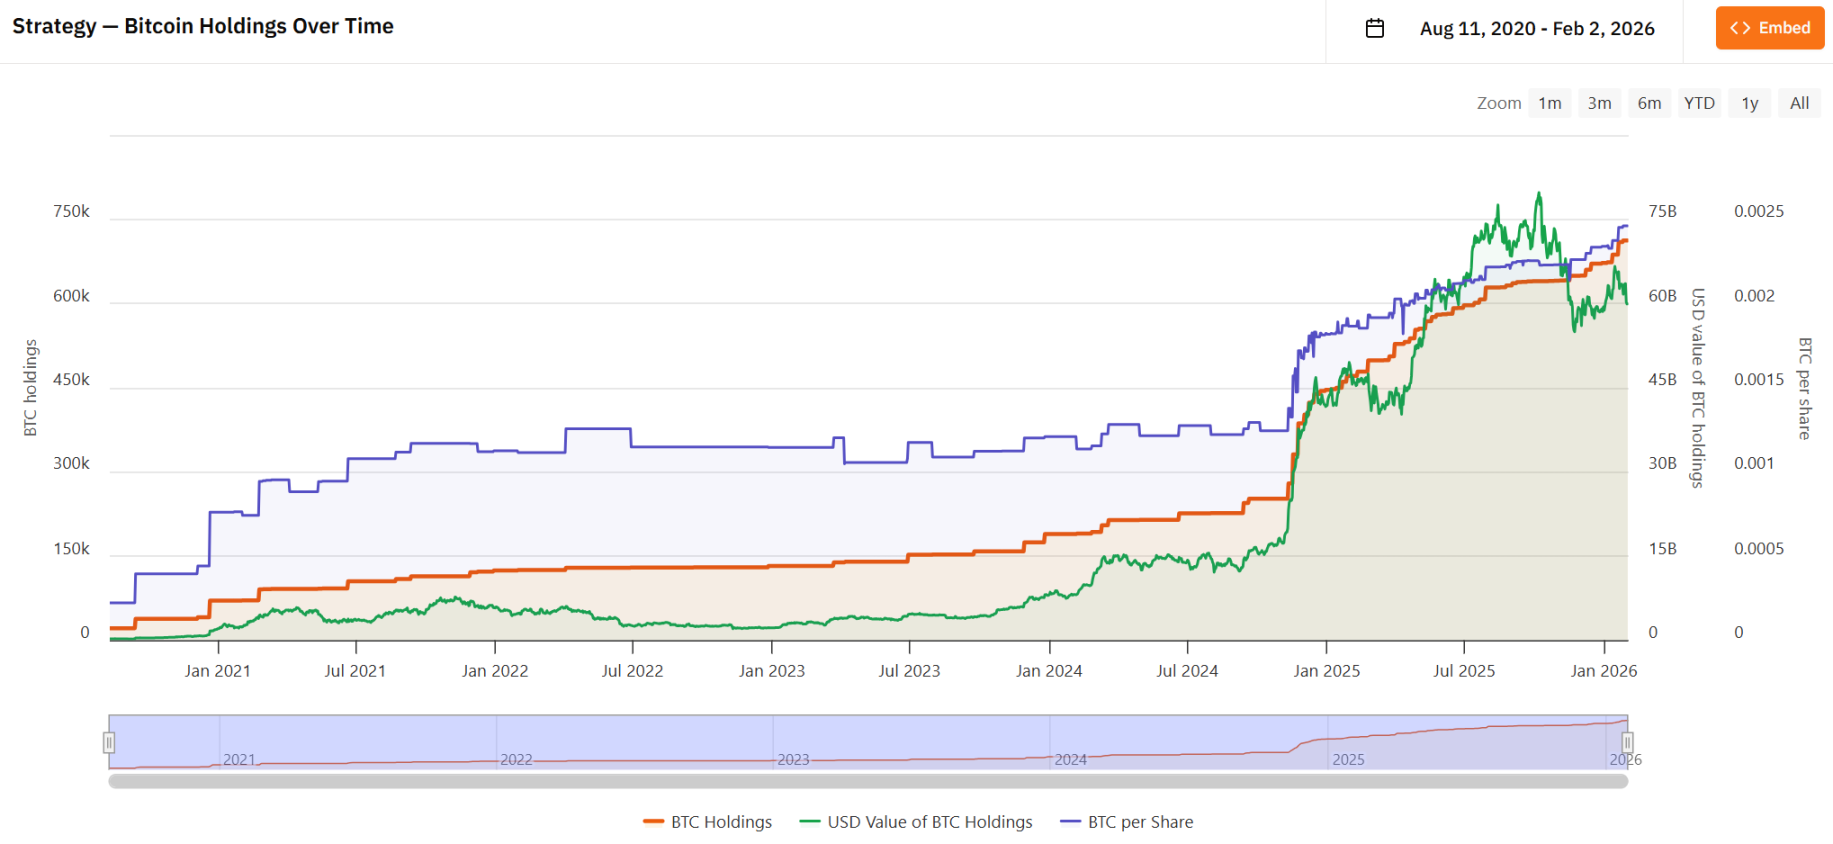
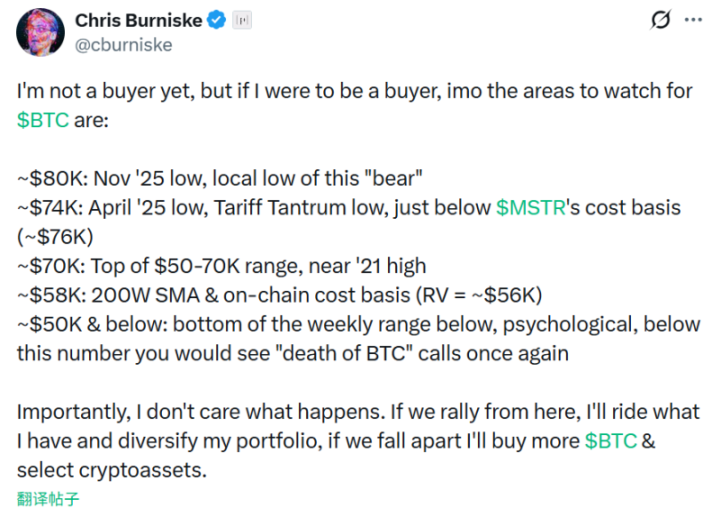
Historically, the area below this average cost has been the bottom range. Placeholder partner Chris previously stated that the $74,000 to $76,000 range is a price line worth paying close attention to.

Twitter:https://twitter.com/BitpushNewsCN

Bitpush TG Discussion Group:https://t.me/BitPushCommunity

Bitpush TG Subscription: https://t.me/bitpush

Original link:https://www.bitpush.news/articles/7608002

Связанные с этим вопросы

QWhat is the current market sentiment according to the Fear & Greed Index mentioned in the article?

AThe market sentiment is at 'Extreme Fear', with a Fear & Greed Index reading of 15.

QAccording to the ahr999 indicator, what is the signal for a potential market bottom and when did it last occur?

AThe ahr999 indicator falling below 0.45 is a signal for a potential market bottom. This last occurred on February 1, 2026, which was the first time in 839 days since October 16, 2023.

QWhat is the 'iron bottom' price for Bitcoin as indicated by Willy Woo's CVDD model?

AWilly Woo's CVDD model indicates an 'iron bottom' price for Bitcoin at approximately $45,000.

QWhat is the average on-chain cost basis for the entire Bitcoin network, as provided by glassnode?

AThe average on-chain cost basis for the entire Bitcoin network is $55,900.

QWhat price range did the majority of respondents in the Foresight News survey believe would be the bottom for BTC in 2026?

AThe majority of respondents (45.6%) believed the bottom price for BTC in 2026 would be in the range of $75,000 to $85,000.

Похожее

Неожиданное событие в XRP: генеральный директор Grayscale продаст XRP, купленный до листинга!

Генеральный директор Grayscale Питер Минцберг объявил о намерении продать 2611 акций биржевого фонда $XRP Trust (GXRP) на общую сумму около 53,4 тыс. долларов. Эти акции были приобретены им в октябре 2024 года в ходе частного размещения, задолго до выхода фонда на публичную биржу. Продажа будет осуществлена через Cantor Fitzgerald на NYSE Arca. Минцберг не первый руководитель Grayscale, сокращающий свою долю в GXRP. Ранее о продаже части своих акций до IPO уведомляли основатель Digital Currency Group Барри Силберт и главный юрисконсульт Grayscale Крейг Салм. По мнению аналитиков, решение генерального директора может быть связано со стремлением снизить риски на фоне опасений относительно повышения процентных ставок ФРС и задержек в принятии Закона о ясности рынка (Clarity Act). Фонд GXRP был запущен путем частного размещения в сентябре 2024 года, и инсайдеры получили акции на этой ранней стадии.

cryptonews.ru20 мин. назад

Неожиданное событие в XRP: генеральный директор Grayscale продаст XRP, купленный до листинга!

cryptonews.ru20 мин. назад

Краткая история литографии: как один луч света шёл шестьдесят девять лет

В 2026 году появление пяти иммерсионных DUV-литографов китайского производства вызвало падение акций ASML на 6,3%, стерев с её капитализации 440 млрд долларов. Это событие поколебало идею о вечной зависимости Китая от импорта оборудования такого уровня. История литографии, начавшаяся с Джейя Ласропа в 1957 году, — это история не столько технологий, сколько выживания производителей благодаря клиентам. После первых контактных машин (США, 1960-е, Китай — 1966 г.) развитие шло через проекционные (PerkinElmer, 1973) и пошаговые (GCA, 1978) системы. В 1980-х доминирование США за десять лет сменилось гегемонией японских Nikon и Canon. Однако ключевой прорыв — иммерсионная литография — произошёл благодаря ASML и идее тайваньца Берни Лин (2002) о воде между линзой и пластиной, что обошло тупиковую гонку за 157 нм. Создание EUV-литографа (13,5 нм) потребовало 21 года, инвестиций в 60+ млррд евро и совместного финансирования от Intel, TSMC и Samsung. Итог: ASML владеет почти 100% рынка EUV и ~99% иммерсионного DUV. Суть этой 69-летней гонки: победитель определяется не тем, кто создаст прототип (это делали многие, включая Китай в 1966 и 1985), а тем, у кого есть клиенты, готовые десятилетиями терпеть несовершенные первые модели, делиться инженерами и финансировать разработку. США потеряли отрасль, отказавшись покупать свои машины. Япония проиграла, сделав неверную ставку на 157 нм. Голландская ASML выжила, потому что её клиенты — крупнейшие чипмейкеры мира — согласились «кормить» её всё время пути.

marsbit25 мин. назад

Краткая история литографии: как один луч света шёл шестьдесят девять лет

marsbit25 мин. назад

Стоимость страхования долговых обязательств ИИ достигла рекордного уровня на фоне обвала азиатских полупроводниковых акций

Ключевые моменты: Индекс KOSPI за два дня рухнул почти на 17%, потеряв $620 млрд капитализации из-за распродаж, спровоцированных слабой отчетностью SK Hynix. Розничные инвесторы, активно использовавшие новые плечевые ETF, понесли значительные убытки, что вынудило власти извиниться и призвать к запрету таких инструментов. Просадка на рынке акций полупроводников и ИИ отражает более широкую усталость от этого тренда. Риски перекинулись на кредитные рынки: стоимость страхования от дефолта (CDS) для пяти крупнейших американских IT-гигантов (Amazon, Meta, Microsoft, Google, Oracle) достигла рекордного уровня в 162 базисных пункта. Рынок оценивает вероятность их дефолта в ближайшие пять лет в 12%. Основным фактором риска признан Oracle из-за больших инвестиций в ИИ и сильной зависимости от одного клиента — OpenAI. При этом совокупные капитальные расходы гигантов в 2026 году могут достичь $730 млрд, а у Alphabet зафиксирован первый в истории квартальный отток денежных средств.

cointelegraph40 мин. назад

Стоимость страхования долговых обязательств ИИ достигла рекордного уровня на фоне обвала азиатских полупроводниковых акций

cointelegraph40 мин. назад

Европейские финансовые институты запускают кооперативную блокчейн-сеть RL1

Десять европейских финансовых учреждений запустили Regulated Layer One (RL1) — совместную блокчейн-кооперативную сеть, разработанную для регулируемых финансовых рынков и токенизированных активов. Сеть была создана как Европейское кооперативное общество в Люксембурге, а её основателями выступили ABN AMRO, Cecabank, Chartered Investment, Crédit Mutuel Alliance Fédérale, DekaBank, DZ BANK, LBBW, Natixis CIB, SC Ventures и Seturion. Каждый член кооператива обладает равными правами в управлении и развитии сети. RL1 — это частная разрешённая сеть, основанная на инфраструктуре немецкой финтех-компании SWIAT, которая передала право собственности на сеть кооперативу. За три года эксплуатации платформа обработала более 50 транзакций на сумму свыше 700 миллионов евро. Блокчейн предназначен для поддержки институциональных сценариев использования, включая цифровые деньги, токенизированные облигации, обеспечение и расчеты. Общая сеть призвана снизить фрагментацию, вызванную использованием финансовыми учреждениями отдельных систем распределённого реестра. Руководить RL1 будет бывший управляющий директор SWIAT Хеннинг Фолльбер. KfW и L-Bank продолжат поддерживать инициативу, а RL1 ведёт переговоры о присоединении к сети с другими учреждениями, включая NatWest.

cointelegraph40 мин. назад

Европейские финансовые институты запускают кооперативную блокчейн-сеть RL1

cointelegraph40 мин. назад

Аналитик CryptoQuant утверждает, что «пугающий сценарий и одновременно многообещающий сигнал для биткоина» раскрывают окончательную точку минимума! Вот подробности

Криптоаналитик из CryptoQuant заявил, что признаки завершения медвежьего рынка биткоина становятся всё более очевидными. После достижения исторического максимума в $126 000 в октябре 2025 года BTC упал более чем на 50%, опустившись до уровня около $57 000. По мнению аналитика, давление продавцов ослабевает: коррекции становятся короче, а восстановления — масштабнее. Технические индикаторы, такие как MACD и RSI, показывают бычьи дивергенции и сигналы перепроданности, что указывает на формирование дна. Однако возможна финальная волна распродаж, в результате которой цена может достичь окончательного минимума в районе $51 336 (уровень 61,8% Фибоначчи). Этот уровень совпадает с важной исторической зоной поддержки, средней ценой входа инвесторов и 200-недельной скользящей средней, что характерно для минимумов прошлых медвежьих циклов.

cryptonews.ru1 ч. назад

Аналитик CryptoQuant утверждает, что «пугающий сценарий и одновременно многообещающий сигнал для биткоина» раскрывают окончательную точку минимума! Вот подробности

cryptonews.ru1 ч. назад

Торговля

Спот
活动图片