В начале января 2026 года на рынке появились признаки истощения сил продавцов, что создало возможность для отскока цены к верхней границе текущего торгового диапазона. Однако этот отскок сопряжен с повышенным рисками, поскольку цена приближается к зоне около 98 тысяч долларов, где недавно купившие инвесторы создают активное давление продаж вблизи своей цены безубыточности.
Ключевые выводы
· Структура в сети остается хрупкой: цена колеблется вблизи ключевых уровней себестоимости, отсутствует постоянное подтверждение уверенности долгосрочных держателей.
· Проблема избыточного предложения сохраняется: недавние покупатели сталкиваются с сопротивлением наверху, что ограничивает устойчивость роста и делает любой отскок уязвимым для продаж.
· Потоки спотовых средств становятся позитивными: давление продавцов на основных торговых площадках ослабло, но покупки остаются выборочными, а не повсеместными.
· Поступления в казначейства носят разрозненный характер: активность казначейств носит спорадический, событийно-ориентированный характер и еще не сформировала согласованный тренд покупок, их влияние на общий спрос ограничено.
· Низкое участие на рынке деривативов: объемы фьючерсных сделок сокращаются, использование кредитного плеча осторожное, рынок находится в состоянии низкой активности.
· Давление на опционном рынке лишь краткосрочное: краткосрочная подразумеваемая волатильность реагирует на события риска, в то время как среднесрочная и долгосрочная волатильность остаются стабильными.
· Спрос на хеджирование временно вырос, затем вернулся к норме: всплеск соотношения объемов пут/колл утих, что указывает на тактический, а не стратегический уход от рисков.
· Гамма-позиция дилеров смещена в медвежью сторону: это ослабляет механическую поддержку стабильности цены и повышает чувствительность рынка к ликвидностным шокам.
Глубокий ончейн-анализ
За последние две недели ожидаемый технический отскок в основном реализовался, цена остановилась ниже себестоимости краткосрочных держателей после достижения сопротивления, вновь подтвердив наличие существенного давления продаж наверху. В этом отчете основное внимание уделяется структуре этого «нависающего» предложения и его поведению, раскрывая emerging динамику продавцов.
Технический отскок встречает сопротивление
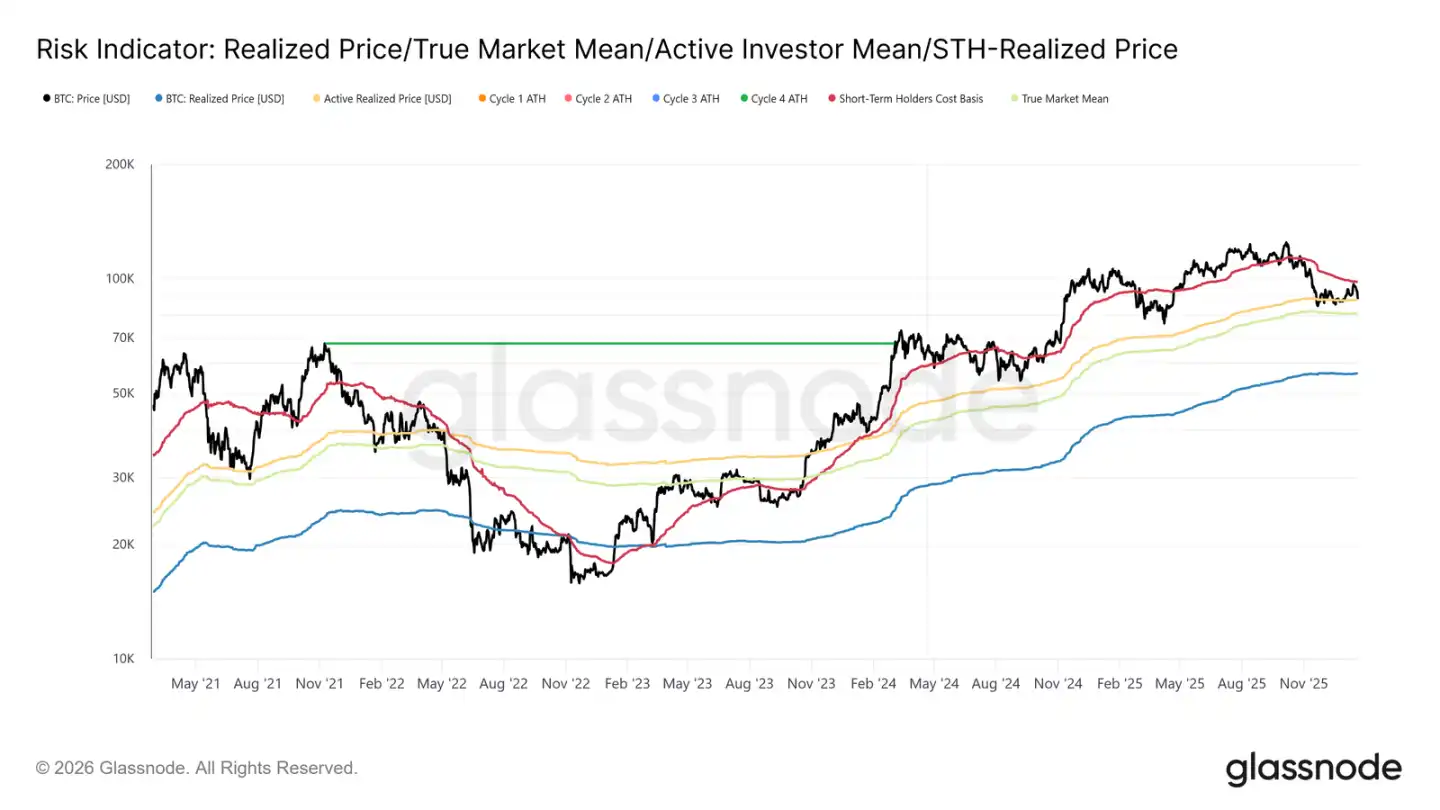
Сформировалась четкая нарратив: рынок находился в фазе умеренного медвежьего тренда. Его нижняя граница поддерживаетсяреальной рыночной средней в 81,1 тыс. долларов, а верхняя ограничена средней себестоимостью краткосрочных держателей. Этот диапазон создает хрупкий баланс, где давление на понижение поглощается, но попытки роста屡次 встречают продажи со стороны инвесторов, покупавших в первом-третьем кварталах 2025 года.
В начале января 2026 года ослабление сил продавцов открыло окно для отскока цены к верхней границе диапазона. Однако по мере приближения цены к зоне около 98 тыс. долларов, готовность недавних покупателей продавать вблизи цены безубыточности усиливается, что повышает риски этого отскока.
Недавняя остановка цены вблизи ~98,4 тыс. долларов (себестоимость краткосрочных держателей) зеркально повторяет структуру рынка первого квартала 2022 года. Тогда рынок多次 не смог эффективно пробить зону себестоимости недавних покупателей, что привело к затяжному периоду консолидации. Это сходство подчеркивает хрупкую природу текущих попыток восстановления.
Давление «нависающего» предложения не ослабевает
Основываясь на наблюдении остановки цены на ключевых уровнях себестоимости, дальнейшее изучение распределения предложения в сети позволяет更清楚地 объяснить, почему восходящий импульс屡屡 ослабевает.
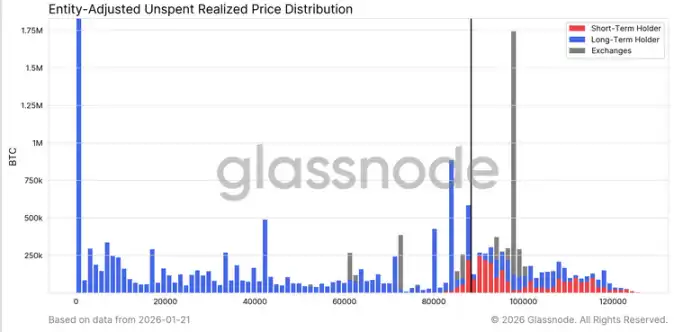
Диаграмма URPD (распределение нереализованной прибыли/убытка) наглядно показывает, почему избыточное предложение выше ~98 тыс. долларов остается основной силой, сдерживающей среднесрочные и краткосрочные отскоки. Недавний отскок частично заполнил «вакуум» между ~93 тыс. и 98 тыс. долларов, в основном за счет перехода монет от ранних покупателей к новым участникам, сформировав新的 кластеры предложения краткосрочных держателей.
Однако распределение предложения выше 100 тыс. долларов показывает, что там существует обширная и плотная зона предложения, и эти монеты постепенно превращаются в持仓 долгосрочных держателей. Это не переваренное «нависающее» предложение является постоянным источником давления продаж и, вероятно, будет удерживать цену ниже 98,4 тыс. долларов (линии себестоимости краткосрочных держателей) и психологической отметки в 100 тыс. долларов. Следовательно, для эффективного пробоя требуется значительное и устойчивое ускорение импульса спроса.
Долгосрочные держатели также создают сопротивление
Расширяя视角 от краткосрочных держателей до долгосрочных, мы видим, что те же структурные ограничения сохраняются.
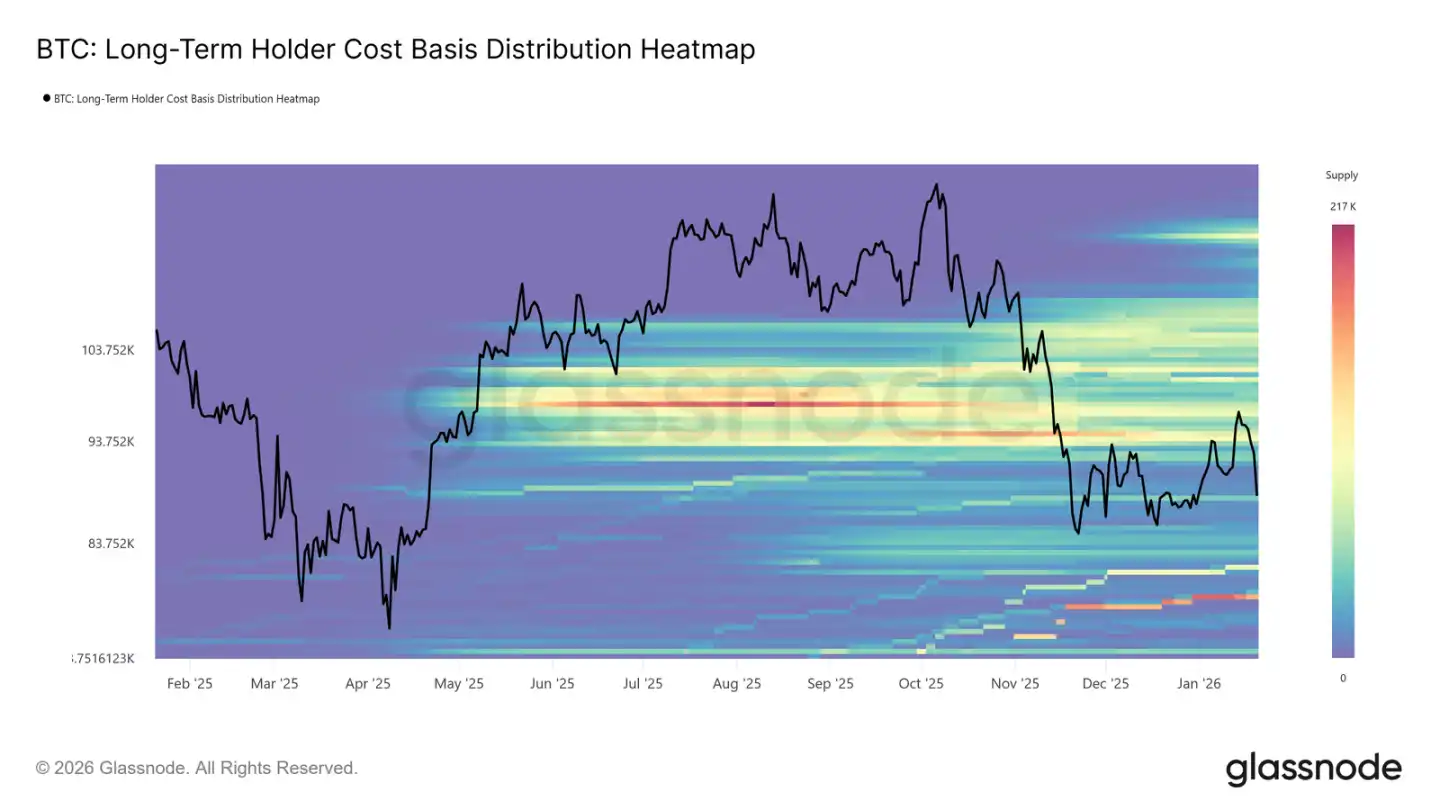
Тепловая карта распределения себестоимости долгосрочных держателей показывает, что выше текущей спотовой цены существует плотная зона исторических цен покупки. При отскоке цены к этим уровням данная область представляет собой巨大的 потенциальную ликвидность продавцов.
Пока не появится новый, достаточно сильный спрос, чтобы поглотить это предложение наверху, долгосрочные держатели всегда будут потенциальным источником сопротивления. Таким образом, пока это «нависающее» предложение не будет彻底 переварено, восходящий потенциал, вероятно, останется ограниченным, а любой отскок будет уязвим для новых продаж.
Отскок встречает фиксацию прибыли и стоп-лосс продажи
Более того, мы можем определить, какие группы инвесторов активно фиксировали (прибыль или убыток) в ходе недавнего роста к ~98 тыс. долларов, тем самым сдерживая цену.
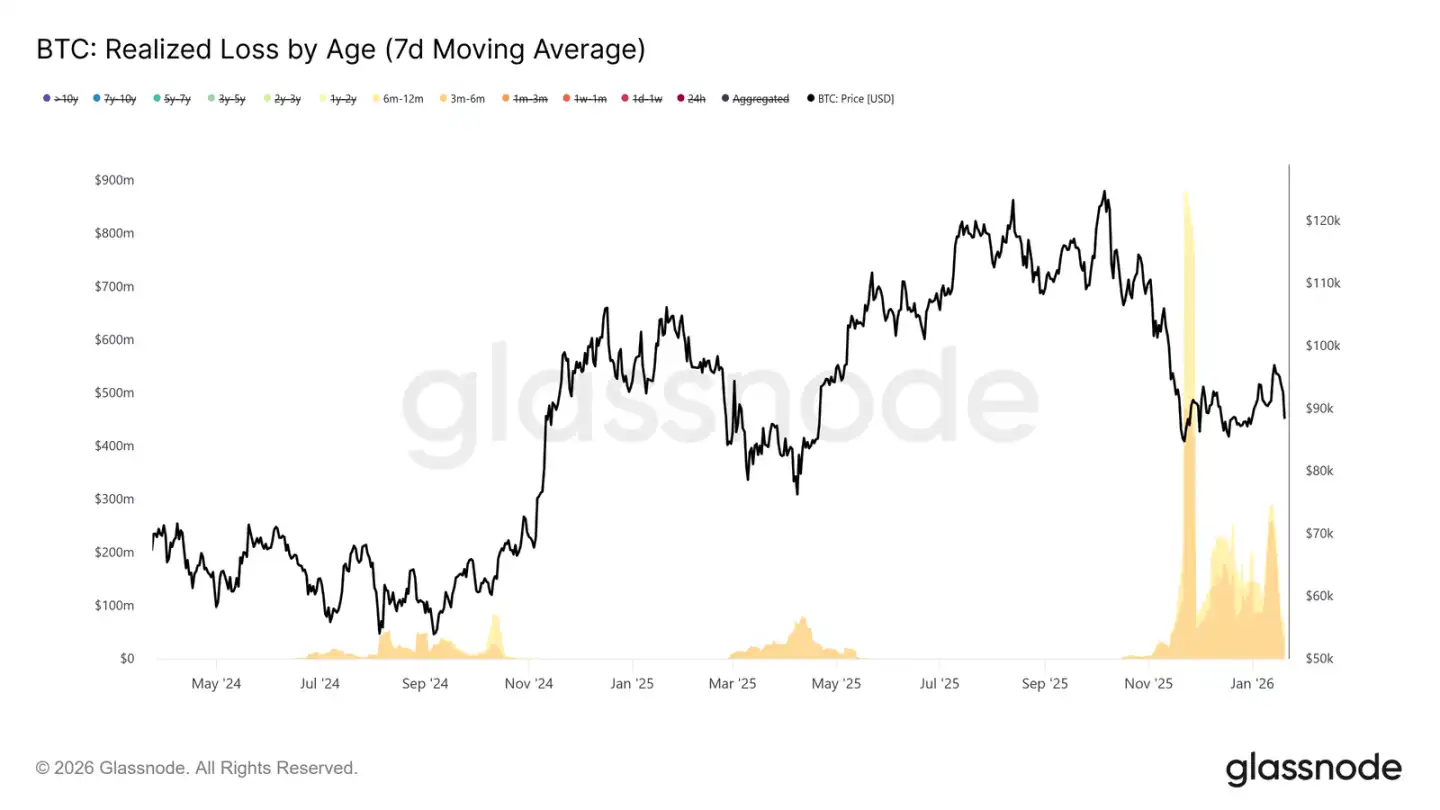
Данные о реализованных убытках, сгруппированные по времени владения, показывают, что убыточные продажи в основном исходили от группы, владеющей монетами 3-6 месяцев, за которой следуют держатели с сроком владения 6-12 месяцев. Такая модель является типичной для «болезненных продаж», особенно распространенных среди тех, кто покупал по ценам выше 110 тыс. долларов и теперь выходит на уровнях, близких к их себестоимости. Такое поведение усиливает давление продавцов вблизи ключевых уровней восстановления.
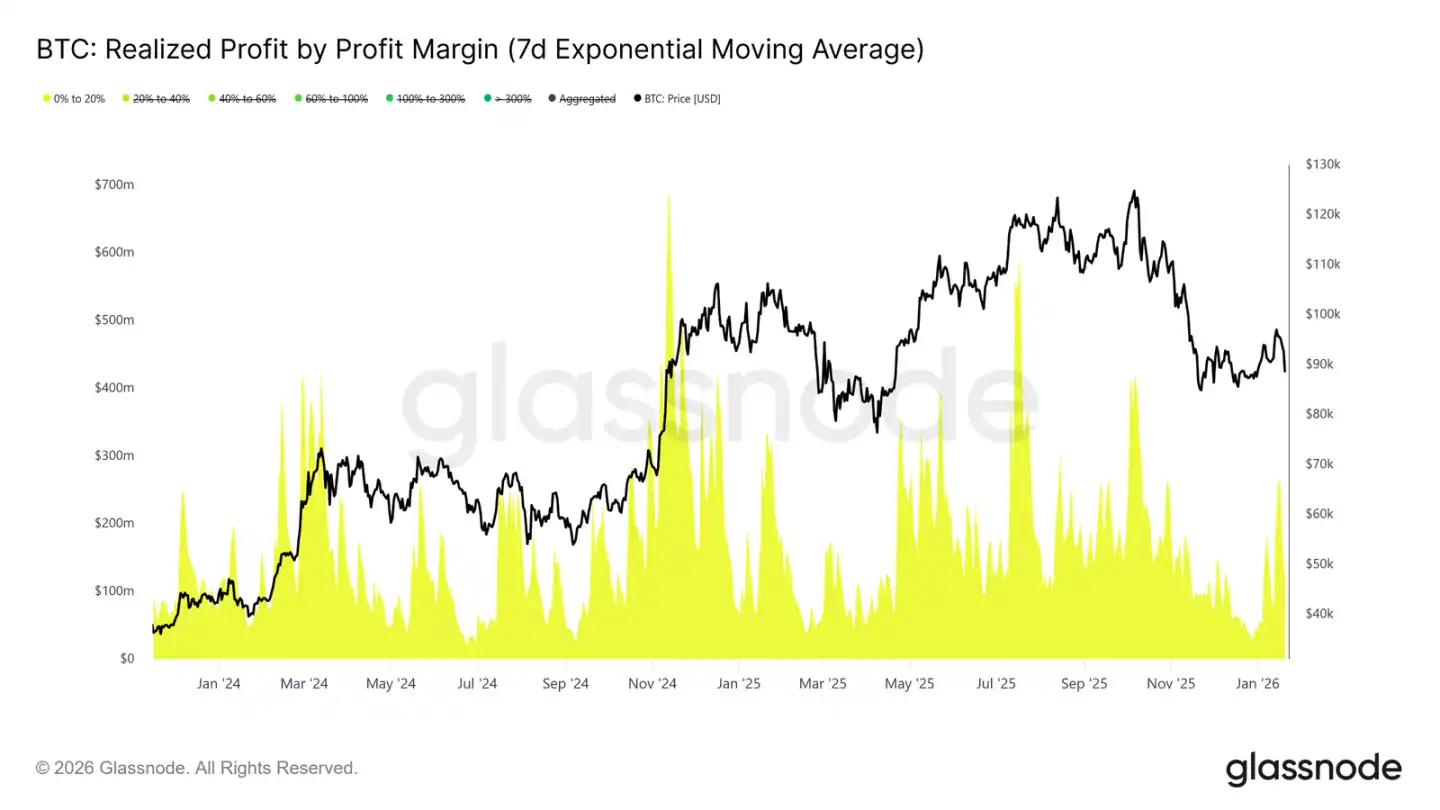
В то же время, данные о реализованной прибыли, сгруппированные по рентабельности, указывают на значительный рост доли фиксации прибыли в диапазоне рентабельности от 0% до 20%. Это подчеркивает влияние «продавцов в точке безубыточности» и краткосрочных свинг-трейдеров, которые склонны выходить при небольшой прибыли, а не ждать продолжения тренда.
Такое поведение常见于 переходных фазах рынка, когда убежденность инвесторов хрупка, и больше внимания уделяется сохранению капитала и тактическому получению прибыли. Рост этих продаж с низкой прибылью постоянно подрывает восходящий импульс, поскольку предложение持续释放 вблизи себестоимости.
Наблюдения за офчейн-рынком
Спотовые потоки становятся позитивными
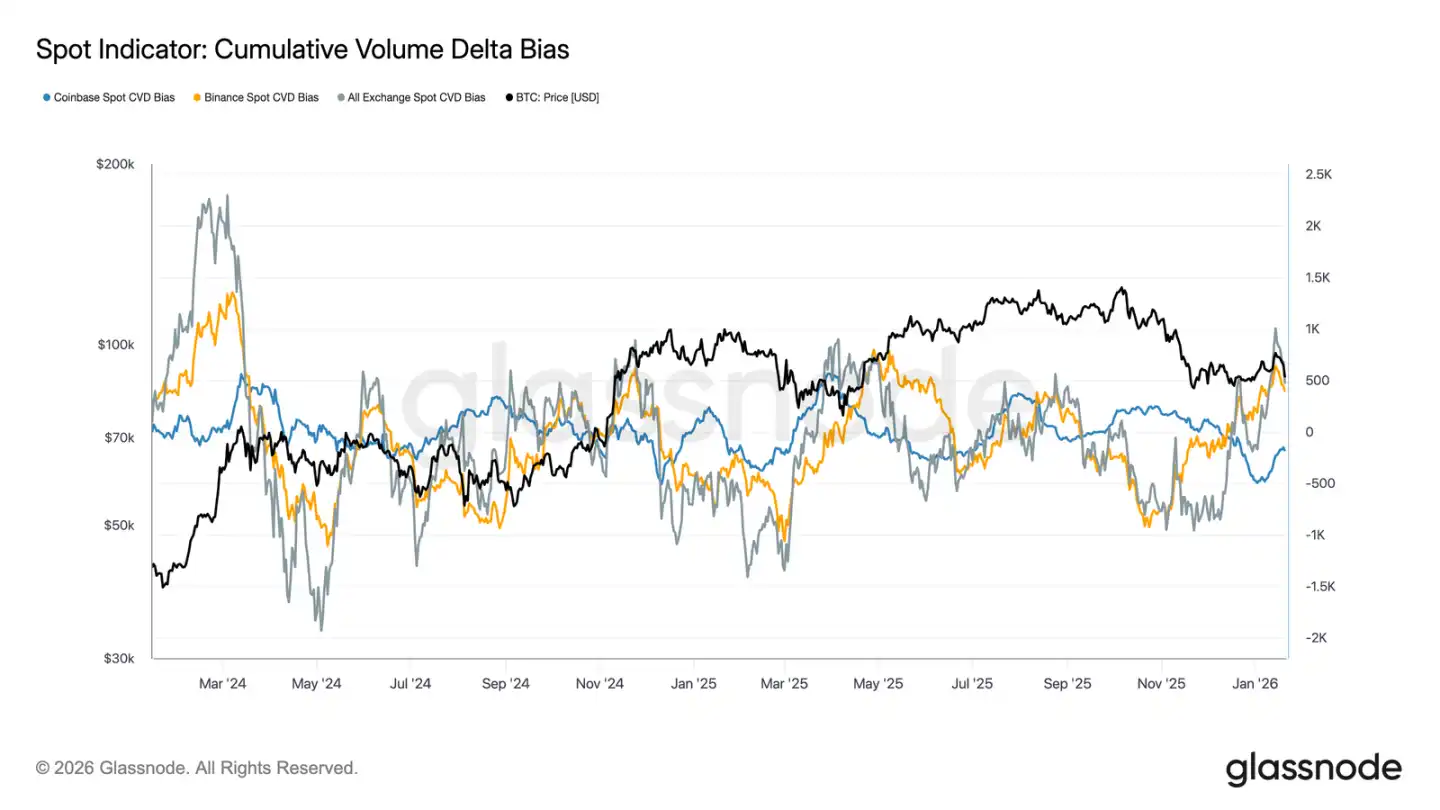
Поведение спотового рынка улучшилось после недавнего падения. Индикатор CVD (Cumulative Volume Delta) на Binance и агрегированный по площадкам вернулся в состояние чистых покупок, что указывает на то, что спотовые участники начали重新 поглощать монеты, а не продавать на росте, что контрастирует с持续 давлением продаж в предыдущий период консолидации.
Coinbase, которая ранее была основным источником продавного давления во время диапазонных движений, также значительно замедлила темпы чистых продаж. Ослабление продажного давления с Coinbase помогает уменьшить предложение наверху, стабилизировать движение цены и поддержать недавний отскок.
Хотя спотовое участие еще не достигло уровня持续 aggressive покупок, характерных для фазы экспансии тренда, возврат основных площадок к чистым покупкам标志着 улучшение базовой структуры спотового рынка.
Поступления в казначейства цифровых активов остаются零星ными
Чистые потоки цифровых активов в казначействах в последнее время остаются零星ными и неравномерными, активность в основном驱动 isolated событиями, а не широким трендом покупок. Хотя в последние недели наблюдались отдельные значительные пики покупок у некоторых компаний, общий корпоративный спрос еще не перешел в режим持续 накопления.
В целом, потоки средств казначейств цифровых активов колеблются в узком диапазоне около нулевой отметки, что указывает на то, что большинство корпоративных казначейств currently находятся в режиме ожидания или机会性操作, а не системного накопления. Это контрастирует с более ранней фазой, когда несколько компаний协同 покупали, ускоряя тренд.
В целом, последние данные показывают, что корпоративные казначейства являются лишь маргинальным, выборочным источником спроса, их влияние носит прерывистый характер и еще не оказывает решающего воздействия на общую динамику цен.

На рынке деривативов затишье
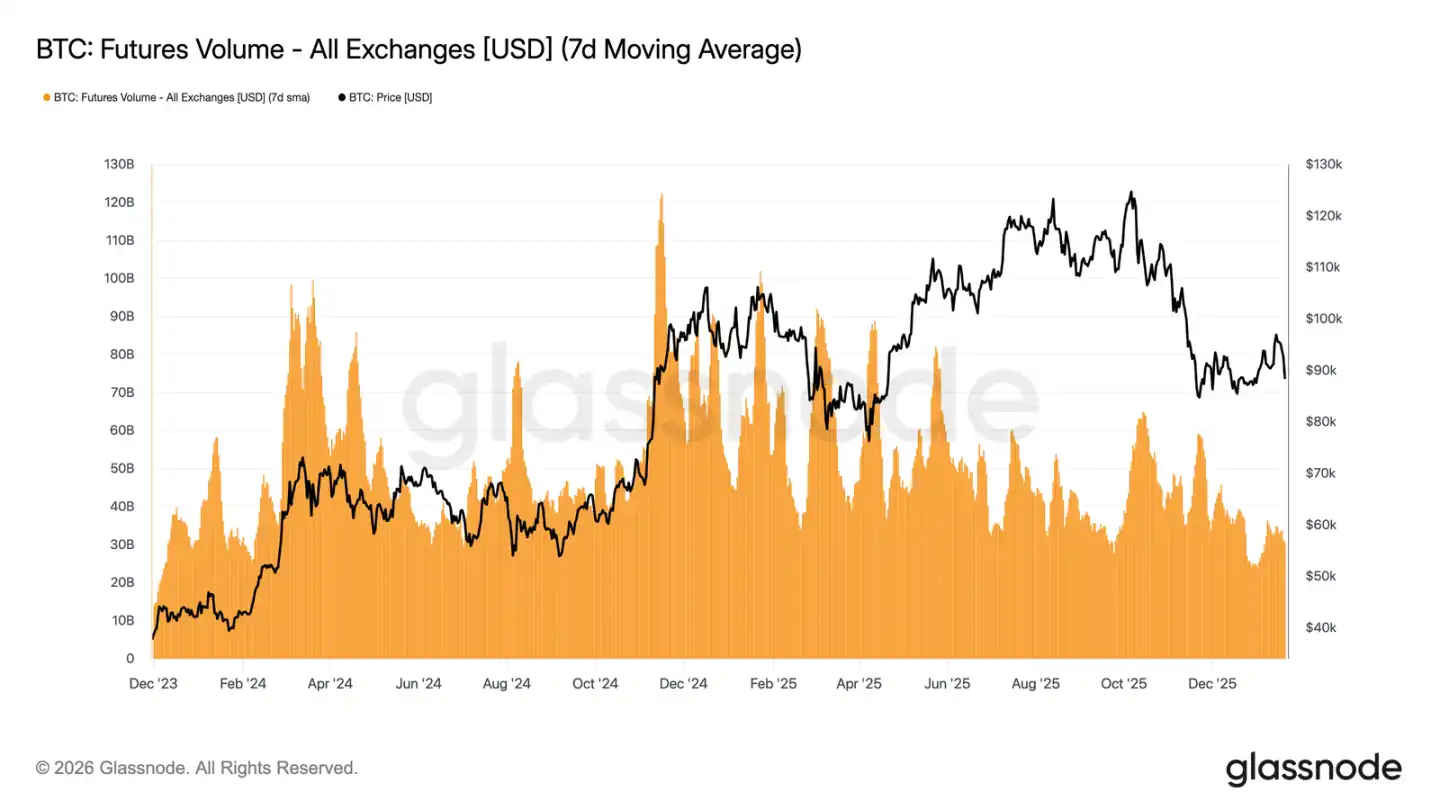
Скользящее среднее объема торгов Bitcoin-фьючерсов за 7 дней продолжает сокращаться, оставаясь значительно ниже уровней,通常 сопровождающих трендовые движения. Недавние ценовые колебания не сопровождались有效放大 объемов, что подчеркивает низкую参与ность и недостаток уверенности на рынке деривативов.
Текущая рыночная структура suggests, что недавние ценовые движения в большей степени驱动 скудной ликвидностью, а не агрессивным размещением позиций. Корректировка открытого интереса также не сопровождалась同步ным ростом объемов, что больше говорит о调整 существующих позиций и ребалансировке рисков, чем о вводе нового плеча.
В целом, рынок деривативов находится в состоянии низкой参与ности, «затишья», со слабым投机兴趣. Эта характеристика «рынка-призрака» означает, что рынок может быть очень чувствителен к любому восстановлению объемов, но в настоящее время его влияние на ценовое обнаружение ограничено.
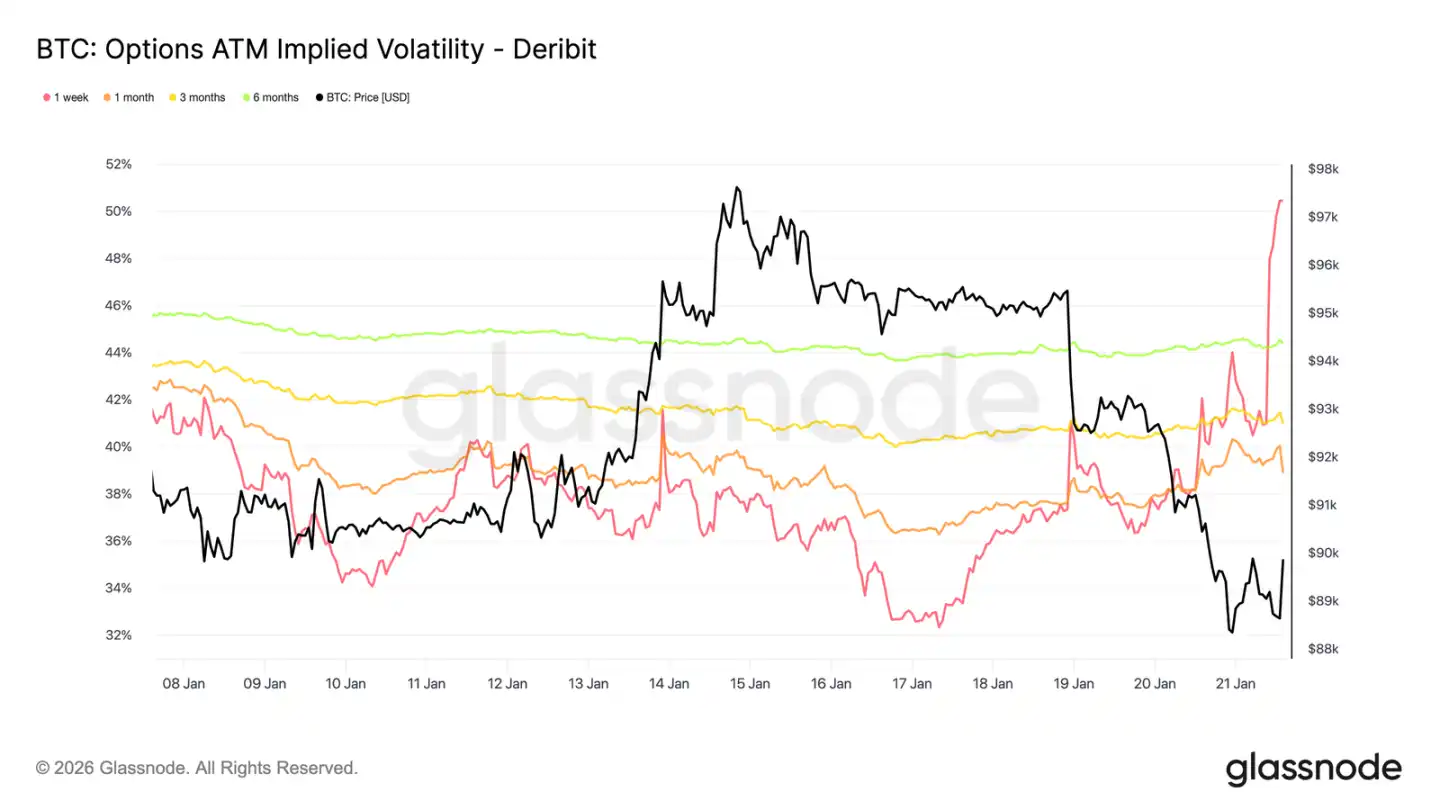
Подразумеваемая волатильность выросла лишь краткосрочно
Спотовые продажи, спровоцированные макроэкономическими и геополитическими новостями,刺激 лишь краткосрочную волатильность. С момента падения в воскресенье недельная подразумеваемая волатильность выросла более чем на 13 пунктов волатильности, в то время как трехмесячная подразумеваемая волатильность выросла лишь примерно на 2 пункта, а шестимесячная几乎 не изменилась.
Такое резкое ужесточение на самом коротком конце кривой волатильности указывает на то, что трейдеры действуют тактически, а не пересматривают среднесрочную структуру рисков. Корректируется только краткосрочная волатильность, что отражает событийную неопределенность, а не сдвиг во всей системе волатильности.
Рынок оценивает кратковременные риски, а не длительные потрясения.
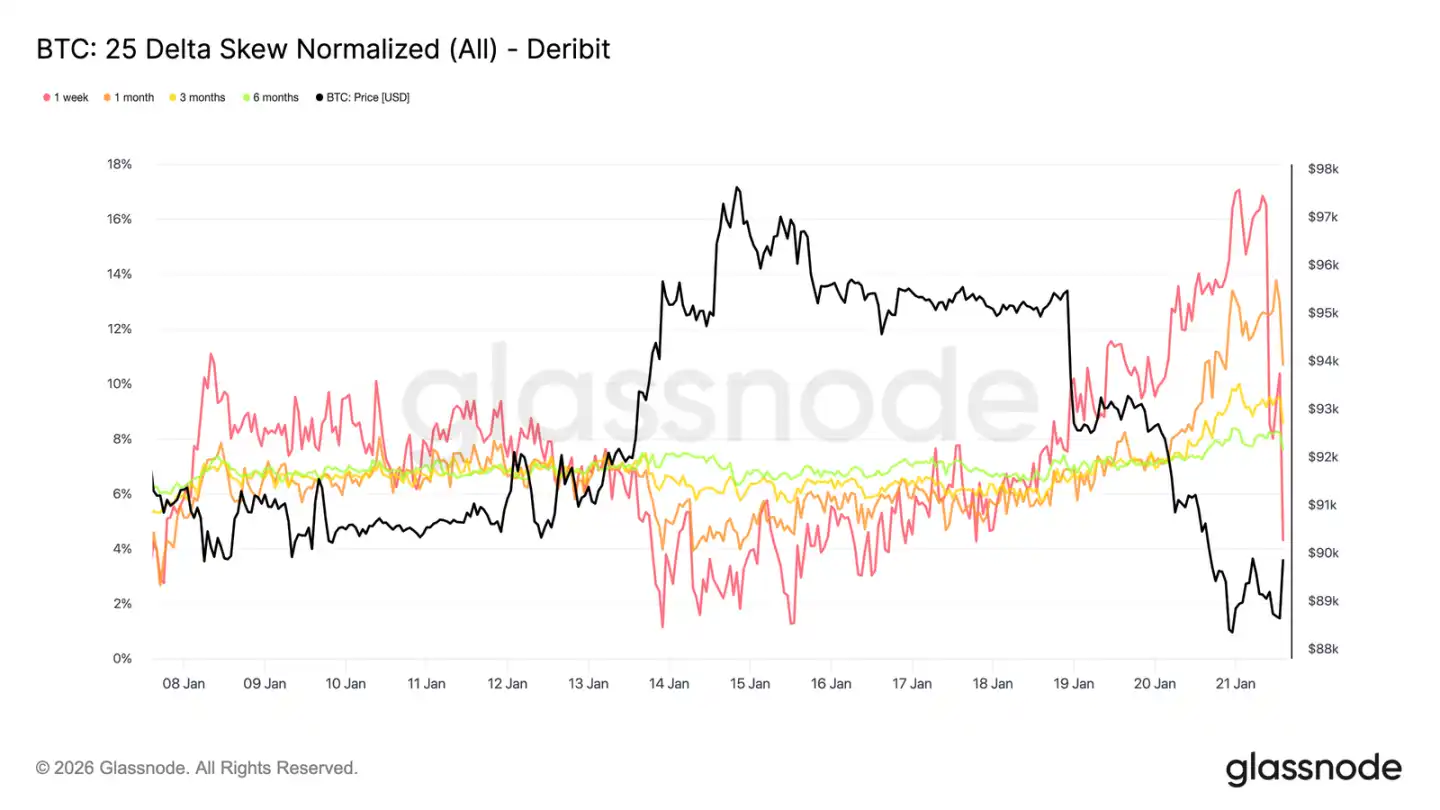
Краткосрочный скип (скиewness) сильно колеблется
Аналогично паритетной волатильности, краткосрочный скип также доминировал в этой корректировке. Недельный 25-дельта скип, который неделю назад был близок к равновесию, резко сместился в сторону «пут-опционы дороже».
С прошлой недели этот показатель скипа сместился в сторону путов примерно на 16 пунктов волатильности, достигнута премия путов почти в 17%. Месячный скип также отреагировал, в то время как более долгосрочные скипы, уже находившиеся в медвежьей зоне, лишь незначительно углубились.
Такое резкое смещение скипа обычно сопровождает локальные экстремальные движения, когда рынок перегружен позициями и ему трудно продолжить исходный тренд. После того как заявлений, связанных с Давосским форумом, были переварены рынком, премия за падение была частично зафиксирована, и скип начал быстро откатываться.
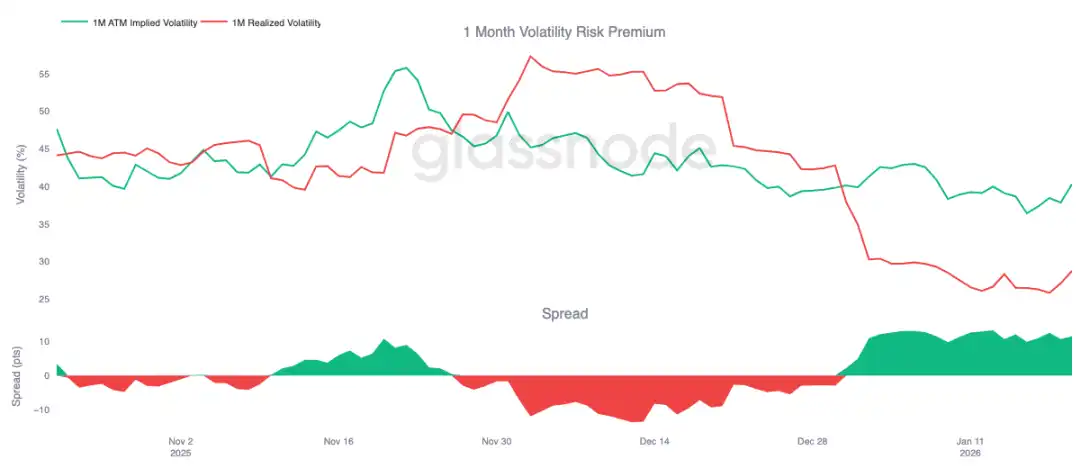
Премия за волатильность остается высокой
Месячная премия за волатильность (VRP) остается положительной с начала года. Несмотря на то, что подразумеваемая волатильность находится на исторически низких абсолютных уровнях, ее оценка по-прежнему持续 выше фактической реализованной волатильности. Другими словами, опционы остаются «дорогими» относительно происходящих ценовых движений.
Премия за волатильность отражает разницу между подразумеваемой и реализованной волатильностью. Положительная премия означает, что продавцы опционов получают компенсацию за принятие риска волатильности. Это создает благоприятную арбитражную среду для стратегии «шорт волатильности» — до тех пор, пока фактическая волатильность остается в ограниченном диапазоне, удержание коротких гамма-позиций может приносить доход.
Эта динамика自我强化, подавляя рост волатильности. Пока продажа волатильности прибыльна, будет больше участников, присоединяющихся к ней, тем самым удерживая подразумеваемую волатильность на низком уровне. По состоянию на 20 января, месячный спред волатильности составлял около 11,5 пунктов в пользу продавцов, что красноречиво говорит о том, что текущая среда по-прежнему благоприятствует продаже волатильности.
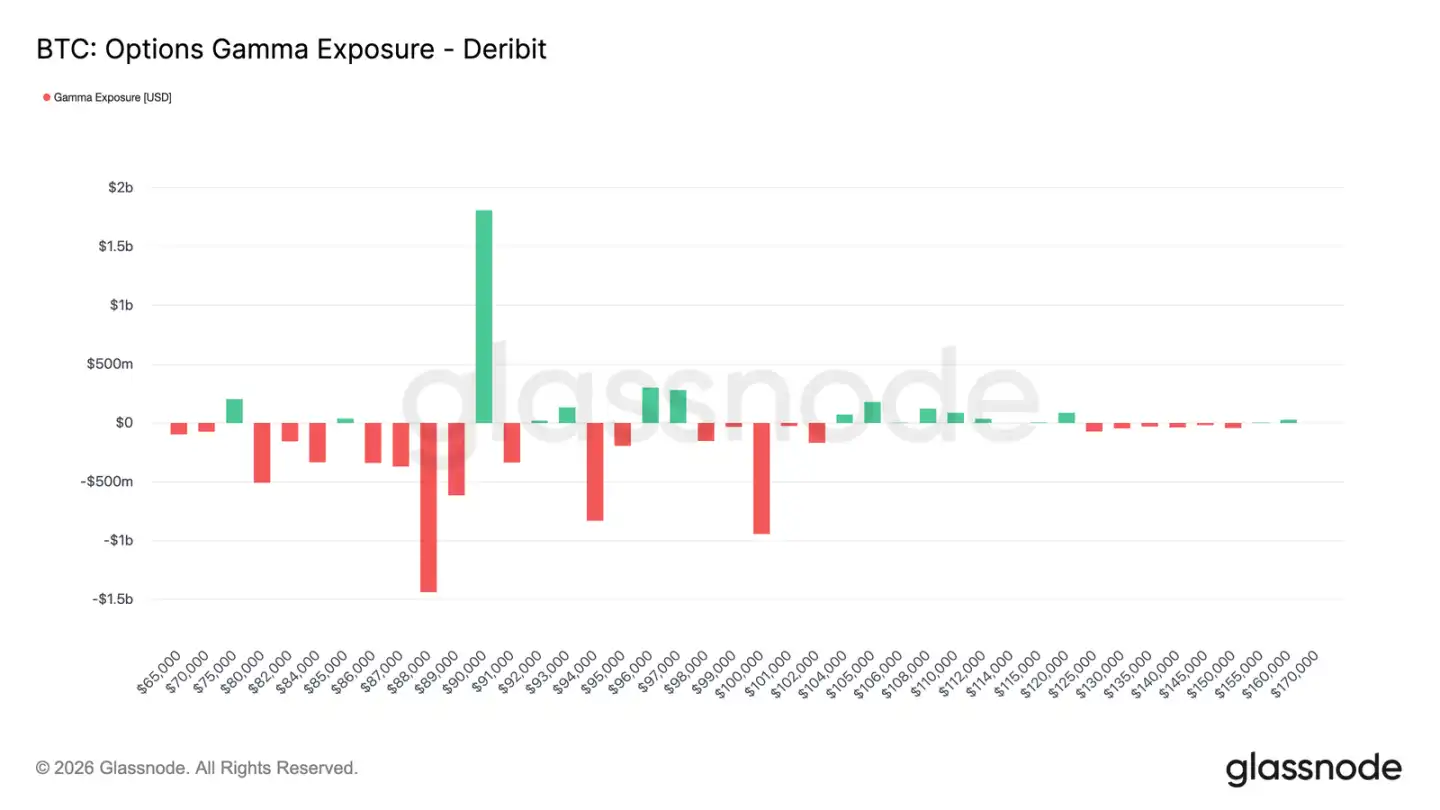
Позиции дилеров стали чисто короткими
Гамма-экспозиция дилеров является ключевой структурной силой, влияющей на краткосрочное ценовое поведение. Недавние потоки показывают, что инвесторы активно покупали защиту от падения, в результате чего дилеры держат короткую гамму ниже 90 тыс. долларов. В то же время, некоторые инвесторы финансировали это, продавая опционы колл, в результате чего дилеры держат длинную гамму выше 90 тыс. долларов.
Это создает асимметричную картину: ниже 90 тыс. долларов дилеры имеют короткую гамму, что означает, что падение цены может自我加速 из-за их хеджирующих操作 (продажа фьючерсов или спота). Выше 90 тыс. долларов длинная гамма дилеров действует как стабилизатор, поскольку рост触发 их хеджирующие покупки, тем самым сдерживая восходящее движение.
Таким образом, поведение цены ниже 90 тыс. долларов, вероятно, останется хрупким, а уровень в 90 тыс. долларов сам по себе станет ключевой точкой трения. Для эффективного и устойчивого пробития этого уровня потребуется достаточный рыночный импульс и уверенность, чтобы переварить хеджирующие потоки дилеров и推 их гамма-экспозицию на более высокие уровни.
Резюме
Рынок Bitcoin остается в состоянии низкой参与ности, текущее движение цены в большей степени обусловлено «ослаблением давления продаж», а не «активными покупками». Ончейн-данные持续揭示问题 избыточного предложения и хрупкой структурной поддержки. Спотовые потоки улучшились, но еще не превратились в устойчивый тренд покупок.
Институциональный спрос остается осторожным, потоки корпоративных казначейств стабилизировались около нуля, активность носит преимущественно спорадический характер. На рынке деривативов交易清淡, объемы фьючерсов сокращаются, использование плеча ограничено, что вместе создает среду низкой ликвидности, где цена异常 чувствительна к незначительным изменениям в позициях.
Опционный рынок также отражает эту сдержанность. Переоценка волатильности ограничилась краткосрочным segmentом, спрос на хеджирование вернулся к норме, а высокая премия за волатильность продолжает якорить общий уровень волатильности.
В целом, рынок,似乎, тихо формирует дно. Текущая консолидация вызвана не перегревом参与ности, а временной паузой в убежденности инвесторов, которые ждут следующего катализатора, способного激发 широкое участие.