Экосистема Ethereum (ETH) сталкивается с сочетанием структурного прогресса и рыночной неопределенности. С одной стороны, разработчики продвигают серию обновлений для повышения масштабируемости, направленных на снижение комиссий и расширение пропускной способности сети.
Читайте по теме: Южная Корея изучает меру по заморозке крипто-счетов для предотвращения манипулирования рынком
С другой стороны, крупные держатели используют недавний рост цен для сокращения экспозиции, создавая краткосрочное давление продаж. Вместе эти противоположные силы формируют ближайшие перспективы Ethereum, пока ETH торгуется выше уровня $3200.
Контраст очевиден: пока протокол поглощает больше капитала через стейкинг и улучшения инфраструктуры, части рынка проверяют, какой объем предложения и спроса может быть поглощен во время нового ралли.
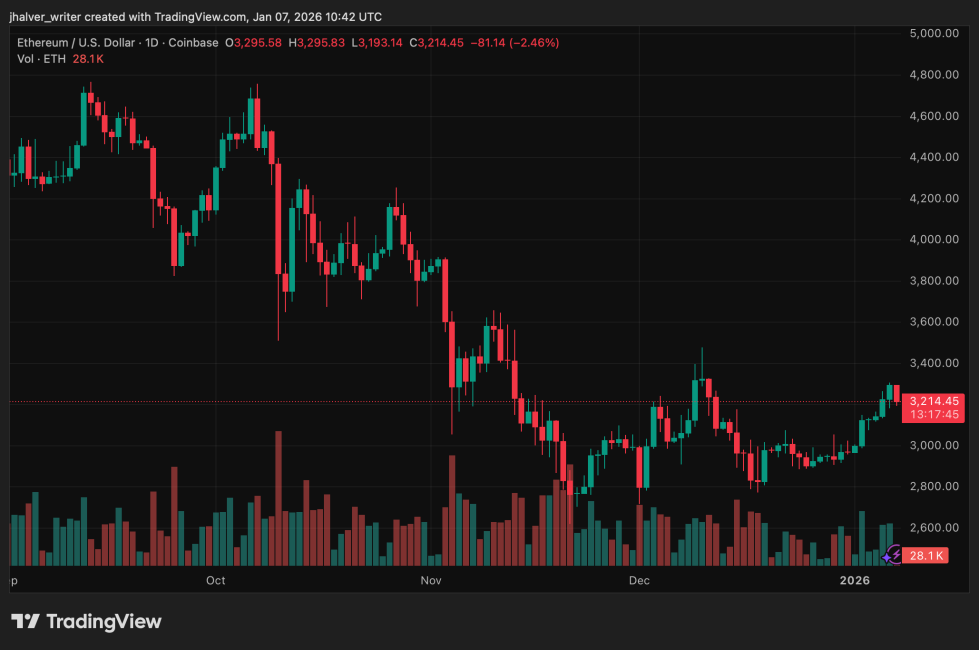
Цена ETH движется в боковом тренде на дневном графике. Источник: ETHUSD на Tradingview
Дорожная карта масштабируемости продвигается вперед
На этой неделе разработчики Ethereum активировали второй хардфорк только с параметрами Blob (BPO), увеличив лимит blob с 15 до 21 и подняв целевой показатель blob с 10 до 14.
Blob — это временные контейнеры данных, используемые в основном роллапами для более эффективного пакетного проведения транзакций. Поскольку каждый blob вмещает 128 килобайт, сеть теперь может обрабатывать примерно 2,6 мегабайта данных blob на блок.
Это обновление является частью более широких усилий по масштабированию Ethereum через сети второго уровня, а не переноса всей активности на основную цепь. С момента первого BPO-форка в декабре комиссии за транзакции в Ethereum показали сниженную волатильность, что отражает меньшую перегруженность по мере того, как роллапы перемещают данные вне цепи.
Разработчики уже обсуждают дополнительные изменения, включая повышение лимита газа с 60 миллионов до 80 миллионов, а затем до 200 миллионов в рамках запланированного хардфорка Glamsterdam в 2026 году. Ожидается, что это обновление внедрит параллельную обработку транзакций, что further увеличит пропускную способность.
Рост стейкинга Ethereum (ETH) сокращает ликвидное предложение
В то же время активность стейкинга меняет динамику предложения Ethereum. Институциональное участие увеличилось, о чем свидетельствуют последние депозиты BitMine, которые позволили довести общее количество поставленных в стейкинг ETH почти до 780 000 токенов стоимостью более $2,5 миллиардов.
Данные по всей сети указывают на то, что более 1,3 миллиона ETH ожидают входа в стейкинг, в то время как очередь на выход валидаторов упала до нуля. Этот дисбаланс предполагает, что меньше валидаторов выбирают выход, даже несмотря на рыночную волатильность.
Поскольку все больше ETH блокируется в контрактах консенсуса, циркулирующее предложение на биржах продолжает сокращаться, что потенциально ограничивает давление на понижение в среднесрочной перспективе.
Продажи китов создают краткосрочное давление
Несмотря на эти фундаментальные факторы, крупные держатели недавно стали чистыми продавцами. Кошельки китов, содержащие от 100 000 до 1 миллиона ETH, продали примерно 300 000 ETH за три дня на сумму около $970 миллионов.
Эти продажи совпали с выходом ETH из нисходящего клина, продолжавшегося несколько недель, что указывает на то, что некоторые киты используют ралли для фиксации прибыли.
Читайте по теме: Анонсирован Scudo: новейшее подразделение Tether по криптовалюте и золоту – вот подробности
В то время как долгосрочные держатели в основном остаются неактивными, что помогает стабилизировать общую структуру, продолжающаяся дистрибуция со стороны китов может замедлить восходящий импульс. Ethereum теперь находится на перепутье, балансируя между прогрессом на уровне протокола и рыночным давлением предложения, пока трейдеры оценивают, сможет ли спрос поддержать следующий этап роста.
Изображение для обложки от ChatGPT, график ETHUSD от Tradingview