Ethereum снова испытывает давление, пытаясь вернуть себе прочную почву около уровня в $3000, что отражает общую волну неопределенности на криптовалютном рынке. Поскольку настроения становятся все более хрупкими, многие альткойны остаются в режиме коррекции, и быки вынуждены защищать ключевые зоны поддержки, чтобы предотвратить более глубокое падение. В этих условиях способность Ethereum расти становится критическим сигналом к тому, стабилизируется ли рынок или текущий медвежий тренд продолжится.
Несмотря на слабость, данные on-chain предполагают, что ETH может приближаться к важному переломному моменту. Согласно данным CryptoQuant, Ethereum приближается к крупной линии поддержки, которая исторически служила сильным полом в периоды высокой волатильности.
В отчете подчеркивается, что реализованная цена адресов накопления Ethereum продолжает расти и теперь приближается к текущей рыночной цене, что указывает на то, что долгосрочное накопление остается активным, даже несмотря на то, что краткосрочные трейдеры колеблются.
Эта динамика важна, потому что уровни стоимости, основанные на накоплении, часто представляют собой зоны, где крупные инвесторы активно защищают свои позиции. Если ETH удержится выше этого растущего диапазона поддержки, рынок может заложить основу для более широкого восстановления.
В отчете CryptoQuant предполагается, что Ethereum может приближаться к одной из своих самых важных структурных зон поддержки, якорной точкой которой является реализованная цена адресов накопления. Этот показатель отслеживает среднюю стоимость входа в позицию (on-chain cost basis) субъектов, которые последовательно накапливают ETH, и он часто ведет себя как «линия обороны» для китов, строящих долгосрочные позиции.
Согласно анализу, этот уровень реализованной цены исторически служил надежным полом: Ethereum никогда не падал ниже этого диапазона во время предыдущих просадок, даже когда условия на broader рынке резко ухудшались (risk-off).
Это историческое поведение важно, потому что оно implies, что киты, занимающиеся накоплением, как правило, агрессивно защищают свою стоимость входа, либо увеличивая экспозицию near поддержки, либо снижая давление продавцов, когда цена приближается к их зоне входа. На практике это может ограничить нисходящий импульс и создать зону стабилизации, где волатильность сжимается перед следующим решением по тренду.
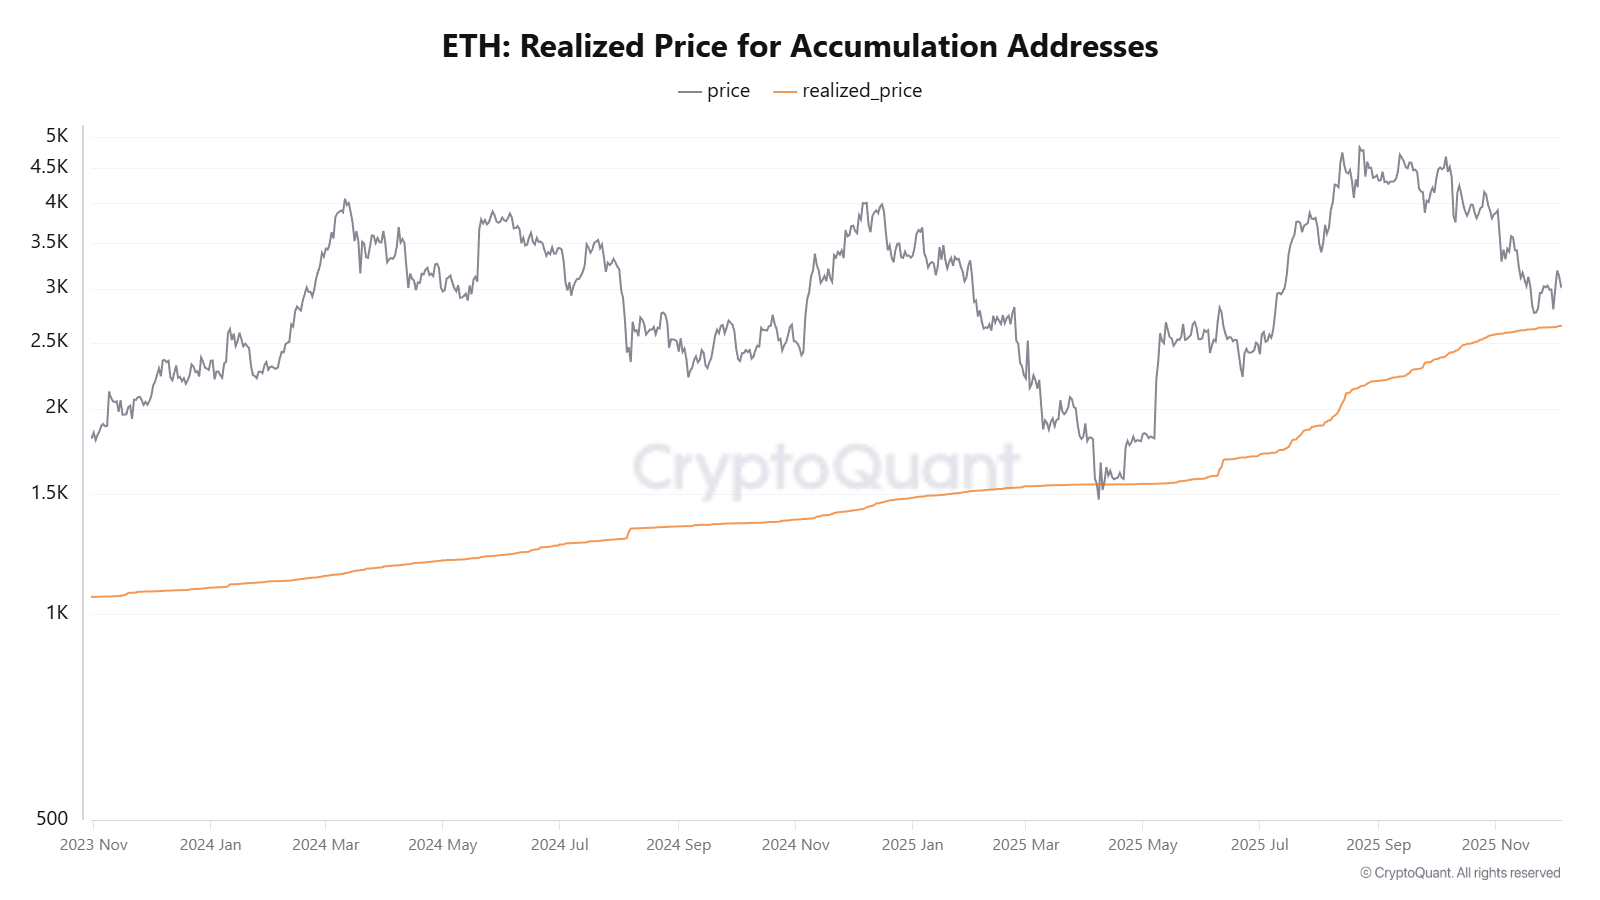
Основываясь на текущей траектории, в отчете утверждается, что даже если ETH увидит очередной виток падения, наиболее вероятная «зонa дна» находится near $2720. От текущих уровней это будет представлять собой дополнительную просадку примерно на 7%, что удерживает движение в рамках контролируемой коррекции, а не полного обвала. Если покупатели защитят эту область, Ethereum сможет начать восстанавливать базу для нового рывка обратно выше $3000.